Greenhouse Gas Balance of Sphagnum Farming on Highly Decomposed Peat at Former Peat Extraction Sites
←
→
Page content transcription
If your browser does not render page correctly, please read the page content below
Ecosystems
https://doi.org/10.1007/s10021-021-00659-z
                                                                                                       2021 The Author(s)

           Greenhouse Gas Balance
       of Sphagnum Farming on Highly
       Decomposed Peat at Former Peat
               Extraction Sites
Jan Oestmann,1* Bärbel Tiemeyer,1 Dominik Düvel,1 Amanda Grobe,2 and
                          Ullrich Dettmann1,3

1
 Thünen Institute of Climate-Smart Agriculture, Bundesallee 65, 38116 Braunschweig, Germany; 2Institute of Environmental Plan-
 ning, Leibniz University Hannover, Herrenhäuser Str. 2, 30419 Hannover, Germany; 3Institute of Soil Science, Leibniz University
                                    Hannover, Herrenhäuser Str. 2, 30419 Hannover, Germany

ABSTRACT
For two years, we quantified the exchange of car-                         y-1 and were mainly influenced by low water
bon dioxide (CO2), methane (CH4) and nitrous                              table depths. CH4 emissions were low with the
oxide (N2O) at two different large-scale Sphagnum                         exception of plots with higher Eriophorum covers,
farming sites. At both, peat extraction left a shallow                    while fluctuating water tables and poorly devel-
layer of highly decomposed peat and low hydraulic                         oping plant covers led to considerable N2O emis-
conductivities. One site was characterized by pre-                        sions at the ditch irrigation site. The removal of the
ceding multi-annual inundation and irrigated by                           upper vegetation at the near-natural site resulted in
ditches, while the other one was inoculated directly                      increased CH4 emissions and, on average, lowered
after peat extraction and irrigated by ditches and                        CO2 emissions. Overall, best plant growth and
drip irrigation. Further, GHG emissions from an                           lowest GHG emissions were measured at the pre-
irrigation polder and the effect of harvesting                            viously inundated site. At the other site, drip irri-
Sphagnum donor material at a near-natural refer-                          gation provided more favourable conditions than
ence site were determined. GHG mitigation                                 ditch irrigation. The size of the area needed for
potentials lag behind the results of less decomposed                      water management (ditches, polders) strongly af-
sites, although our results were also affected by the                     fected the areal GHG balances. We conclude that
extraordinary hot and dry summer 2018. CO2 ex-                            Sphagnum farming on highly decomposed peat is
changes ranged between -0.6 and 2.2 t CO2-C ha-1                          possible but requires elaborate water management.

                                                                          HIGHLIGHTS
Received 16 July 2020; accepted 16 May 2021

Supplementary Information: The online version contains supple-             Sphagnum farming is possible on highly decom-
mentary material available at https://doi.org/10.1007/s10021-021-0065       posed peat.
9-z.                                                                       GHG exchange was mainly affected by water
Author Contributions BT, JO and UD designed the study; JO, DD and
AG performed the research; UD, BT, DD and JO wrote code; all authors        table depth and vegetation development.
contributed to data analysis; JO wrote the first draft, and all authors    CH4 and N2O may influence GHG balances of
contributed to the final manuscript.                                        inadequately managed sites.
*Corresponding author; e-mail: jan_oestmann@yahoo.de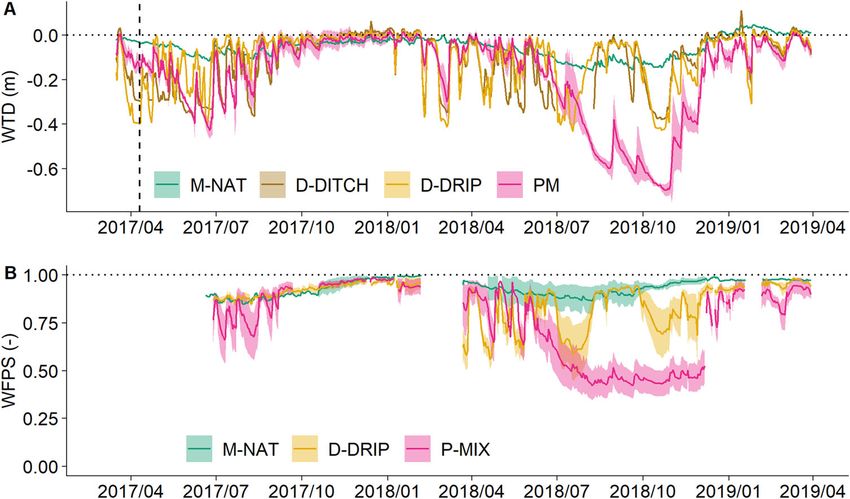
J. Oestmann and others

INTRODUCTION                                               In this study, the cultivation sites were estab-
                                                        lished following the moss layer transfer technique
Drained and intensively used peatlands emit large       (Quinty and Rochefort 2003). Data on the effect of
amounts of greenhouse gases (GHG) into the              harvesting donor material are scarce, but need to
atmosphere (Waddington and Price 2000; Tiemeyer         be considered when assessing the GHG balance of
and others 2020). Re-wetting these areas as soon as     Sphagnum cultivation. It is suggested that harvested
possible is the most effective measure to mitigate      sites recover quickly (Silvan and others 2017; Krebs
climate warming in the long term (Günther and          and others 2018; Guene-Nanchen and others 2019)
others 2020; Wilson and others 2016b). However,         and might return to their pre-disturbance carbon
raising water table depths (WTD) hinders conven-        balance naturally within a few years (Murray and
tional land use. Ecological and economic goals          others 2017), but further research is of special
could be combined by implementing the concept of        importance in areas such as Germany where near-
paludiculture, that is, the production of biomass       natural sites are extremely rare.
under wet and peat preserving conditions using             Peat mosses possess no roots and rely on pre-
suitable wetland crops (Wichtmann and others            cipitation and capillary water supply. As moisture
2016). Under nutrient-poor and acidic conditions,       controls Sphagnum photosynthesis and productivity
that is, on bog peat, the cultivation of peat mosses    (McNeil and Waddington 2003), the adjustment of
(Sphagnum farming) is the most promising land-use       a high and stable water table is the key factor of a
option (Gaudig and others 2018). Harvested moss         successful cultivation of peat mosses (Pouliot and
fragments can be spread in degraded peatlands in        others 2015). Previous Sphagnum farming trials
order to accelerate vegetation restoration (Quinty      have been relatively small in scale (0.10 to 1.1 ha,
and Rochefort 2003) or Sphagnum fibres can be           Brown and others 2017; Beyer and Höper 2015;
used as a sustainable resource in horticultural         Günther and others 2017), where WTDs are rela-
substrates (Emmel 2008), substituting fossil weakly     tively easy to control. Thus, there is still a gap in
decomposed (‘white’) peat and this way relieving        knowledge on which irrigation technique is most
the pressure of ongoing peat extraction on pristine     suitable in large-scale peat moss cultivation
peatlands.                                              regarding optimum growth of mosses and maxi-
   Besides providing habitat for endangered flora       mum GHG mitigation. The most common tech-
(Gaudig and Krebs 2016) and fauna (Muster and           niques are subsurface irrigation (Brown and others
others 2015; Zoch and Reich 2020), re-wetting, for      2017, Gaudig and others 2017) and irrigation dit-
example, for Sphagnum farming has major impact          ches (Beyer and Höper 2015; Brown and others
on the GHG exchange of the cultivation sites. If        2017; Günther and others 2017), while drip irri-
water tables can be kept close to ground surface,       gation has not yet been tested.
carbon dioxide (CO2) emissions can be reduced,             In contrast to previous studies, this study is the
stopped or even reversed (Wilson and others             first to explore the feasibility and the GHG ex-
2016a). Previous studies in northwest Germany           change of large-scale Sphagnum farming on shal-
hint towards a rapid recovery of Sphagnum farming       low, highly decomposed peat remaining after
sites as sinks of atmospheric carbon (Beyer and         industrial peat extraction. The high degree of
Höper 2015; Günther and others 2017). On the          decomposition of the peat imposes new challenges
other hand, quasi-natural hydrological conditions       to large-scale Sphagnum farming as the concomitant
favour the production of methane (CH4). On              low porosity and hydraulic conductivity (Liu and
average, CH4 emissions of classically re-wetted sites   Lennartz 2019) cause strong fluctuations of WTDs
are comparable to those of natural sites (Wilson        and poor water supply from ditches. This raises the
and others 2016a). CH4 emissions from Sphagnum          question whether highly decomposed peat can
cultivation sites have so far been found to be very     support Sphagnum farming.
low (Beyer and Höper 2015; Günther and others            A further challenge is the irrigation water: sur-
2017) due to the strictly controlled water tables and   face and groundwater might be unsuitable due to
the low abundance of aerenchymous species.              high nutrient, electric conductivity (EC) and pH
Drained peatlands can release relevant amounts of       levels, while rainwater storage requires space.
nitrous oxide (N2O) (Regina and others 1996; Tie-       ‘Classical’ bog re-wetting after peat extraction is
meyer and others 2020), whereas the N2O emis-           frequently done by creating water-filled polders
sions of Sphagnum farming field sites are close to      separated by dams, which are to undergo succes-
zero (Beyer and Höper 2015; Günther and others        sion towards peatland vegetation (Blankenburg
2017).                                                  2004). Such polders could also be used to store and
                                                        deliver water to Sphagnum cultivation sites, but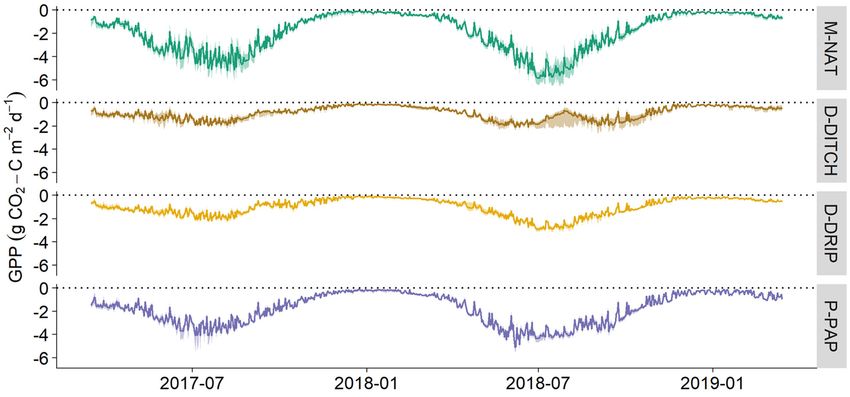
Sphagnum farming on highly decomposed peat

need to be included into an areal GHG balance of a     losum, Sphagnum pulchrum, Sphagnum cuspidatum,
Sphagnum cultivation system. Such data are             Rhynchospora alba, Molinia caerulea, Vaccinium oxy-
important as high emissions have been reported for     coccos, Erica tetralix, Drosera rotundifolia and Erio-
inundated fens (Franz and others 2016; Hahn and        phorum angustifolium. Close to the measurement
others 2015).                                          plots, the upper 5 cm of Sphagnum vegetation was
   Vascular plants emerge even in strongly con-        harvested and used for the inoculation of parts of
trolled Sphagnum farming systems. They could, on       Provinzialmoor (P-MIX). As the area is—as nearly
the one hand, compete with Sphagnum for re-            all potential donor sites in Germany—strictly pro-
sources and are unwanted in the produced sub-          tected, mosses were selectively manually har-
strate. On the other hand, vascular ‘shelter’ plants   vested. Meerkolk is hereafter referred to as near-
have been shown to be beneficial for Sphagnum          natural reference site. GHGs were measured at a
development by creating microhabitats with higher      control site (M-NAT) and at a harvest site where
soil moisture and protection from excess solar         the upper 5 cm of vegetation were removed in
radiation and wind (McNeil and Waddington 2003;        April 2017 (M-HAR).
McCarter and Price 2015). Further, species com-           Both Provinzialmoor and Drenth are former sites
position will influence the GHG exchange, for          of industrial peat extraction with remaining peat
example, by increasing CH4 emissions via               thicknesses of about 90 cm and 45 cm, respec-
aerenchymous tissues (Gray and others 2013).           tively. Both sites are Ombric Hemic Histosols. The
   Consequently, the objective of this study is to     lower part of the profile is moderately decomposed
determine areal GHG balances of large-scale            fen peat overlying a relictic gley and the upper part
Sphagnum farming on a highly decomposed peat           moderately to highly decomposed bog peat. The
soil including emissions from the irrigation system,   major difference between the two areas is that
dams (using literature data) and projected harvest     Provinzialmoor has been re-wetted in 2008 after
in comparison with a near-natural bog. Special         the termination of peat extraction as a system of
emphasis is put on the influence of different irri-    large ( 1.6 to 4.2 ha) shallow polders, while
gation techniques (ditch irrigation, drip irrigation   Drenth is a narrow strip of seven polders installed
and a combination of ditch irrigation and preceding    in 2015 directly after terminating peat extraction
multi-annual inundation) and on the effect of          without any previous re-wetting. Thus, Drenth is
harvesting Sphagnum donor material at the near-        not surrounded by water bodies and re-wetted
natural site.                                          peatlands but by ongoing peat extraction. The
                                                       inoculation of Sphagnum mosses was performed
                                                       following the moss layer transfer technique
MATERIALS     AND   METHODS
                                                       (Quinty and Rochefort 2003). In brief, small frag-
Study Sites and Implementation                         ments of peat mosses were spread evenly and
of the Sphagnum Cultivation Areas                      covered with straw mulch (details in Graf and
                                                       others 2017) and developed into new moss plants.
We measured GHGs at two Sphagnum cultivation
                                                       Along with the Sphagnum mosses, vascular plants
areas (‘Provinzialmoor’, 5240¢ N, 0706¢ E and
                                                       were also transferred. In order to prevent negative
‘Drenth’, 5241¢ N, 0705¢ E) and a near-natural
                                                       feedback of dominant vascular plants on peat moss
peat bog (‘Meerkolk’, 5238¢ N, 0708¢ E) from
                                                       development and substrate quality, the cultivation
March 2017 to March 2019 (Fig. 1). All sites are
                                                       sites were mowed 1–2 times a year.
situated approximately 20 km northwest of Lingen,
                                                          In Drenth, water is pumped from two ponds,
Lower Saxony, Germany. The climate is oceanic
                                                       which were additionally replenished with deeper
with an average annual precipitation of 791 mm
                                                       ground water in dry periods. Excess irrigation wa-
and an average annual temperature of 9.8 C
                                                       ter is channelled back to the ponds. The sites were
(1971–2000, Lingen, German Weather Service).
                                                       inoculated with Sphagnum papillosum in October
   Meerkolk, a last remainder of a once vast peat-
                                                       2015. Due to the poor growth of mosses, parts were
land complex, is a former bog pool characterized by
                                                       re-inoculated with Sphagnum palustre in April 2017.
partially floating peat moss and cotton grass mats
                                                       GHGs were measured at two of these polders
with a peat thickness of about 350 cm. The upper
                                                       (0.4 ha each): one irrigated by ditches (D-DITCH)
53 cm are weakly decomposed, and the lower part
                                                       and the other one by drip irrigation (D-DRIP). Drip
is highly decomposed with a high water content
                                                       irrigation was installed in April 2017 and the site
(Table 1). The site can be classified as an Ombric
                                                       was irrigated via subsurface drain pipes until then.
Fibric Histosol (IUSS Working Group WRB 2015).
                                                          In Provinzialmoor, one of the polders (2.3 ha)
The dominating plant species are Sphagnum papil-
                                                       was prepared for Sphagnum cultivation in 2015 by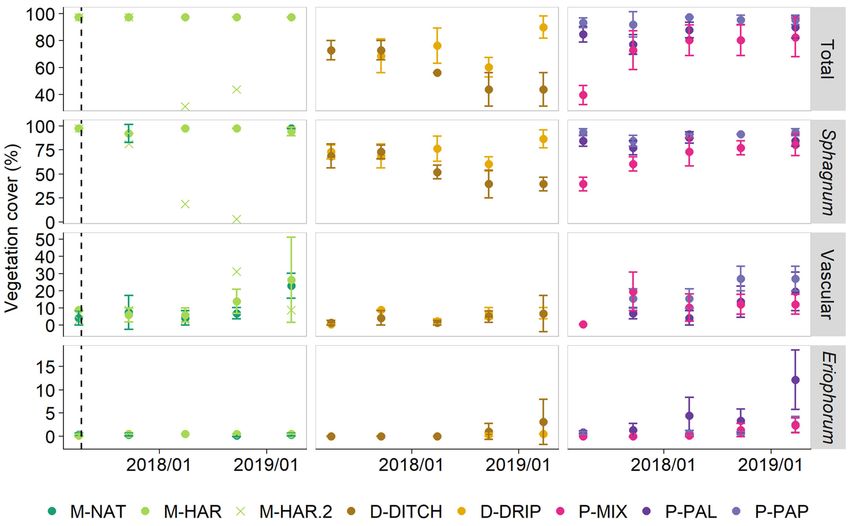
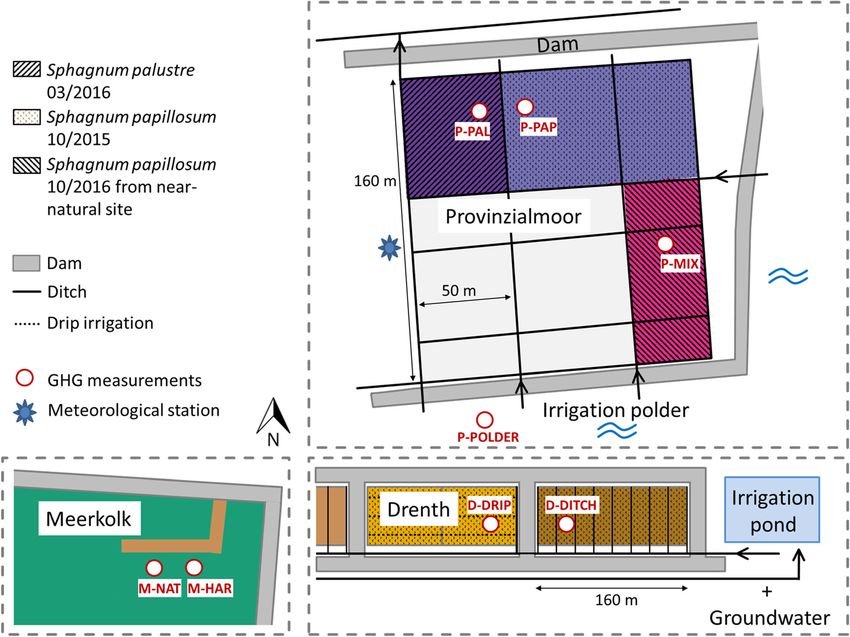
J. Oestmann and others

Figure 1. Scheme (not true-to-scale) of study sites (near-natural area Meerkolk and two cultivation areas Provinzialmoor
and Drenth) after Graf and others (2020, modified). The background colours of the respective sites are maintained in all
figures.

lowering the water table to the peat surface and               Environmental Parameters
profiling the ground. Different parts were inocu-
lated with different peat moss species, that is, with          Hydrological and Meteorological Characteristics
Sphagnum papillosum in October 2015 (P-PAP), with              A meteorological station in Provinzialmoor (Fig. 1)
Sphagnum palustre in March 2016 (P-PAL) and with               measured soil temperature (2 cm), air temperature
a mix of Sphagnum hummock species from Meer-                   and relative humidity (2 m), wind speed, photo-
kolk in October 2016 (P-MIX), although Sphagnum                synthetic active radiation and global radiation. All
papillosum was the dominant species (Fig. 1). Water            hydro-meteorological data were recorded in 30-
is supplied by the surrounding polders and is dis-             min intervals. Each GHG measurements site con-
tributed via shallow ditches. To avoid inundation,             sisted of three replicate plots, and at all plots, soil
surplus water is discharged to a drainage ditch.               temperatures (2 cm) were measured from June
Unfortunately, drainage pipes (30 m drain spacing)             2017 onwards. At the meteorological station, 15%
have been discovered and destroyed only after                  of the temperature and 2% of radiation data were
termination of measurements. GHGs were also                    missing and filled with data of the German
measured at the southern irrigation polder (P-                 Weather Service (station Lingen, 20 km away). In
POLDER) which was subjected to seasonal fluctu-                Meerkolk (M-NAT), 14% of soil temperature val-
ations of the water table (- 0.21 to 0.56 m). The              ues were missing and replaced by meteorological
measurement plots are located approximately 6 m                station data. In Drenth (D-DRIP) and Provinzial-
away from the shore, with a sparse cover of sub-               moor (P-MIX), it was 29% and 23%, respectively.
merged peat moss (Sphagnum cuspidatum).
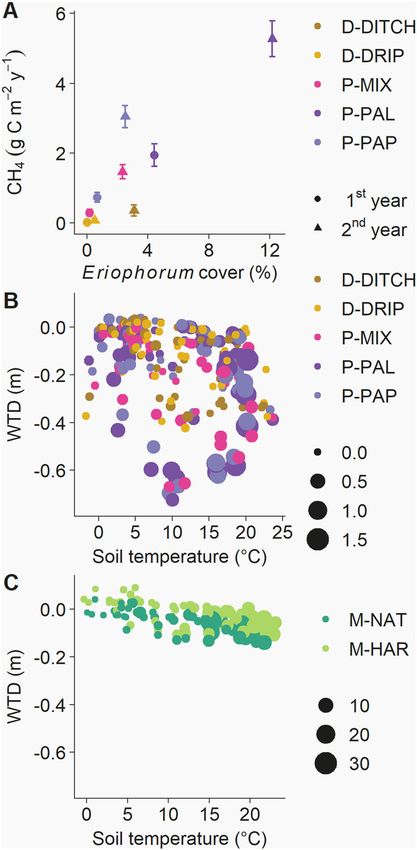
Table 1.        Soil Properties of Sites
Area                    Sites            Peat   Horizon Von Peat type                                         SOC Nt    CN-                     pH     BD                                    Field               Ks
                                         depth depth    Post                                                   (%)  (%) ratio                           (g cm-3)               (cm3           capacity             (m d-1)
                                           (cm)  (cm)     (-)                                                             (-)                                                  cm-3)            (cm3
                                                                                                                                                                                                cm-3)

Meerkolk                M-NAT,           350          0–18          H1        Sphagnum peat                   45.9       0.72        64.1       3.3    n.d                 n.d                n.d                 n.d
                         M-HAR
                                                      18–30         H2        Sphagnum peat                   52.9       1.10        48.0       4.1    n.d                 n.d                n.d                 n.d
                                                      30–53         H3        Sphagnum peat                   50.7       1.54        32.8       n.d    n.d                 n.d                n.d                 n.d
                                                      53–65         H6        Sphagnum peat                   53.3       1.35        39.4       3.2    n.d                 n.d                n.d                 n.d
Drenth                  D-DITCH          43           0–15          H8        Sphagnum peat                   51.4       1.20        42.6       3.3    0.19 ± 0.01         0.85 ± 0.04        0.44 ± 0.06         0.18 ± 0.21
                                                      15–27         H5        Eriophorum-Sphag-               53.8       1.15        46.7       3.4    0.17 ± 0.01         0.88 ± 0.02        0.48 ± 0.02         0.18 ± 0.21
                                                                                num peat
                                                      27–43         H7        Sedge-wood peat                 59.9       1.68        35.7       3.0    0.11 ± 0.00 0.91 ± 0.03 0.51 ± 0.07
Drenth                  D-DRIP           40           0–16          H8        Sphagnum peat                   50.2       1.19        42.1       3.4    0.21 ± 0.01 0.88 ± 0.02 0.55 ± 0.08 n.d
                                                      16–30         H7        Sphagnum peat with              54.6       1.13        48.2       2.9    0.18 ± 0.01 0.93 ± 0.04 0.56 ± 0.03
                                                                                Eriophorum
                                                      30–40         H5        Sedge-wood peat                 57.8       1.52        38.1       3.3    0.13 ± 0.00 0.95 ± 0.01 0.65 ± 0.04
                                                                                with Phragmites
Provinzialmoor P-MIX                     80           0–25          H5        Sphagnum peat                   52.0       1.09        47.7       3.5    0.16 ± 0.01 0.96 ± 0.01 0.59 ± 0.01 0.05 ± 0.05
                                                      25–65         H6        Eriophorum-Sphag-               56.4       0.86        65.5       3.0    0.10 ± 0.01 0.94 ± 0.03 0.67 ± 0.03
                                                                                num peat
                                                      65–80         H8        Sedge peat with                 56.6       1.77        31.9       3.0    0.15 ± 0.01 0.95 ± 0.02 0.71 ± 0.03
                                                                                Eriophorum
Provinzialmoor P-PAP,                    95           0–33          H5        Sphagnum peat                   51.9       0.98        52.8       3.1    0.12 ± 0.00 0.94 ± 0.03 0.51 ± 0.01 0.09 ± 0.15
                 P-PAL
                                                      33–80         H7        Sphagnum-Eriopho-               56.2       0.82        68.2       3.1    0.10 ± 0.00 0.97 ± 0.01 0.67 ± 0.05
                                                                                rum peat
                                                      80–95         H8        Sedge-wood peat                 58.2       1.50        38.8       3.4    0.13 ± 0.01 0.96 ± 0.01 0.72 ± 0.07

M-NAT Meerkolk reference site, M-HAR, Meerkolk harvested site, D-DITCH, Drenth ditch irrigation, D-DRIP, Drenth drip irrigation, P-MIX, Provinzialmoor Sphagnum plants from Meerkolk, P-PAP, Provinzialmoor Sphagnum
papillosum, P-PAL, Provinzialmoor Sphagnum palustre, SOC, soil organic carbon, Nt total Nitrogen, BD bulk density,  porosity, Ks saturated hydraulic conductivity measured with bail tests at water table depths of 0.05 to 0.30 m
(Grobe and others 2021), n.d. = not determined. BD, , field capacity and Ks are given as mean ± standard deviation of repeated measurements.
                                                                                                                                                                                                                                      Sphagnum farming on highly decomposed peat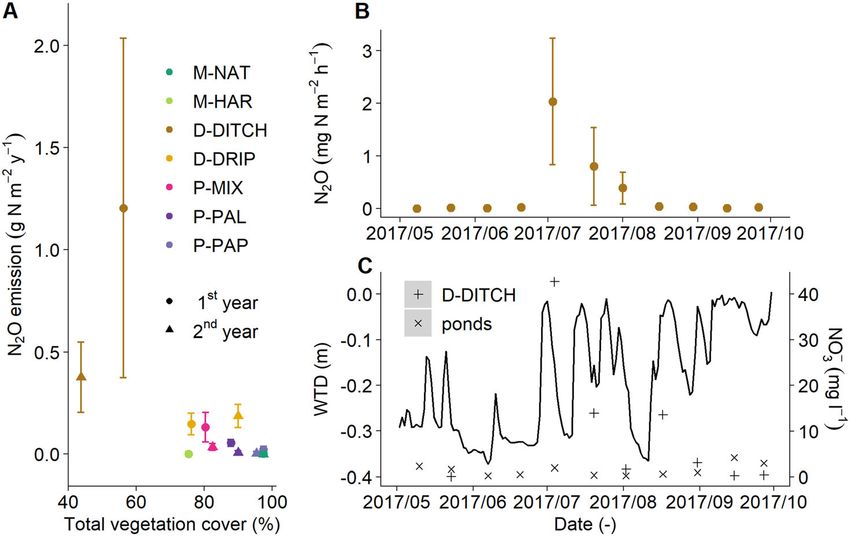
J. Oestmann and others

At sites M-NAT, D-DRIP and P-MIX, near-surface              Samples were filtered to 0.45 lm (PES, Merck
soil moistures were recorded using GS3 capacitance          Millipore, Tullagreen, Ireland), and concentrations
sensors (Decagon Devices Inc., Pullman, WA,                 of nitrate (NO3-), ammonium (NH4+), phosphate
USA). Volumetric water contents h (cm3 cm-3)                (PO43-), sulphate (SO42-) and calcium (Ca2+) were
were calculated from dielectric permittivities using        determined by ion chromatography (850 Profes-
the standard calibration of the device for potting          sional Ion Chromatograph, Metrohm, Filderstadt,
and peat soils. To exclude the impact of freezing on        Germany). Concentrations of dissolved organic
the dielectric permittivity, values at soil tempera-        carbon (DOC) were calculated as the difference
ture below 2 C were discarded. Measurements of h           between total carbon and total inorganic carbon
were transformed to water-filled pore space                 (DimaTOC 2000, Dimatec, Essen, Germany).
(WFPS) by dividing h with the maximum h of the
time series. Additionally, relative humidity was            Vegetation Characteristics
measured near the soil surface (IST AG, Ebnat-
                                                            Every spring and autumn, vegetation cover (mos-
Kappel, Switzerland).
                                                            ses and vascular plants) and species composition
   Monitoring wells (slotted PVC tubes) were in-
                                                            were classified according to the Londo scale (Londo
stalled in the peat at all plots. To avoid measure-
                                                            1976) at each measurement plot. In addition,
ments of deeper groundwater, they were installed
                                                            heights of Sphagnum lawns were recorded. The
in the peat layer only and thus fell periodically dry.
                                                            harvested biomass at the donor site (M-HAR) and
Water table depth (WTD) was measured using
                                                            the mowed vascular plants at the cultivation sites
Mini-Divers in combination with Baro-Divers for
                                                            were dried to determine biomass. Subsequently, C
atmospheric pressure correction (Eijkelkamp,
                                                            and N contents were determined by elemental
Giesbeek, the Netherlands). In the following, WTD
                                                            analysis (LECO Corporation, St. Joseph, Michigan,
below ground is noted with a negative sign and vice
                                                            USA).
versa.
                                                            Determination of Greenhouse Gas
Soil Properties
                                                            Balances
At all study sites, soil profiles were dug. If sites were
very close to each other, a profile was shared to           GHGs were measured using manual static cham-
minimize disturbance of the area (Table 1). From            bers (Livingston and Hutchinson 1995) at 8 sites
each horizon, samples for the determination of              (Fig. 1, Table 1). A ‘site’ represents a management/
physical (six steel rings with a volume of                  vegetation type in one of the three study areas
244.29 cm3 each) and chemical properties (grab              ‘Meerkolk’, ‘Provinzialmoor’ and ‘Drenth’ and
samples) were taken. The degree of humification             consists of three ‘plots’ as measurement replicates.
was determined according to von Post, and carbon            GHG measurements were taken for two years. The
(C) and nitrogen (N) contents were measured using           period from 16 March 2017 to 15 March 2018 will
an elemental analyser (LECO Corporation, St. Jo-            hereafter be referred to as 2017 and the period from
seph, Michigan, USA).                                       16 March 2018 to 15 March 2019 as 2018. We
   Bulk density (BD) and porosity () were deter-           follow the atmospheric sign convention and emis-
mined as part of evaporation experiments with               sions of GHG are specified as positive values.
standard mass calculations based on the sample                 All plots were accessible by boardwalks in order
weight at the beginning and end of the experiment.          to minimize soil disturbances. During measure-
Field capacity (h at pF 1.8-h at pF 4.2; pressure           ments, chambers were placed on permanently in-
heads h (cm) are expressed as pF = log10(h)) was            stalled PVC frames and were fixed gas-tightly via a
determined with soil hydraulic properties using the         rubber seal and clamps. Fans mixed the air inside
bimodal hydraulic function of van Genuchten                 the chambers in order to avoid concentration dif-
(1980) (Durner 1994) derived by evaporation                 ferences. An opening in the chamber wall, which
experiments using the ‘inverse method’ described            was closed with a rubber plug after placement,
in Dettmann and others (2019).                              prohibited possible pressure differences during the
                                                            placement of the chambers. Additionally, a vent
Water Quality                                               tube prevented differences in pressure between
                                                            inside and surrounding air. When necessary,
Biweekly, soil water samples were taken at each             transparent chambers were cooled with icepacks.
site and from the irrigation pond in Drenth and             At the irrigation polder (P-POLDER), buoyant
polders in Provinzialmoor. EC and pH values were            frames with a water-filled u-shape were deployed.
measured in situ (WTW, Weilheim, Germany).                  The frames were able to follow the WTD of the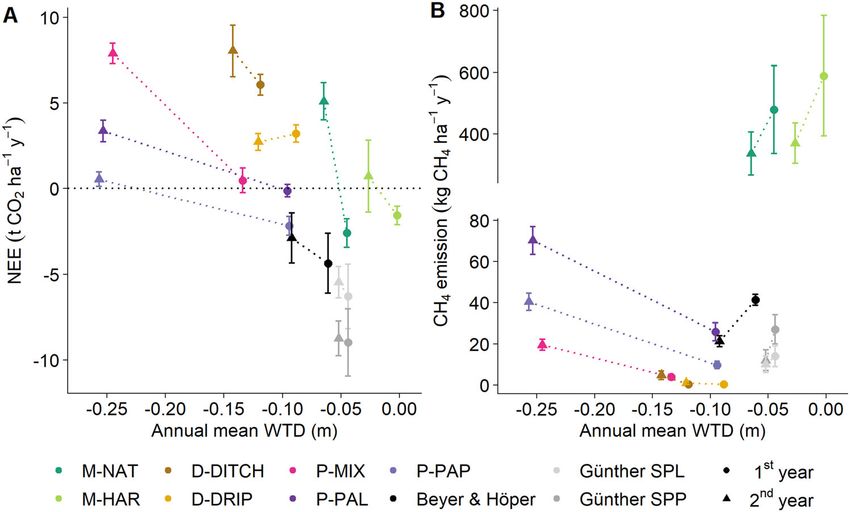
Sphagnum farming on highly decomposed peat

polder and held in position by thin steel poles.      ances (for example, Leiber-Sauheitl and others
Before measurements, they were fixed to the poles.    2014).
                                                        First, response functions relating Reco to soil
Carbon Dioxide                                        temperature were parameterized for each cam-
                                                      paign day using the temperature dependent
Measurement and Flux Calculation                      Arrhenius-type model of Lloyd and Taylor (1994):

Fluxes of CO2 were measured monthly in diurnal                                             1      1
                                                        Reco ðT Þ ¼ Rref  exp E0
campaigns using transparent and opaque chambers                                       Tref  T0 T  T0
(78 9 78 9 50 cm, transparent polycarbonate and                                                           ð1Þ
PVC) to determine the net ecosystem exchange
(NEE) and ecosystem respiration (Reco), respec-         where T is the measured soil temperature, Tref
tively.                                               the reference temperature of 283.15 K and T0 the
   Campaigns started with one set of Reco mea-        temperature constant for the start of biological
surements before sunrise, followed by one set of      processes (227.13 K) and Rref (respiration at the
NEE measurements at sunrise and then continued        reference temperature (mg CO2–C m-2 h-1)) and
in alternation until the maximum light intensity      E0 (an activation-like parameter (K)) are the esti-
was reached at noon and the maximum soil tem-         mated parameters. If the difference between mini-
perature was reached in the afternoon. If possible,   mum and maximum temperatures was smaller
measurements were taken on sunny days to cover        than 1.5 C during the campaign day, the median
the whole range of environmental parameters. A        of all Reco fluxes was used as Rref in Eq. 1.
minimum of four transparent and four opaque             Secondly, using these parameters and half-
fluxes was measured per plot and campaign day.        hourly data of soil temperature, annual time series
The CO2 concentration of the chamber air was          of Reco were interpolated for each site (Leiber-
measured with an infrared gas analyser (LI-820, LI-   Sauheitl and others 2014). For every time point,
COR, Lincoln, Nebraska, USA) during chamber           Reco was calculated as the distance weighted mean
closure times of 120 (NEE) and 180 (Reco) seconds.    of the two values derived by using the parameters
Additionally, air temperature and humidity (Ro-       of the previous and subsequent campaign.
tronic GmbH, Ettlingen, Germany) were recorded          Thirdly, gross primary production (GPP) was
and the CO2 concentrations were corrected for         calculated as the difference between measured NEE
water vapour concentrations (Webb and others          and the nearest modelled Reco flux. For each cam-
1980).                                                paign, the rectangular hyperbolic light response
   Fluxes were calculated using the linear regres-    equation based on the Michaelis–Menten (Johnson
sion of a moving window with the highest coeffi-      and Goody 2011) kinetics was parameterized (Falge
cient of determination (R2). The length of the        and others 2001):
moving window was adjusted according to the so-                             GPP2000  a  PAR
                                                      GPPðPARÞ ¼                           GPP2000
lar declination between 40 s at the longest day and                GPP2000 þ a  PAR  2000lmol m2 s1  PAR
50 s at the shortest day. This was necessary as
                                                                                                          ð2Þ
chamber air temperatures rapidly increased during
summer and low fluxes required longer moving          where PAR is the photon flux density of the pho-
windows during winter. Fluxes with R2 < 0.75          tosynthetic active radiation (lmol m-2 s-1) and
were excluded from further calculations unless the    GPP2000 (the rate of carbon fixation at a PAR value
increase or decrease of the CO2 concentration was     of 2000 (mg CO2-C m-2 h-1)) and a (the light use
smaller than 3% of the mean concentration. If the     efficiency (mg CO2-C m-2 h-1/lmol m-2 s-1), that
change of photosynthetic active radiation (PAR)       is, the initial slope of the fitted curve) are the
exceeded a threshold of 10% of the initial value      estimated parameters. The PAR data of the mea-
and/or the change of air temperature inside the       surement campaigns were corrected by a factor of
chamber was higher than 1.5 C, no flux was cal-      0.95 as the transparent chambers slightly reduce
culated.                                              light transmission (PS-Plastic, Eching, Germany). If
                                                      GPP parameters could not be fitted, the respective
Calculation of Annual Balances                        campaign was combined with the nearest campaign
To account for the seasonal development in vege-      which best resembled the campaign’s environ-
tation response to environmental conditions, we       mental conditions, that is, ranges of PAR and GPP.
used a campaign-based approach for annual bal-        This was especially the case at the polder site (P-
                                                      POLDER), where fluxes were low and variable and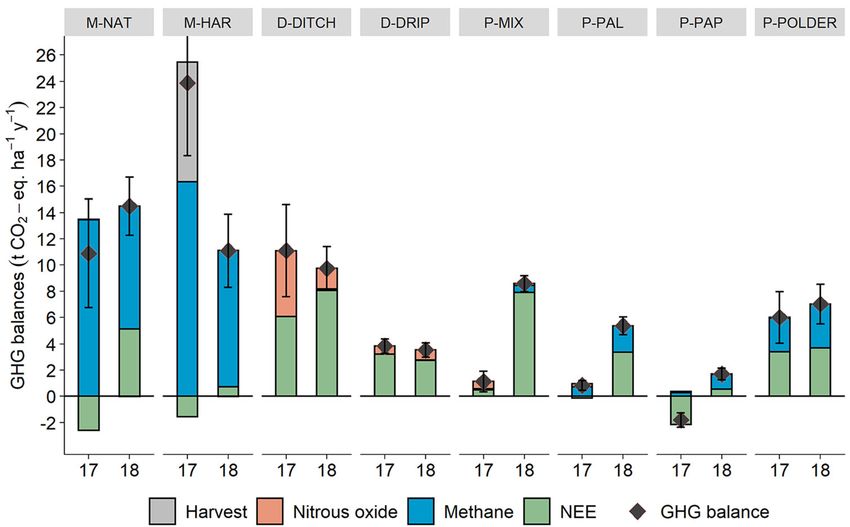
J. Oestmann and others

all campaigns were pooled. Annual time series of        flux was smaller than 30% of the maximum CO2
GPP were interpolated in analogy to Reco using the      flux of the other two replicates.
campaign parameters and half-hourly PAR data.
The effect of cutting vegetation on the GPP inter-      Calculation of Annual Balances
polation of the near-natural donor site (M-HAR)
                                                        Annual balances of CH4 and N2O and uncertainties
was accounted for by setting the GPP parameters to
                                                        were estimated using a combination of bootstrap
zero at this day. NEE values were obtained by
                                                        and jackknife procedures (Günther and others
summing up GPP and Reco.
                                                        2015). In brief, one of the three replicate flux
   Finally, annual balances and uncertainties of
                                                        estimates was randomly selected for each campaign
NEE were estimated by bootstrapping. The re-
                                                        day. This way, 2000 random time series were
sponse functions for Reco and GPP were fitted again
                                                        generated. Out of these data, balances were calcu-
using random resamples of the campaign fluxes
                                                        lated via linear interpolation, each time omitting
with replacement (number of bootstraps = 1000).
                                                        one campaign day. The reported annual estimates
From the bootstrapped fits, standard errors were
                                                        and uncertainties represent the means of all jack-
calculated.
                                                        knife balances and standard errors.
Methane and Nitrous Oxide
                                                        Site-specific and Areal Greenhouse Gas Balances
                                                        Methane and N2O entered the greenhouse gas
Measurement and Flux Calculation
                                                        balance of sites given their global warming poten-
Fluxes of CH4 and N2O were determined fort-             tials of 28 and 265 t CO2-eq. ha-1 y-1 over a
nightly using opaque chambers. Over a total clo-        timeframe of 100 years (Myhre and others 2013).
sure time of 80 min, five consecutive chamber air
gas samples were collected using semi-automatic               GHG-balance t CO2 -eq: ha1 y1
sampling devices directly after placing the chamber              ¼ NEE þ CExport þ 28 CH4 þ 265 N2 O ð3Þ
and every 20 min from then on. Concentrations of           Sphagnum donor material was harvested at M-
CO2, CH4 and N2O were measured in the labora-           HAR, and the cultivation sites were mowed. The
tory using a gas chromatograph (Shimadzu, Kyoto,        respective C exports (t CO2 ha-1 y-1) are part of the
Japan) equipped with an electron capture detector       GHG balance. The C import by Sphagnum fragments
(ECD) for analysing CO2 and N2O and a flame             and straw was not accounted for as the inoculation
ionization detector (FID) for analysing CH4.            took place before starting the measurements, and
   Fluxes were determined using robust linear or        no straw was present during the measurement
nonlinear Hutchinson–Mosier (HMR, Pedersen and          period anymore.
others 2010) regressions (R Core Team 2019; Fuß            In order to derive total areal balances of the three
and others 2020). Linear or nonlinear fits were         Sphagnum farming sites differing in their irrigation
selected according to the kappa.max criterion           system, emissions of the irrigation system, of dams
introduced by Hüppi and others (2018). In brief,       and of projected biomass harvest have to be in-
the robust linear regression was set as a default.      cluded. To do so, we used the following assump-
HMR was selected, if the kappa value, that is, the      tions:
nonlinear shape parameter, did not exceed                  Size of the irrigation polders: The contribution of
kappa.max (h-1), that is, the quotient of the linear    GHG emitted from the irrigation systems (polders
flux estimate and the minimal detectable flux           and ditches) was determined by sizing the respec-
multiplied by the closure time. This was the case for   tive areas using scans of an aerial drone and
28% of CH4 fluxes and 2% of N2O fluxes.                 assuming that the emission of irrigation ditches
   Decreases in CO2 concentration of more than          equals the measured emission of the P-POLDER
10 ppm compared to the previous measurement             site. The exact amount of irrigation water could not
were interpreted as a hint towards a leak of the        be determined in Provinzialmoor. Therefore, a
system or other shortcomings, and the respective        theoretical size of 3.8 ha of an irrigation polder
data points were discarded. If there were less than     needed to balance water deficits of the cultivation
four data points per measurement, no flux was           area was estimated based on the maximum irriga-
calculated. Fluxes indicating an uptake of CH4          tion amount determined in Drenth (500 mm in
higher than 0.5 mg m-2 h-1 (n = 6) were regarded        2018, Köbbing, personal communication) and a
as implausible and discarded (Günther and others       theoretical extractable water column of 0.30 m.
2015; Hütsch 2001). Finally, fluxes of both CH4 and
N2O were excluded (n = 54), if the respective CO2
Sphagnum farming on highly decomposed peat
Peat dams: Peat dams surrounding the cultivation were measured in 2017 and 2018. As this monitoring
sites were constructed out of the upper layer of well temporarily fell dry in June and July 2018,
onsite peat and will largely decompose to CO2. For the true mean of site D-DITCH might be slightly
D-DITCH, D-DRIP and Provinzialmoor, areas of the lower. At the drip irrigation site (D-DRIP), annual
surrounding peat dams of 0.17 ha, 0.17 ha and mean WTDs were - 0.09 ± 0.12 m and - 0.12 ±
0.31 ha were determined using scans of an aerial 0.12 m, in Provinzialmoor (mean of sites P-PAL, P-
drone. We assumed that emissions from peat dams PAP and P-MIX), - 0.11 ± 0.11 m and - 0.25 ±
correspond to peat extraction sites in North-Wes- 0.22 m. WTDs at all cultivation sites fluctuated
tern Germany (5.2 t CO2 ha-1 y-1, Tiemeyer and strongly and fell below - 0.30 m for 51 and 81 days
others 2020). in 2017 and 2018 at D-DITCH, for 39 and 42 days at
Re-distribution of Sphagnum fragments: We as- D-DRIP and for 31 and 135 days in Provinzialmoor.
sumed that all materials harvested at the donor site During summer 2018, WTDs in Provinzialmoor even
were spread on the cultivation sites. Therefore, the fell below - 0.60 m, while water management in
harvested biomass enters the site-specific GHG Drenth could be largely maintained.
balance of M-HAR, but not the areal GHG balances. While the incomplete data of 2017 already sug-
Biomass harvest: Over the course of this study, no gested a lower WFPS in Provinzialmoor, WFPS was
harvest of Sphagnum biomass was conducted. considerably higher in D-DRIP (83 ± 12%) than in
However, we determined biomass and height of P-MIX (66 ± 19%), but still lower than in M-NAT
mosses at the cultivation sites (Grobe and others (93 ± 4%) in 2018 (Fig. 2B). In 2018, WFPS ten-
2021). The linear regression (R2 = 0.43) between ded to be higher at same WTDs in D-DRIP com-
biomass and height of these data was used to derive pared to P-MIX. Humidity near the soil surface was
biomasses for each measurement site from the measured in 2018 only and was 79 ± 23% at M-
height of mosses in our plots. It was further as- NAT (mean ± standard deviation), 80 ± 21% at D-
sumed that 70% of this biomass could be harvested DRIP and 78 ± 22% at P-MIX.
and this estimated extractable biomass was divided
by the number of years since the establishment of Water Quality
respective sites and included in the areal GHG
Values of pH and EC as well as solute concentra-
balances (t CO2-eq. ha-1 y-1, Table 4). Areal GHG
tions were low at the near-natural and at the cul-
balances of the different irrigation systems were
tivation sites (Table 2). The irrigation water in
finally standardized per unit of estimated
Drenth showed high pH values and concentrations
extractable Sphagnum biomass (t DM ha-1 y-1,
of Ca2+, especially when ground water was added
Table 4).
in dry summer months. However, concentrations
of soil pore water at the plots were hardly affected.
RESULTS Maximum pH was 8.7 in the pond water and 5.7 at
the measurement plots, and the maximum con-
Hydro-meteorological Conditions
centrations of Ca2+ were 33.9 mg l-1 and
The early summer of 2017 was unusually dry but 15.9 mg l-1, respectively. At D-DITCH, a peak of
extensive rainfalls in the second half of the year NO3- concentrations (up to 42.6 mg l-1 in com-
resulted in an annual precipitation of 50 mm above parison with the overall mean of 4.1 mg l-1) was
the long-term average value of 791 mm in Lingen measured in the first summer.
(German Weather Service). However, in 2018,
only 561 mm was measured, which was the lowest Vegetation Development
value since 1960. With 10.9 C and 11.7 C, both
The harvested plots in the near-natural area
years were warmer than the long-term average of
recovered quickly (Fig. 3). In two of the replicate
9.8 C. 2018 was the second warmest year since
plots, plant cover and species composition resem-
recording began in 1951.
bled the reference plots already one year after
WTD at the near-natural reference site (M-NAT)
harvesting. However, at one replicate plot (M-
was close to the peat surface throughout both mea-
HAR.2), remaining mosses were drowned and died
surement years, with annual means of - 0.05 ±
off in the subsequent winter. At the cultivation
0.03 m (mean of daily averages ± standard devia-
sites, the Sphagnum cover increased during the
tion) in 2017 and - 0.07 ± 0.06 m in 2018
course of this study and spots of bare peat largely
(Fig. 2A). Even in summer 2018, WTD did not
closed. However, vegetation developed unequally
fall below - 0.16 m. At the ditch irrigation site
at the different irrigation treatments (Fig. 3). The
(D-DITCH), - 0.12 ± 0.13 m and - 0.14 ± 0.13 m
mean Sphagnum cover at the cultivation sites de-J. Oestmann and others
Figure 2. A Water table depths (WTD) of the near-natural site (M-NAT) and the different irrigation systems ditch
irrigation (D-DITCH), drip irrigation (D-DRIP) and a combination of ditch irrigation and previous re-wetting (PM, mean
and standard deviation of sites P-PAL, P-PAP and P-MIX); and B water-filled pore spaces (WFPS) of the upper centimetres
of M-NAT, D-DRIP and P-MIX. The vertical dashed line denotes the change from subsurface drain pipes to aboveground
drip irrigation at D-DRIP. In June and July 2018, WTD of site D-DITCH fell below detection limit and is therefore not
plotted.
creased during the dry summer 2018, but mosses summer 2018 resulted in an earlier GPP peak
slightly recovered until spring 2019. At site D- compared to 2017 (Fig. 4). At D-DITCH, GPP even
DITCH, mean Sphagnum cover decreased through- shrank to half during July and August before it
out the study period. The cover of vascular plants increased again in September. This decrease in GPP
was higher at P-PAL, P-PAP and P-MIX compared was considerably less pronounced at the near-nat-
to D-DITCH and D-DRIP. Plant species known to ural sites and at D-DRIP. CO2 emissions increased
play an important role in peatland CH4 exchange with decreasing WTDs at all sites with the excep-
also increased in abundance, especially the cover of tion of D-DRIP (Fig. 5A), as Reco increased in 2018
Eriophorum species increased from 2017 to 2018 at to a greater extent than the respective GPP values.
the cultivation sites. Rhynchospora alba cover in- However, mean WTD only explained changes in
creased in 2018 at the near-natural site and also NEE between years as in 2018, NEEs of P-MIX and
slightly at the cultivation sites. Molinia caerulea was D-DITCH were similar despite different annual
mainly observed at the near-natural sites and at P- mean WTDs and in 2017, similar mean WTDs re-
MIX and covers decreased in 2018. At P-PAP and P- sulted in different NEEs at the cultivation sites.
PAL, higher covers of Erica tetralix and Calluna
vulgaris were recorded which increased in 2018. Methane
Highest CH4 emissions were measured at the near-
Carbon Dioxide natural sites and decreased in 2018 (Fig. 5B,
NEE of the near-natural sites was negative (net Table 3). Harvested plots (M-HAR) emitted more
uptake) in 2017 and positive in 2018 (Table 3). Of CH4, about 20% in 2017 and 10% in 2018. From
the cultivation sites, highest CO2 emissions were the irrigation polder in Provinzialmoor (P-POLD-
determined at D-DITCH, followed by D-DRIP and ER), roughly a third of the amount of M-NAT, that
the sites in Provinzialmoor. P-PAP showed the is, 6.9 and 8.9 g CH4-C m-2 y-1, was released
highest GPP, in its size almost comparable to the (Table 3). At our and other Sphagnum farming sites
near-natural sites, and acted as a CO2 sink in 2017. (Beyer and Höper 2015; Günther and others 2017),
Lowest GPPs were measured at D-DITCH. Fluxes of low CH4 emissions were found. However, CH4
both Reco and GPP were higher at the Provinzial- emissions of the cultivation sites increased in 2018
moor sites compared to the Drenth sites. At the despite lower WTDs. This increase coincided with
cultivation sites, the extraordinary hot and dry an increase of Eriophorum cover (E. angustifoliumSphagnum farming on highly decomposed peat
and E. vaginatum, Fig. 6A). Campaign CH4 fluxes respectively, and is therefore not visible in Fig. 8
also correlated with daily mean soil temperatures but included in Table 4.
(Fig. 6B and C). In accordance with the different vegetation
development, the three irrigation systems produced
Nitrous Oxide distinct GHG balances. Mean site-specific GHG
balances were highest in D-DITCH, followed by D-
With the notable exception of D-DITCH, N2O
DRIP and Provinzialmoor (mean of sites P-PAL, P-
emissions were low at all sites (Table 3). In general,
PAP and P-MIX, Table 4). Including emissions of
high annual N2O emissions coincided with low
irrigation systems and dams, drip irrigation (D-
vegetation covers (Fig. 7A). The high emissions of
DRIP) generated the smallest areal GHG balance,
D-DITCH could mainly be attributed to a short-
whereas irrigation by ditches combined with pre-
term peak in summer 2017 and coincided with a
vious re-wetting (Provinzialmoor) produced the
rising WTD after a dry period and high concentra-
lowest GHG emissions per ton of Sphagnum bio-
tions of NO3- in the soil water (Fig. 7B and C). The
mass.
NO3- did not seem to originate from the irrigation
water, as no elevated concentrations were mea-
sured in the irrigation ponds. DISCUSSION
Sphagnum Farming on Highly
Site-specific and Areal Greenhouse Gas
Decomposed Peat
Balances
In this study, we provide evidence for the general
The GHG balances of the near-natural sites (M-
feasibility of large-scale Sphagnum farming on
NAT, M-HAR) were characterized by high CH4
highly decomposed peat remaining after peat
emissions, but M-NAT was still accumulating C in
extraction. Further, results are not only relevant for
2017 (Table 3). At M-HAR, the amount of har-
post-extraction sites, as agriculturally used bog
vested biomass equals an export of 9.1 t CO2-
peats may have also already lost the upper horizons
eq. ha-1 y-1. In contrast, NEE dominated the GHG
due to mineralization and share similar physical
balances of the cultivation sites. The only net GHG
soil characteristics. In Germany, this applies to
uptake was calculated for site P-PAP in 2017. High
more than half of the total bog area.
CO2 and N2O emissions contributed to the balance
However, the highly decomposed peat challenges
of D-DITCH. The GHG balance of the irrigation
a successful cultivation of peat mosses. Measured
polder in Provinzialmoor (P-POLDER) was com-
Ks values were small compared to the 1.13 m d-1
posed of CH4 and CO2 emissions, the mean of both
reported for a nearby Sphagnum farming project on
years was 6.5 t CO2-eq. ha-1 y-1. The C-export
less decomposed peat (Brust and others 2018), and
generated by mowing of vascular plants at the
BD was slightly higher compared to the range of
cultivation sites added up to only 0.13 and 0.05 t
0.07–0.12 g cm3 reported for another nearby site
CO2-eq. ha-1 y-1 for Provinzialmoor and Drenth,
(Gaudig and others 2017). Over prolonged periods,
WTDs at the cultivation sites fell far below the
Table 2. Values of pH and Electric Conductivity (EC) as well as Solute (DOC = dissolved organic carbon,
NO3- = nitrate, NH4+ = ammonium, PO43- = phosphate, SO42- = sulphate, Ca2+ = calcium)
-1
Concentrations (mg l ) of Irrigation Water and of Soil Water at the Measurement Sites (means of
biweekly sampling campaigns ± standard deviation)
Meerkolk Drenth Drenth Drenth Provinzialmoor Provinzialmoor
Mean of sites Irrigation ponds D-DITCH D-DRIP Irrigation polder Mean of sites
pH 4.6 ± 0.4 5.5 ± 1.3 4.4 ± 0.4 4.3 ± 0.3 4.2 ± 0.3 4.4 ± 0.3
EC 54 ± 16 152 ± 59 159 ± 53 121 ± 23 93 ± 30 117 ± 30
DOC 31 ± 13 51 ± 20 68 ± 20 70 ± 22 43 ± 19 59 ± 26
NO3- 0.1 ± 0.1 4.0 ± 4.3 4.1 ± 8.4 0.4 ± 0.4 0.3 ± 0.2 0.3 ± 1.0
NH4+ 0.5 ± 0.3 0.8 ± 0.7 5.2 ± 2.0 1.4 ± 1.2 0.8 ± 0.7 1.9 ± 1.3
PO43- 0.02 ± 0.05 0.07 ± 0.12 0.01 ± 0.02 0.06 ± 0.09 0.02 ± 0.06 0.07 ± 0.19
SO42- 0.6 ± 0.3 11.4 ± 0.4 7.4 ± 3.9 4.9 ± 3.0 1.3 ± 0.7 3.8 ± 3.0
Ca2+ 0.5 ± 0.6 9.7 ± 8.9 2.3 ± 3.4 2.6 ± 3.0 0.6 ± 1.7 1.3 ± 2.1J. Oestmann and others Figure 3. Covers of peat mosses and vascular plants (mean and standard deviations of replicate plots) at the near-natural sites (M-NAT and M-HAR) and at the cultivation sites. One harvested plot (M-HAR.2) did not recover and covers of total vegetation and Sphagnum could not be determined in March 2019. Eriophorum cover is the sum of E. angustifolium and E. vaginatum covers, though E. angustifolium covers were dominant. The dashed vertical line denotes the date of harvest at M- HAR. targeted range close to the surface. Price and comparable to a neighbouring Sphagnum farming Whitehead (2001) observed Sphagnum recoloniza- project (1.0 t ha-1 y-1 in the first 3 years, Gaudig tion of an abandoned block-cut bog at mean WTD and others 2017). In a greenhouse experiment, of - 0.25 ± 0.14 m and volumetric water con- Gaudig and others (2020) found that peat moss tents higher than 50%. WTDs measured at our productivities can reach up to 7 t ha-1 y-1 for S. cultivation sites were higher, but WFPS temporar- papillosum at a constant WTD 0.02 m below capit- ily dropped below 50% (corresponding to volu- ulum. metric water contents lower than 50%) in 2018, Vascular plants also colonized the cultivation especially at P-MIX. During these periods of sites and higher Sphagnum covers coincided with hydrological stress, mosses lost their green colour higher covers of vascular plants (Grobe and others and became visibly inactive. 2021). This supports the findings of McNeil and Although mosses recovered and covers increased Waddington (2003), who observed that vascular again in early 2019, the 2018 drought affected plants promote Sphagnum growth by providing biomass production. The estimated Sphagnum bio- shadow and suitable moistures, a mechanism mass in March 2019 was 1.2 t dry mass per hectare especially useful during hydrological stress (Buttler at D-DITCH (41 months since inoculation), 2.1 t at and others 1998) and after cutting of mosses (Krebs D-DRIP (41 months), 3.3 t at P-PAP (41 months) and others 2018). Vascular plants generally profited and 2.5 t at P-PAL (36 months) and P-MIX from the dry conditions in 2018 and shaded peat (29 months). A detailed analysis of Sphagnum mosses remained active longer at the beginning of establishment at our sites is available in Grobe and dry periods compared to spots without shading. others (2021), while our data are restricted to the GHG plots only. Biomass production in Drenth was low, but values of the sites in Provinzialmoor are
Table 3.        GHG Balances of Sites
Site               Year       WTD                      NEE                   GPP                   Reco              CH4-C                N2O-N                C-Export             C balance             GHG balance
                              (m)                      (t C ha-1             (t C ha-1             (t C ha-1         (g C m-2             (g N m-2             (t ha-1 y-1)         (t ha-1 y-1)          (t CO2-eq ha-1
                                                       y-1)                  y-1)                  y-1)              y-1)                 y-1)                                                            y-1)

M-NAT              2017        - 0.04 ±      0.03       - 0.7    ±   0.2      -   6.7   ±   0.2    5.9   ±   0.3     36.1   ±   10.8      0.00   ±   0.01                            - 0.3    ±   0.3       10.9    ±   4.1
M-NAT              2018        - 0.06 ±      0.06         1.4    ±   0.3      -   7.2   ±   0.2    8.6   ±   0.4     25.1   ±   5.2       0.00   ±   0.01                              1.6    ±   0.3       14.5    ±   2.2
M-HAR              2017          0.00 ±      0.03       - 0.4    ±   0.2      -   4.9   ±   0.1    4.5   ±   0.1     43.8   ±   14.6      0.00   ±   0.01      2.48 ± 0.28             2.5    ±   0.4       23.9    ±   5.6
M-HAR              2018        - 0.03 ±      0.07         0.2    ±   0.6      -   6.3   ±   0.3    6.5   ±   0.5     27.8   ±   5.0       0.00   ±   0.01                              0.5    ±   0.6       11.1    ±   2.8
D-DITCH            2017        - 0.12 ±      0.13         1.7    ±   0.2      -   3.0   ±   0.1    4.7   ±   0.2      0.0   ±   0.0       1.20   ±   0.83                              1.7    ±   0.2       11.1    ±   3.5
D-DITCH            2018        - 0.14 ±      0.13         2.2    ±   0.4      -   3.5   ±   0.2    5.7   ±   0.4      0.4   ±   0.2       0.38   ±   0.17                              2.2    ±   0.4        9.7    ±   1.7
D-DRIP             2017        - 0.09 ±      0.12         0.9    ±   0.1      -   3.2   ±   0.1    4.1   ±   0.1      0.0   ±   0.1       0.15   ±   0.05                              0.9    ±   0.1        3.8    ±   0.6
D-DRIP             2018        - 0.12 ±      0.12         0.7    ±   0.1      -   4.2   ±   0.1    4.9   ±   0.1      0.1   ±   0.1       0.19   ±   0.06                              0.7    ±   0.1        3.5    ±   0.5
P-PAL              2017        - 0.10 ±      0.11       - 0.0    ±   0.1      -   4.1   ±   0.1    4.1   ±   0.1      1.9   ±   0.3       0.05   ±   0.02      0.02   ±   0.01         0.0    ±   0.1        0.8    ±   0.4
P-PAL              2018        - 0.25 ±      0.24         0.9    ±   0.2      -   5.7   ±   0.2    6.6   ±   0.1      5.3   ±   0.5       0.01   ±   0.01      0.06   ±   0.02         1.0    ±   0.2        5.4    ±   0.7
P-PAP              2017        - 0.09 ±      0.12       - 0.6    ±   0.2      -   5.8   ±   0.1    5.2   ±   0.1      0.7   ±   0.1       0.02   ±   0.02      0.03   ±   0.01       - 0.6    ±   0.2      - 1.8    ±   0.6
P-PAP              2018        - 0.26 ±      0.23         0.1    ±   0.1      -   7.2   ±   0.1    7.2   ±   0.1      3.0   ±   0.3       0.00   ±   0.01      0.03   ±   0.02         0.2    ±   0.1        1.7    ±   0.4
P-MIX              2017        - 0.13 ±      0.10         0.1    ±   0.2      -   4.7   ±   0.2    4.8   ±   0.1      0.3   ±   0.1       0.13   ±   0.07      0.04   ±   0.02         0.2    ±   0.2        1.1    ±   0.8
P-MIX              2018        - 0.25 ±      0.21         2.2    ±   0.2      -   5.6   ±   0.2    7.7   ±   0.1      1.5   ±   0.2       0.03   ±   0.02      0.04   ±   0.01         2.2    ±   0.2        8.6    ±   0.6
P-POLDER           2017          0.25 ±      0.16         0.9    ±   0.1      -   1.6   ±   0.1    2.5   ±   0.1      6.9   ±   5.2       0.01   ±   0.01                              1.0    ±   0.1        6.0    ±   2.0
P-POLDER           2018          0.13 ±      0.25         1.0    ±   0.1      -   1.6   ±   0.1    2.6   ±   0.1      8.9   ±   4.0       0.00   ±   0.01                              1.1    ±   0.1        7.0    ±   1.5

Water table depths (WTD) are means and standard deviation of daily means. Net ecosystem exchange (NEE), gross primary production (GPP) and ecosystem respiration (Reco) are means and standard errors of bootstrap fits, methane
(CH4-C) and nitrous oxide (N2O-N) are means and standard errors of bootstrap and jackknife balances. C-Export is the Sphagnum donor material at M-HAR and the mowed vascular plants at the cultivation sites. In Drenth, C-Export
could not be split into D-DITCH and D-DRIP, the combined export was 0.01 t C ha-1 y-1.
                                                                                                                                                                                                                                    Sphagnum farming on highly decomposed peat
J. Oestmann and others
Figure 4. Daily values of gross primary production (GPP) in 2017 and 2018 at the near-natural site (M-NAT) and at the
cultivation sites (D-DITCH = ditch irrigation, D-DRIP = drip irrigation, P-PAP (exemplary for Provinzialmoor) = ditch
irrigation combined with previous re-wetting).
Figure 5. A Net ecosystem exchange (NEE) and annual mean water table depths (WTD); and B methane (CH4) emission
and WTD. First and second years are 2017 and 2018 at our sites, 2010 and 2011 (that is, 6 and 7 years after establishment)
in Beyer and Höper (2015) and 2012 and 2013 (that is, first and second years after establishment) in Günther and others
(2017; SPL = Sphagnum palustre, SPP = Sphagnum papillosum). Dotted lines combine both measurement years of each site.
Drivers of GHG Exchange comparable to other near-natural bogs (- 2.4 ±
1.2 t CO2 ha-1 y-1, Helfter and others 2015) to a
Carbon Dioxide (CO2)
considerable source in 2018. The effect of the dry
WTD affected the CO2 exchange of all sites. At the year 2018 on mean WTDs and the accompanying
near-natural site, differences in WTD of only a few increased CO2 emissions were particularly pro-
centimetres shifted M-NAT from a sink of CO2 nounced in Provinzialmoor. Fluctuations of WTDsSphagnum farming on highly decomposed peat
were consistent with the poor vegetation develop-
ment, while the decrease of NEE at D-DRIP in 2018
could be explained by an increase in vegetation
cover. At sites P-PAP and P-PAL, the restoration of
the sites as sinks of atmospheric CO2 in 2017 can be
attributed to the almost completely closed Sphag-
num lawn. Site P-PAP also showed the highest
vascular plant cover of all cultivation sites. In
general, higher vascular plant covers went along
with increased GPP and Reco fluxes.
In line with peatlands restored with the moss
layer transfer technique (Nugent and others 2018),
the time needed for a Sphagnum farming site to
become a sink of atmospheric CO2 cannot easily be
predicted. Comparing our results to previous
neighbouring Sphagnum farming experiments (Be-
yer and Höper 2015; Günther and others 2017)
showed no clear correlation of NEE and GPP with
the age of sites, and differences in CO2 exchange
are probably rather explained by the high and
stable WTD in those two studies (Fig. 5A). In
addition, dry years can also turn older restored sites
into sources of CO2 (Strack and others 2009; Wil-
son and others 2016b). Both GPP and Reco values
increased from 2017 to 2018. GPP was influenced
by growing vegetation covers, while lower WTDs
and higher temperatures affected Reco. A higher
biomass probably also contributed to the higher
Reco, but still the increase in Reco was more than
offsetting GPP increases. Possibly, the growing
vegetation would have turned the cultivation areas
in sinks of atmospheric CO2 in 2018 under the
condition of sufficient water supply. The develop-
Figure 6. A Methane (CH4) emissions and covers of
ment of daily GPP values indicates that GPP was
Eriophorum (E. angustifolium and E. vaginatum) at the end
strongly affected by the 2018 drought, above all at
of measurement years; B campaign CH4 fluxes (mg CH4-
C m-2 h-1) and the respective daily mean soil D-DITCH (Fig. 4).
temperatures and water table depths (WTD) at the
cultivation sites and C at the near-natural sites. Methane (CH4)
The CH4 emissions of the near-natural site were
high compared to the emission factors for re-wetted
will affect NEEs of Sphagnum farming sites, espe- and near-natural bogs (Wilson and others 2016a)
cially when mosses are exposed to periodical des- or temperate wetlands (Turetsky and others 2014).
iccation. In a laboratory experiment, McNeil and In addition to the shallow WTD, reasons could be
Waddington (2003) found that respiration of peat relatively high temperatures compared to both
columns grown with Sphagnum increased shortly long-term average and other studies summarized
after drying and subsequent re-wetting, while GPP by those reviews, the cover of vascular plants or the
recovered only after three weeks of water satura- high N deposition level (about 25 kg N ha-1 y-1,
tion, highlighting the importance of stable WTDs. Hurkuck and others 2016). Meerkolk is surrounded
Brown and others (2017) also found that water by intensively used agricultural area, which might
table fluctuation best predicted NEE and that a influence GHG exchange. In a fertilization experi-
stable WTD lead to greater uptake of CO2. ment, Juutinen and others (2018) could associate
In addition to the hydrology of the sites, the increasing CH4 fluxes with higher N input in a
development of the vegetation cover influenced temperate bog. Compared to semi-natural sites in a
NEE. Lower GPP values at D-DRIP and D-DITCH similar climatic setting, our values are notJ. Oestmann and others Figure 7. A Annual nitrous oxide (N2O) emissions (mean of jackknife balances ± standard error) and total vegetation covers; B campaigns with peak N2O fluxes at site D-DITCH (mean of replicates ± standard deviation); and C the respective water table depths (WTD) and nitrate (NO3-) concentrations of the irrigation ponds (ponds) and of the soil water at the measurement plots (D-DITCH) Figure 8. Annual exchange of nitrous oxide, methane and carbon dioxide (NEE) and site-specific GHG balances of the near-natural sites (M-NAT = reference, M-HAR = harvest of Sphagnum donor material), of the cultivation sites (D- DITCH = ditch irrigation, D-DRIP = drip irrigation, P-MIX, P-PAL and P-PAP = ditch irrigation combined with previous re- wetting) and of the irrigation polder in Provinzialmoor (P-POLDER). implausible: Drösler (2005) measured 38 g CH4-C dominated by Sphagnum fallax in North-Western m2 y-1 in a semi-natural peatland in Bavaria Germany (Tiemeyer and others 2020). dominated by Sphagnum cuspidatum, Scheuchzeria In general, campaign CH4 fluxes increased with palustris and Rhynchospora alba, whereas 5–14 g increasing daily mean soil temperatures and high- CH4-C m2 y-1 were reported for a near-natural bog est fluxes were measured at WTDs close to the peat
Sphagnum farming on highly decomposed peat

Table 4. Areal GHG Balances of Irrigation Systems (D-DITCH = ditch irrigation, D-DRIP = drip irrigation,
Provinzialmoor = ditch irrigation combined with previous re-wetting, that is, mean of sites P-PAL, P-PAP and
P-MIX) and Product-related GHG Balances per Ton of Extractable Sphagnum Biomass
Drenth   Drenth  Provinzialmoor
 D-DITCH  D-DRIP

10.4         3.7        2.6             Mean site-specific GHG balance of cultivation sites (t CO2-eq. ha-1 y-1)
6.5          6.5        6.5             GHG balance of polders and ditches (t CO2-eq. ha-1 y-1) (site P-POLDER)
5.2          5.2        5.2             GHG balance of dams (t CO2-eq. ha-1 y-1) (Tiemeyer and others 2020)
5:1          10:1       0.6:1           Ratio cultivation area/irrigation area
2.2:1        2.4:1      7.4:1           Ratio cultivation area/dams
0.05         0.05       0.13            Extracted biomass (mowing) (t CO2-eq. ha-1 y-1)
0.5          0.9        1.4             Estimated extractable biomass (vascular plants + Sphagnum) (t CO2-eq. ha-1
                                          y-1)
8.9          5.3        6.6             Areal GHG balance of irrigation system (t CO2-eq. ha-1 y-1)
0.3          0.4        0.7             Estimated extractable Sphagnum biomass (t DM ha-1 y-1)
29.5         13.2       9.4             GHG balance per extractable ton of Sphagnum biomass (t CO2-eq. t DM-1)

surface. However, high emissions were observed at          Nitrous oxide (N2O)
the cultivation sites during drought in 2018, which
                                                           N2O emissions were mainly relevant for the GHG
could be attributed to the vegetation composition
                                                           balances of the ditch irrigation site (Fig. 7A). An-
of the plots. Specialized wetland plants possessing
                                                           nual balances at this site were comparable to those
aerenchymous tissues enable a plant-mediated
                                                           of arable land (Tiemeyer and others 2020), and
transport of gases between soil and atmosphere
                                                           even the N2O emissions of D-DRIP are comparable
(Gray and others 2013). At the cultivation sites,
                                                           to low-intensity grassland on bog peat (Leiber-
increasing covers of Eriophorum angustifolium and
                                                           Sauheitl and others 2014). Emission peaks at D-
Eriophorum vaginatum from 2017 to 2018 resulted
                                                           DITCH (Fig. 7B) coincided with a re-rise of WTD
in higher CH4 emissions (Fig. 6A) despite drier
                                                           after a dry period and high concentrations of nitrate
conditions, a pattern already described in previous
                                                           in the soil pore water (Fig. 7C). The respective
studies (Greenup and others 2000; Tuittilla and
                                                           NO3- concentrations of the irrigation ponds were
others 2000; Waddington and Day 2007). Molinia
                                                           not elevated, hinting towards an origin of N in peat
caerulea (Leroy and others 2019; Vanselow-Algan
                                                           mineralization during the preceding dry period.
and others 2015; Rigney and others 2018) and
                                                           With a rising WTD, NO3- was probably converted
Juncus effusus (Henneberg and others 2015) have
                                                           to N2O by incomplete denitrification. Unfortu-
also been associated with higher CH4 emissions, but
                                                           nately, it is possible that this peak emission was
their influence seemed to be less important at our
                                                           missed in 2018: A similar re-rise of WTD combined
sites.
                                                           with higher concentrations of NO3- in the soil pore
   The CH4 emissions of P-POLDER were higher
                                                           water was observed in August 2018, but the
than emissions of the cultivation sites but signifi-
                                                           respective CH4/N2O campaign could not be con-
cantly smaller compared to the near-natural sites
                                                           ducted. A lack of vegetation which could take up N
(Table 3). They were comparable to emissions of
                                                           from the soil water also seems to contribute to the
irrigation ditches at a nearby Sphagnum cultivation
                                                           observed pattern. High N2O emissions from bare
site (4–11 g CH4-C m2 y-1, Günther and others
                                                           peat were also reported by other studies (Mar-
2017). In contrast, Franz and others (2016) re-
                                                           ushchak and others 2011), emphasizing the risk of
ported 40 g CH4-C m2 y-1 for a re-wetted rich fen.
                                                           high N2O emission under suboptimum plant
As in other chamber studies (for example, Günther
                                                           growth conditions even at unfertilized sites.
and others 2017), we could not determine episodic
ebullition fluxes, which might have played a role
                                                           Greenhouse Gas Balances
especially at P-POLDER. Therefore, CH4 fluxes
estimated here probably represent a lower limit of         Altogether, the GHG emissions were higher than
the ‘real fluxes’.                                         those of Sphagnum farming on less degraded peat
                                                           soils (Beyer and Höper 2015; Günther and others
                                                           2017) mainly because of more unfavourable CO2
You can also read