The potential fisheries Eastern for reservoir and aquaculture Province, in Zambia
←
→
Page content transcription
If your browser does not render page correctly, please read the page content below
Centre for Rural Development (SLE) Berlin

SLE DISCUSSION PAPER 01/2019 - EN

The potential for reservoir
fisheries and aquaculture in
Eastern Province, Zambia

Mara Gellner, Jonas W. Ng'ambi, Stefan Holler, Alexander M. Kaminski

                                            ADV\SoR.Y
                                             �E,�\J\C6S

                                              0
March 2019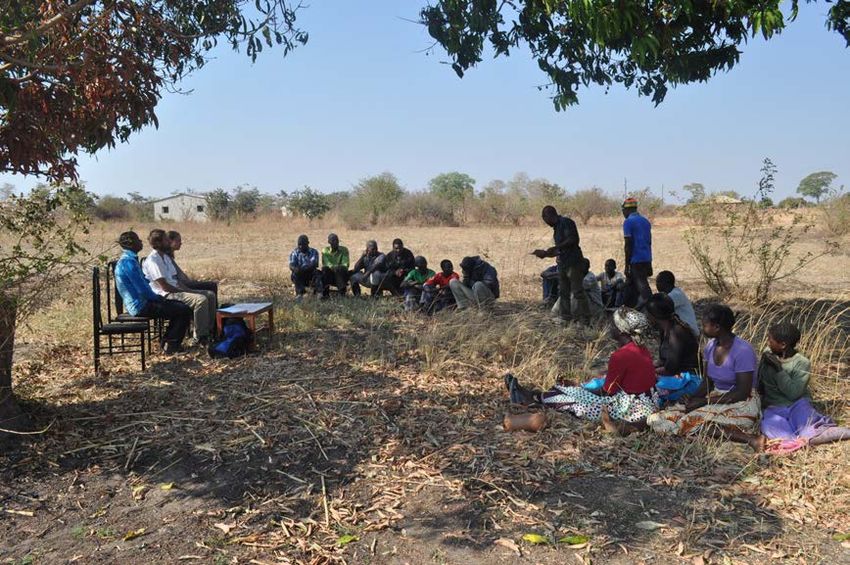
SLE Discussion Paper 01/2019

The potential for reservoir fisheries and
aquaculture in Eastern Province, Zambia

Mara Gellner, Jonas W. Ng’ambi, Stefan Holler, Alexander M. Kaminski

March 2019
Supported and funded by:
SLE Discussion Paper 01/2019

Published by: Centre for Rural Development (SLE)

Humboldt-Universität zu Berlin
Lebenswissenschaftliche Fakultät
Albrecht Daniel Thaer-Institut für Agrar- und Gartenbauwissenschaften
Seminar für Ländliche Entwicklung (SLE)
Hessische Str. 1-2
10115 Berlin
Telephone: 030-2093-46890
Fax: 030-2093-46891

E-mail: sle@agrar.hu-berlin.de
Website: www.sle-berlin.de

Printing
Druckerei der Humboldt-Universität zu Berlin
Dorotheenstraße 26
10117 Berlin

Distribution
Seminar für Ländliche Entwicklung (SLE)
Hessische Str. 1-2
10115 Berlin

Copyright
SLE 2019

ISSN: 1433-4585
ISBN: 978-3-947621-09-5

                                                                        SLE Discussion Paper 01/2019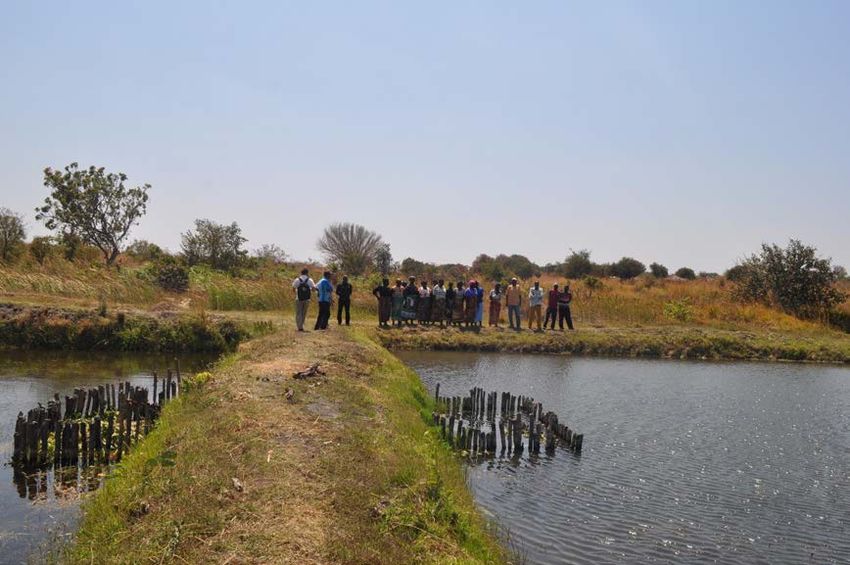
The SLE Discussion Paper Series facilitates the rapid dissemination of preliminary results drawn from
current SLE projects. The idea is to stimulate discussions in the scientific community and among those in
the field, and to inform policy-makers and the interested public about SLE and its work.
The Centre for Rural Development (SLE) is affiliated to the Albrecht Daniel Thaer Institute for Agricultural
and Horticultural Sciences in the Faculty of Life Sciences at the Humboldt-Universität zu Berlin. Its work
focuses on four strands: international cooperation for sustainable development as a post-master degree
course, training courses for international specialists in the field of international cooperation, applied
research, and consultancy services for universities and organisations.

The views and opinions expressed in this Discussion Paper are those of the authors and do not necessarily
reflect the official position of the GIZ.

Mara Gellner, Research Fellow
E-Mail: maragellner@web.de

Jonas W. Ng’ambi, Associated Senior Research Fellow
E-Mail: wizawane@yahoo.com

Stefan Holler, Associated Senior Research Fellow
E-Mail: stefanholler@hotmail.com

Alexander M. Kaminski, Senior Research Fellow
E-Mail: olekaminski@gmail.com

SLE Discussion Paper 01/2019
Acknowledgements i

Acknowledgements
We are extremely grateful for the support and funding for our study given by the “Deutsche Gesellschaft
für Internationale Zusammenarbeit (GIZ) GmbH”. Many thanks to Moritz Heldmann and Ricarda
Schwarz for enabling the field trip to take place. Special thanks as well to Jens Kahle for providing the
questionnaires and professional advice. Sincere thanks to the Department of Fisheries officers, namely
Ms. Mulenga, Mr. Chitambala, Mr. Kawaga, Mr. Hambalangwe, Ms. Simukoko and Mr. Kabeke, for their
cooperation and great support in the field.

                                                                             SLE Discussion Paper 01/2019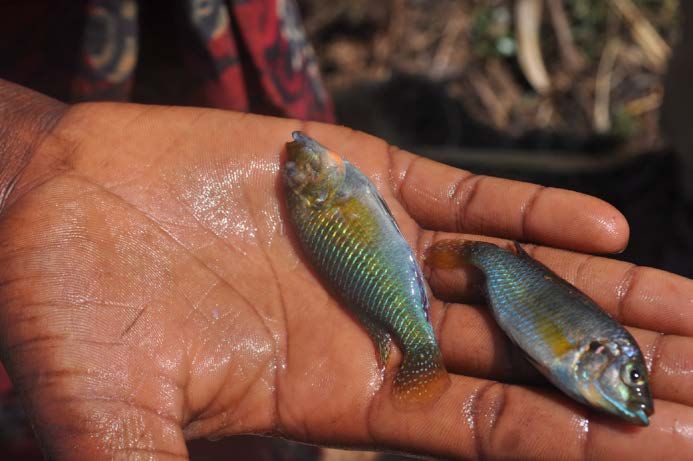
ii Abstract

Abstract
     This report provides the background, methodology and findings of a scoping study on dam-based
fisheries and small-scale fish farming and consumption in the Eastern Province of Zambia. The aim of the
study was to increase understanding of the current situation and the potential for improving sustainable
fisheries and aquaculture for greater food and nutrition security. This report focuses mostly on dam-
based fisheries (capture and culture) and small-scale fish farming in six districts in the province: Chipata,
Petauke, Lundazi, Katete, Sinda and Mambwe. The focus was on understanding of the current
aquaculture and fisheries landscape and on the potential development pathways of increasing fish
production, including for improved incomes and food and nutrition security. A focus on fish trading and
consumption was therefore a key priority. Information was collected through key informant interviews
with stakeholders and semi-structured interviews with fish farmers, fish traders and consumers. Focus
group discussions with fish farmer cooperatives and dam management committees complemented the
database. Fish production has high potential in the Eastern Province due to several reasons: there are
many small water bodies (SWB) in the region and currently fish farming is entirely in the hands of small-
scale farmers due to the absence of commercial aquaculture actors. Fish is an important source of food:
small-scale producers consume the fish they produce in their family or market the fish within their own
village locally. The report concludes with recommendations for development actors who are keen to
engage in fish production in the province.

Keywords
Dam-based fisheries, aquaculture, small-scale farmers, food and nutrition security, Zambia

SLE Discussion Paper 01/2019
Executive summary iii

Executive summary
     The Seminar für Ländliche Entwicklung (SLE – Centre for Rural Development) of the Humboldt-
Universitaet zu Berlin in Germany embarked on a research project entitled “Opportunities and challenges
for small-scale fish farmers in Zambia” from August to October 2018. The project was commissioned by
the Advisory Service on Agricultural Research for Development (BEAF), a unit within the Deutsche
Gesellschaft für Internationale Zusammenarbeit (GIZ) GmbH. The aim of the research was to assess the
role of fish farming within the livelihoods of smallholder fish farmers in Zambia. The main report
generated by this research primarily focuses on the Northern, Lusaka and Southern Provinces of Zambia,
however there was interest from the GIZ “ONE WORLD - No Hunger” (SEWOH) programme operating in
Zambia in assessing the potential of small-scale fish farming and fisheries in Eastern Province as well.
The present report is therefore an additional, complementary study to the main research and focuses on
the potential of fish production in Eastern Province, Zambia. The major findings were as follows:

   •    Fish production is scarce in the province due to there being relatively few perennial natural water
        sources compared to other parts of Zambia. The province is partly located in the Luangwa valley,
        where temperatures are higher and rainfall lower than other regions in Zambia.
   •    Aquaculture is not a large part of agricultural and economic activities in Eastern Province in
        Zambia, and the province has some of the lowest numbers of registered fish farmers in the
        country.

   •    Fish consumption seems to be generally quite low in the province as compared to other areas,
        mainly due to a lack of large capture fisheries and aquaculture, although there is a major fish
        trade corridor between Zambia and Malawi going through Chipata where fish from Lake Malawi
        is available. The most commonly consumed fish species are tilapia (63.5 %), followed by kapenta
        (various freshwater sardine species) (23.1 %).
   •    Fish farming is a secondary activity that produces fish mostly for home consumption. Most of the
        farmers cultivate agricultural crops and are involved in livestock rearing as their main source of
        income.
    •   There are five government aquaculture stations in the area (Chipata, Lundazi, Katete, Nyanje
        and Chadiza), which are intended to be aquaculture demonstration and research centres and
        sources of fingerlings. Chipata operates as the central hatchery providing broodstock to Lundazi,
        Katete, Nyanje and Chadiza fish farms, which are more closely located to rural farmers. Three
        stations (Lundazi, Katete, Chadiza) have completely ceased production of fingerlings, and the
        remaining two active ones are only partly functional, mainly due to limited funding over a
        number of years. Government aquaculture facilities in the province are in need of urgent
        rehabilitation.

    •   The greatest potential for aquaculture in Eastern Province lies in the numerous small water
        bodies (SWBs) that operate as small irrigation dams. These SWBs have a vast capacity for cage

                                                                              SLE Discussion Paper 01/2019
iv Executive summary
or pen culture of fish. In some instances these SWBs act as culture-based fisheries where they
have been stocked with fish, either artificially by the government or naturally through connecting
water bodies (seasonal streams).
• Dam management committee members confirmed that most of the caught fish is for home
consumption or sold within the villages. Moreover, the dams help to improve accessibility to fish
for consumption. Site visits during the research confirmed that women and children have access
to this resource and catch small quantities of various fish species with lines and hooks for direct
home consumption.
• Low-lying valley areas with a perennial water supply can provide an alternative location for
clusters of fish farmers, although management challenges associated with undrainable ponds
and seasonality may need to be taken into consideration.
• Challenges to fish farming in the region include a lack of development incentives and inadequate
technology transfer to fish farmers, since most NGOs in the area have concentrated their support
on agricultural activities.
• The ready market for fresh and dried fish and the visible absence of commercial fish farming in
the area create a huge opportunity for small-scale producers.
SLE Discussion Paper 01/2019Contents v
Contents
Acknowledgements .............................................................................................................i
Abstract ............................................................................................................................. ii
Keywords ........................................................................................................................... ii
Executive summary............................................................................................................ iii
Contents............................................................................................................................. v
Tables .............................................................................................................................. vii
Figures ............................................................................................................................ viii
Abbreviations .................................................................................................................... ix
1 Background of fish production ....................................................................................... 1
2 Objectives and methods ................................................................................................ 2
3 Results and discussion ................................................................................................... 5
3.1 Physical and climatological characteristics of the area ........................................... 5
3.2 Fish farming statistics ...................................................................................... 5
3.3 Fingerling supply and availability ....................................................................... 7
3.4 Small-scale fish farming ................................................................................. 10
3.5 Seasonal calendar of farming activities ............................................................. 16
3.6 Small water bodies ....................................................................................... 18
3.7 Fish availability and consumption .................................................................... 21
3.7.1 Fish consumption tendencies by consumer classes .......................................... 24
3.7.2 Fish consumption by FIES group ...................................................................... 26
3.7.3 Most commonly consumed fish species by consumer classes ...........................27
3.7.4 Most commonly consumed fish species by FIES group .................................... 28
3.7.5 Fish market survey ........................................................................................... 29
3.7.6 Key findings on fish consumption ..................................................................... 31
4 Recommendations ...................................................................................................... 32
5 Bibliography ............................................................................................................... 35
6 Annexes...................................................................................................................... 38
Annex 1: Summary of study objectives and methods ................................................... 38
Annex 2: Stakeholder mapping ............................................................................... 39
Annex 3: Travel schedule ....................................................................................... 43
SLE Discussion Paper 01/2019vi Contents
Annex 4: Guiding questions for key informant interviews with hatcheries ........................ 45
Annex 5: Fish availability in Eastern province: local market and store check..................... 46
1. Shoprite supermarket Chipata .................................................................................. 46
2. Yalelo outlet store .................................................................................................... 46
3. Dried fish at local markets .........................................................................................47
4. One retail store offering frozen fish ...........................................................................47
SLE Discussion Paper 01/2019Tables vii
Tables
Table 1: Consumer survey .................................................................................................................. 4
Table 2: Statistics on fish farming and small water bodies ................................................................. 6
Table 3: Current status of government hatcheries and a private hatchery in Eastern Province ........... 9
Table 4: Characteristics of some small-scale fish farms in Eastern Province ..................................... 12
Table 5: Seasonal calendar for fish farming cooperative groups in Chipata and Lundazi ...................17
Table 6: Management characteristics of dams visited during the study ........................................... 20
Table 7: Dams stocked under the SUN project – Chipata district ...................................................... 21
Table 8: Categories of consumers interviewed during the study ...................................................... 22
Table 9: General frequency of fish consumption .............................................................................. 25
Table 10: Average fish consumption (kg/person/year) per FIES group .............................................. 26
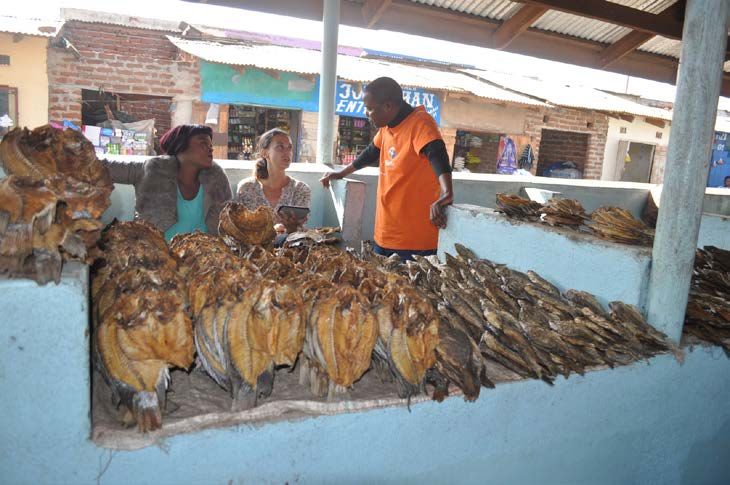
SLE Discussion Paper 01/2019viii Figures Figures Figure 1: Annual fish production in Zambia from capture fisheries and aquaculture (mt) ................... 1 Figure 2: Study area in Eastern Province ............................................................................................ 3 Figure 3: Location of small water bodies in Zambia (Mudenda 2009) ................................................. 7 Figure 4: Composting banana leaves in a pond crib .......................................................................... 11 Figure 5: Pond excavation process in Chipata................................................................................... 13 Figure 6: Fishponds at the small-scale Lundazi Fish Farmers’ Cooperative....................................... 14 Figure 7: Small uneven ponds with poorly constructed dykes........................................................... 15 Figure 8: A focus group discussion underway with a dam management committee in Lundazi ........ 16 Figure 9: Chiwoko Dam in Mambwe district invaded by water hyacinth........................................... 19 Figure 10: Small fish are commonly found in most of the dams........................................................ 20 Figure 11: Number and gender of persons according to their FIES ................................................... 22 Figure 12: FIES of consumers (%) divided by wealth categories........................................................ 23 Figure 13: FIES of consumers (%) divided by consumer category ..................................................... 24 Figure 14: Fish consumption (kg/person/year) per FIES group and consumer class........................... 27 Figure 15: Last consumed fish species and form of fish by consumer category (%) .......................... 28 Figure 16: Last consumed fish species, form of fish and price/kg by FIES group (%) ......................... 29 Figure 17: An interview with a fish trader at Lundazi market ............................................................ 30 SLE Discussion Paper 01/2019
Abbreviations ix

Abbreviations
ALCOM   Aquaculture for Local Community Development Programme
DO      Dissolved oxygen
DoF     Department of Fisheries
BEAF    Advisory Service on Agricultural Research for Development
ESAPP   Enhanced Smallholder Agriculture Promotion Programme
FCR     Food conversion ratio
FIES    Food insecurity experience scale
GDP     Gross domestic product
GIZ     Deutsche Gesellschaft für Internationale Zusammenarbeit
IFAD    International Fund for Agricultural Development
mt      Metric tonne
NGO     Non-governmental organisations
SEWOH    “One World – No Hunger” initiative
SLE     Centre for Rural Development
SUN     Scaling Up Nutrition programme
SWB     Small water body
USADF   United States African Development Foundation
ZMK     Zambian kwacha

                                                                    SLE Discussion Paper 01/2019
Background of fish production 1
1 Background of fish production
Fish is a regular part of the Zambian diet and contributes over 20 % of animal protein in people’s diets
(Musumali et al. 2009, NFDS Africa 2016). Fish plays a significant role in dietary diversity and nutritional
security, especially for poorer households in urban and rural areas alike (Mofya-Mukuka and Kabisa 2017,
Genschick et al. 2018). Zambia’s total fish demand is estimated to be 185,000 mt per annum (African
Development Bank 2016), while in 2017 total fish production was estimated to be 120,963 mt, of which
32,888 mt was from aquaculture production, representing almost one third of total fish production (DoF
2018). Additionally, a further 37 % of the national fish requirement is met through imports from various
countries.
Fish catches from Zambian lakes and rivers have stagnated at around 80,000 mt p. a., despite
increased fishing efforts (DoF 2018) (Figure 1). Fish stocks of commonly consumed species such as
“kapenta” – a name for different, pelagic small freshwater fish species (e.g. Engraulicypris
Engraulicyprisardella, Limnothrissa miodon) – are exploited to their maximum and a further increase in
the supply of fish from wild catches seems unlikely. To fulfil the demand for high value fish protein for
Zambia’s growing population, aquaculture is becoming an increasingly important livelihood strategy and
a contributor to gross domestic product (GDP) (Kruijssen et al. 2018).
Figure 1: Annual fish production in Zambia from capture fisheries and aquaculture (mt)
Aquaculture in Zambia grew considerably between 2005 and 2017. Kaminski et al. (2018) show that
aquaculture almost tripled between 2004 and 2014, mostly due to the introduction of large-scale cage
culture and land-based pond companies in the south of the country. The aquaculture value chain has
become increasingly commercialised and has been upgraded with high quality feed and seeds that has
SLE Discussion Paper 01/20192 Objectives and methods
recently become available in the country (Kaminski et al. 2018; Kruijssen et al. 2018). The growth of the
small-scale sector has not kept pace with this trend, mostly due to challenges in accessing inputs, training
and other services. While many of these farmers grow fish as a semi-commercial activity, mainly for
consumption at home and by rural populations nearby, productivity and total production are thought to
be low (Kruijssen et al. 2018).
The conditions for fish farming in Zambia are diverse and vary between regions. In Eastern Province,
fish are scarce due to there being relatively few perennial streams and lakes compared to other areas in
Zambia, therefore aquaculture mostly depends on water being diverted from reservoirs or seasonal
production of fish in rain-fed wetlands. This means that the number of sites suitable for pond culture is
likely to be limited, although this was not fully explored in the present study. Estimates by the
Department of Fisheries (DoF) (2015) indicate that approximately 1,500 small-scale fish farmers operate
in Eastern Province, mainly cultivating three-spotted tilapia (Oreochromis andersonii). This is an
important indigenous fish for Zambia as it is undergoing a national genetic improvement programme.
The present study aimed to establish the number of active fish farmers in Eastern Province and to learn
more about their current cultivation methods and challenges.
In order to meet the high demand for fish, the Department of Fisheries established four government-
run hatcheries in Eastern Province. The main hatchery is the central Chipata Aquaculture Research
Station where the primary broodstock is kept, while the other four government-run fish farms, located
in Sinda (Nyanje), Lundazi, Katete and Chadiza, act as decentralised fingerling production units. At
present, there are no private hatcheries operating in the province. One aspect of this study was to gather
information about the capacity and function of these hatchery units and their efficiency at distributing
seeds.
A considerable number of reservoirs (called small water bodies (SWB) or dams) have also been
established in Eastern Province for irrigation purposes and to supply water for livestock and household
use. These dams also act as culture-based fisheries whereby SWBs are artificially stocked by
(government-run) hatcheries and managed by community-run dam management committees like a
capture fishery (i.e. no feeding regimes). These systems also have the potential to contribute nutritious
fish to the daily diet of resource-poor people, especially women and children (ALCOM 1997). This study
investigated the current management of these systems and their potential for food and nutrition
security.
2 Objectives and methods
The two-week field trip (19 August – 2 September 2018) was conducted in the Chipata, Petauke,
Lundazi, Katete, Sinda and Mambwe districts in Eastern Province (see Fig. 2). These districts were
selected because they are the most productive areas for fish farming in the province, according to the
provincial fisheries officers in the DoF.
SLE Discussion Paper 01/2019Objectives and methods 3
Figure 2: Study area in Eastern Province : Chipata, Lundazi, Petauke, Katete, Sinda and Mambwe
districts
The objectives of the scoping study were:
• to evaluate the current status and potential of government-run hatcheries and provide
recommendations on improving fingerling productivity and distribution
• to assess aquaculture production systems in the province and identify opportunities and
challenges, including cage farming and/or culture-based fisheries in dams and reservoirs
• to assess the productivity, function and management of reservoirs (small water bodies and
dams), with a special focus on the contribution to food security, especially for women and
children
• to assess potential conflicts with other forms of water use (drinking water, water for
agricultural use etc.)
• to explore current management regimes of small water bodies and dams
• to analyse the source, availability and affordability of fish and fish preferences in the diets of
rural and urban Zambians
SLE Discussion Paper 01/20194 Objectives and methods
• to explore current feeding strategies with farmers and identify opportunities for integration
with other value chains or on-farm activities.
A total of 57 consumers were interviewed (15 women, 42 men) from five different categories (see
Table 1): fish farmers (13), urban dwellers (13), fish traders (7), rural dwellers with access to SWBs and/or
ponds (20), and rural individuals without access to SWBs and/or ponds (4).
Table 1: Consumer survey
Urban Rural dwellers Rural dwellers
Fish farmers Fish traders
dwellers with pond without pond
Total 13 13 7 20 4
Men 12 7 4 17 2
Women 1 6 3 3 2
Questionnaires were conducted using the Food Insecurity Experience Scale (FIES). The FIES is an
index of access to food at individual or household levels. It measures the severity of food insecurity based
on people’s responses to questions about constraints on their ability to obtain adequate food. The FIES
is derived from two widely used experience-based food security scales: the US Household Food Security
Survey Module and the Latin American and Caribbean Food Security Scale. It consists of a set of eight short
“yes” or “no” questions asked directly in face-to-face interviews. The questions focus on self-reported,
food-related behaviours and experiences associated with increasing difficulties in accessing food due to
resource constraints. The FIES is based on a well-grounded construct of the experience of food insecurity
and comprises three domains: uncertainty/anxiety, changes in food quality and changes in food quantity
(Ballard et al. 2013). The answers result in four different scales: “food secure”, “mildly food insecure”,
“moderately food insecure” and “severely food insecure”.
The second part of the questionnaire was about the frequency of fish consumption, sources of fish,
and the species, amount and price of the last fish purchased. The answer categories for the frequency of
fish consumption were “daily”, “weekly”, “monthly”, “yearly” and “never”. The answer categories for the
most common source of fish are “from the lake”, “from the fish farm pond”, “from the local market”,
“from the supermarket” and “from another place”. Participants were asked more specifically about the
last fish they purchased for the household and answered with the fish species they bought/caught, how
much it weighed (grams) and the value of the fish (in Zambian Kwacha - ZMW). The information on the
frequency of fish consumption, the number of household members and the weight of the last fish bought
allowed the average consumption of fish in kg/person/year to be calculated. The prices (ZMW/kg) of the
different fish species were calculated using the numbers given for the last fish species purchased.
Seven key informant interviews with provincial and district fisheries officers and hatchery managers
were also conducted. In Lundazi, the team interviewed the manager of the only private fish hatchery in
Eastern Province, which is still under construction. Semi-structured interviews where held with 13 small-
scale fish farmers (12 men, 1 woman). Focus group discussions (with about 20 people) were conducted
SLE Discussion Paper 01/2019Results and discussion 5
with two fish farmer cooperatives: one in Chipata with 48 members and another small-scale farmer’s
cooperative in Lundazi with over 80 members. Three dam management committees were also
interviewed.
The interview guidelines for the key informant interviews with hatchery managers are provided in
Annex 4. Semi-structured interviews with fish farmers, consumers and fish traders were conducted
according to the digital questionnaires “Consumer2018MW”, “Supplychainactor2018MW” and
“Fishfarmer2018MW” provided by GIZ. Focus group discussions and key informant interviews with the
dam management committees were conducted in accordance with a template provided by GIZ. A
detailed description of the objectives and methods is presented in Annex 1. Annex 2 provides the list of
stakeholders and key informants, and Annex 3 contains the travel schedule.
3 Results and discussion
3.1 Physical and climatological characteristics of the area
Eastern Province has great potential for agriculture due to favourable conditions for the growth of
many crops such as tobacco, groundnuts, sunflowers, soybeans, wheat, sweet potatoes and cotton, and
for livestock production of cattle, goats and poultry for example. The province, which is lightly hilly with
wide shallow valleys of gentle slopes and an open savanna biome, has been described as a marginal area
for fish farming. The average annual rainfall is limited to 1,014 mm and is concentrated between
November and April. Evaporation is on average 1,448 mm, leading to a rainfall deficit of 434 mm
(Goppers and Miller 1989). Few perennial streams exist, which is a reflection of the mostly coarse-
textured soils with a low to moderate water retention capacity. Waters in the area have been described
as slightly acidic and of low fertility (ALCOM 1988). This could change over a long period of time and may
vary from one area to another. A water availability analysis is required when considering any serious
aquaculture investment, and some capital investments (pumps, boreholes) may also be required.
In the district of Chipata there are hardly any perennial streams. It is estimated that 99 % of streams
run dry by the end of August (ALCOM 1988). The number of sites suitable for pond fish culture is limited
and the only potential alternative sites are small water bodies. Temperatures average a high of 27.7 °C
and a low of 16.3 °C minimum. Normal tilapia reproduction is limited to the warmer months from
September to March, when average temperatures exceed 22 °C. Given these physical and climatological
aspects, the area calls for a cautious approach to fish farming development (Goppers and Miller 1989).
3.2 Fish farming statistics
According to the DOF’s fisheries statistics annual report of 2014, Eastern Province had a total of 1,533
farmers producing an estimated 134.46 mt of fish. During the present study, statistical information from
key informants showed that out of a total of about 1,965 registered farmers in the area, only 719 were
actively involved in fish farming. This means that 67 % of registered fish farmers in the province are
SLE Discussion Paper 01/20196 Results and discussion
currently inactive. Evidence from this research suggested that a large number of farmers have
abandoned production. Although the reasons for this were not explicitly explored, it became obvious that
water shortages and a lack of inputs prevented farmers from successfully growing fish. Further
investigation would be required to reveal all the challenges they faced.
This study showed that most fish farmers depend on seasonal rain-fed excavated ponds located in
shallow valleys with gentle slopes. These areas seem to have clayey soils that hold water when other
surrounding areas dry up. Many of these fishponds, however, still dry up between July and August with
the onset of summer. It was therefore difficult to generate reliable statistics and observations because
many farmers had no water in their ponds or were not fish farming at that time. Key informant interviews
with the DoF revealed that the department faces many challenges in visiting farmers and providing
extension support. It was therefore difficult to estimate the total number of active farmers at a given time
because it also appeared to vary between seasons. Production or total yield data were even more difficult
to estimate because most surveyed farmers produced fish for subsistence, meaning that households
have partial harvesting strategies throughout the year for household consumption. None of the surveyed
farmers kept records on pond size, stocking densities or other key variables required to measure
productivity. It was also very difficult to extract their existing knowledge about this. Table 2 gives the
recent fisheries and fish farming statistics provided by the key informants, DoF officers, during this study
compared to the numbers in older registers from the district reports.
Table 2: Statistics on fish farming and small water bodies
Pond culture Small water bodies
District No. of registered No. of active fish No. of SWBs
No. of SWBs
fish farmers farmers stocked with fish
Chipata 223 54 22 10
Katete 50 25 10 2
Sinda 205 167 5 0
Petauke 50 25 36 2
Lundazi 1,427 438 33 2
Mambwe 10 10 2 0
Total 1,965 719 108 16
SWBs in Zambia are concentrated in the Eastern and Southern Provinces, which are more prone to
drought than other parts of the country (Fig. 3). Most of these reservoirs were built in the 1950s and 1960s
to mitigate drought conditions and provide water for livestock and irrigation.
SLE Discussion Paper 01/2019Results and discussion 7
Figure 3: Location of small water bodies in Zambia (Mudenda 2009)
There is conflicting information about the actual number of small water bodies in Eastern Province.
An earlier study by Goppers and Miller (1989) reported 213 SWBs covering an area of 2,000 ha. A more
recent report suggests 135 SWBs covering an area of 675 ha (Musuka & Musonda 2013). It could be that,
since 1989, many of these dams have either dried up or are no longer managed, although this needs to
be explored further. The DoF (2014) fisheries statistics annual report mentioned 125 active SWBs
covering an area of 625 ha. During the present study, a key informant from the DoF confirmed that there
are about 140 SWBs in the province, some of which are not currently active. In recent decades some of
these water bodies have been artificially stocked with fish to provide a source of protein to surrounding
communities, while other dams have been naturally stocked with fish from connecting water bodies
(seasonal streams).
3.3 Fingerling supply and availability
The main fish species cultured in Eastern Province are Oreochromis andersonii, Oreochromis
macrochir, Tilapia rendalli and Clarias gariepinus. Some reports from farmers suggested that Oreochromis
niloticus still exists in some systems and water bodies in Eastern Province, although this could not be
verified. It was suggested that this species was introduced decades ago by donor-driven programmes
before any regulations on species restrictions were in place. While O. niloticus is used in the south of the
country with special permits, the government has banned its use elsewhere nationally, including Eastern
Province, due to concerns around local fish biodiversity and the effects of introducing non-native fish
species to the environment (Genschick et al. 2017). As an alternative, O. andersonii has been identified as
an indigenous fish species suitable for improving aquaculture in Zambia (Gopalakrishnan 1988, Kefi et al.
2013) and is thus promoted in Eastern Province.
SLE Discussion Paper 01/20198 Results and discussion
Eastern Province has four government fish farms at Lundazi, Chipata, Nyanje and Chadiza, with a
total of 49 fishponds covering a total area of 7.8 ha (Mudenda 2009). A fifth station in Katete appears to
have been built more recently and has not previously been mentioned in the literature. The Chipata
Aquaculture Research Station operates as the main hatchery and is where research activities also take
place. The other hatcheries operate as decentralised hatcheries to provide fingerlings for nearby farmers
in rural areas.
The infrastructure at the government research stations is in need of rehabilitation. Currently,
government hatcheries are underutilised and operate below their capacity due to a lack of resources and
capacity. The stations struggle to produce large amounts of fingerlings. Moreover, none of them
produces sex-reversed fingerlings. In 2017, the Chipata Research Station distributed 46,000 fingerlings
to small-scale fish farmers and 240,000 for stocking in SWBs. The Nyanje government fish farm
distributed 37,000 fingerlings to 176 fish farmers in Sinda, Petauke and Katete (Table 2). The seed stations
continue to struggle with an inadequate water supply, seepage and a general lack of capacity, resources
and dilapidated infrastructure to produce a consistent amount of fingerlings.
Other than Chipata, Katete is the only other station with an indoor hatchery. The facility, which
seems to have been built more recently, suffers from considerable seepage in the breeding ponds and is
currently not operating. The site selection process is unclear, particularly whether consideration was
given to soil type in the initial stages of construction. The decentralised fish seed distribution system that
was designed to reach fish farmers in the province requires capacity development to increase the
availability and accessibility of fingerlings. Government aquaculture stations in Eastern Province require
urgent attention in terms of infrastructure rehabilitation, human resources and funding to meet
operational costs. The government hatcheries run on public funding and although they sell fingerlings at
around ZMW 0.5 per fingerling, this does not cover the costs needed to sustain a consistent seed supply.
The findings of fingerling supply and distribution from this study are summarised in Table 3 below.
This study also reports the presence of the first private indoor hatchery in the province, which is still
under construction. Mpanga Yala Enterprise has started to build the hatchery in Lundazi with a grant
from the International Fund for Agricultural Development (IFAD) under the Enhanced Smallholder
Agriculture Promotion Programme (ESAPP). The programme’s business model is unclear. The hatchery
depends on the demand for fingerlings from fish farmers or from government or donor-driven
programmes to stock SWBs.
SLE Discussion Paper 01/2019Results and discussion 9
Table 3: Current status of government hatcheries and a private hatchery in Eastern Province
Current
Number of Requirements for
No. of Active Status of method of
Station fingerlings operations to
ponds ponds hatchery fingerling
sold 2017 resume/commence
production
Indoor Broodstock
46,000 sold
hatchery stocked in - Dam repairs to
to small
present but dam without stop leakages
scale
not yet hapas - Lining of fishponds
farmers
Chipata operational (simple fish - Breeding hapas
21 2 240,000 for
(Govt) Outdoor cages), - Borehole for
stocking
breeding partial hatchery
small water
ponds have harvest of - Logistics &
bodies
high water mixed sex operational funds
seepage fingerlings
Outdoor
breeding - Lining of fishponds
Chadiza ponds not Not No - Breeding hapas
6 0
(Govt) operational operational fingerlings - Logistics &
due to high operational funds
seepage
Outdoor
breeding - Lining of fishponds
ponds not - Breeding hapas
operational - Siphon
Lundazi due to Not No replacement
9 0
(Govt) breakdown operational fingerlings - Funding to operate
of siphoning piggery
system from - Logistics &
dam to operational funds
fishpond
Broodstock
Indoor
in breeding
hatchery
pond
Lundazi present but
without
Mphanga operation No Funding of second
3 2 hapas to
yalala stalled, fingerlings phase of project
meet own
(Private) awaiting
fingerling
further
needs
funding
SLE Discussion Paper 01/201910 Results and discussion
Current
Number of Requirements for
No. of Active Status of method of
Station fingerlings operations to
ponds ponds hatchery fingerling
sold 2017 resume/commence
production
Operational Broodstock
37, 000
difficulties stocked in
distributed
due to high ponds,
to 176 - Lining of fishponds
seepage of without
Nyanje farmers in - Breeding hapas
9 4 breeding hapas,
(Govt) Sinda, - Logistics &
ponds partial
Katete & operational funds
harvest of
Petauke
mixed sex
districts
fingerlings
Indoor - Lining of fishponds
Katete
hatchery Not No - Breeding hapas
Kamphampbe 6 0
present, not operational fingerlings - Logistics &
(Govt) operational operational funds
3.4 Small-scale fish farming
Aquaculture production systems used in sub-Saharan Africa can be differentiated by their extensive,
semi-intensive and intensive natures. Systems are on a continuum of intensification, depending on
several factors such as technologies, species, level of capital investment, labour and management
practices. These three systems exist in Zambia, however the Zambian government characterises them
using a rather narrow typology, referring to them as either small-scale or large-scale production systems.
This characterisation creates a somewhat blurred line between extensive and intensive systems used by
small to medium-sized enterprises, and fails to take into account fish that are cultivated for subsistence
versus commercial purposes (Genschick et al. 2017). In contrast to this, Kruijssen et al. (2018) differentiate
between semi-commercial and commercial systems.
Eastern Province mostly has small-scale, semi-subsistence farmers who produce for household
consumption. There are no intensive, commercial systems in the province. Smallholder fish farming
systems in Zambia are characterised by extensive farming systems using low cost inputs and family
labour (Kaminski et al. 2018). Fish farming systems in small ponds (about 100 m2 in size) serve to improve
household food security and have been popularised by the Rural Aquaculture Project supported by the
United States Agency for International Development (USAID) and the United States Peace Corps. The
programme was responsible for the increase in households starting fish farming (Mudenda 2009). Over
the decades some small-scale fish farmers in the province have been trained by DoF extension officers
and camp agriculture officers through various extension programmes (Mudenda 2009).
Farmers with several small ponds may barter their harvest for grain or other food, while others
exchange it for agricultural labour during the peak labour season, which coincides with periods when rural
households experience food shortages. Stocking is generally low at 1 fish/m2 and juveniles are either
obtained from neighbouring farmers or from the nearest government fish farm. These fingerlings can
SLE Discussion Paper 01/2019Results and discussion 11
range in price, but are generally around ZMW 0.5. Intermittent harvesting is common, and sales are
mostly limited to neighbours and local village markets. Pond fertilisation is achieved through composting
and the construction of a crib to fertilise the pond (see Fig. 4). As seen from the quality of pond water on
the farms visited, farmers do not have adequate animal manure to fertilise their ponds, therefore green
leaves are used in compost cribs. This is unlikely to produce the nutrients required for pond fertilisation.
The composting cribs observed in this study were empty and generally not adequate for the purposes for
which they were maintained.
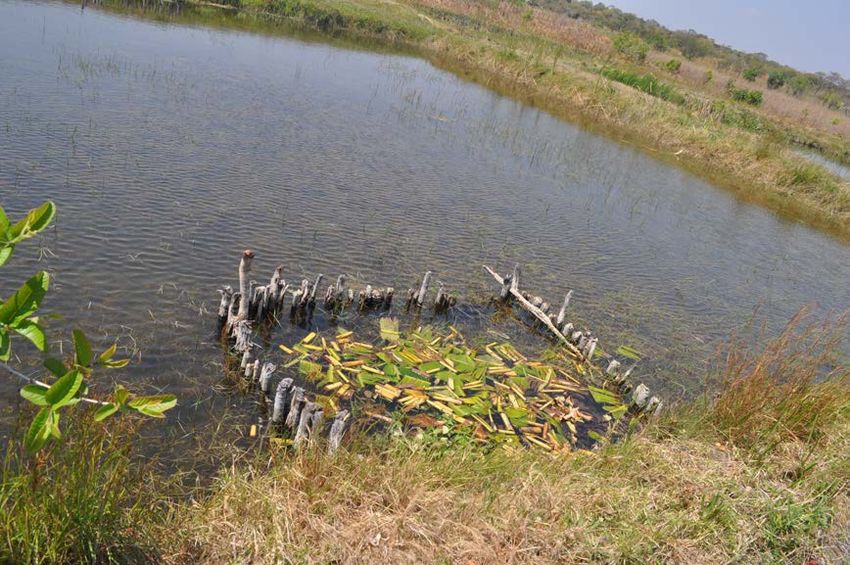
Figure 4: Composting banana leaves in a pond crib where the water is not yet well fertilised
The farms observed in this study were seldom located around natural water sources (which are rare
in the province). Most of the fishponds visited were located in isolation in low-lying valley areas, not too
far from established government aquaculture stations. Even if this was not seen during the farm visits for
this study, it is possible that fish farmers have formed clusters in certain areas in the district depending
on rainfall and the availability of water.
This study showed that the main sources of income for most farmers are agricultural crops and
livestock. Fish farming is undertaken as a secondary activity to produce fish for home consumption. This
finding is consistent with several studies on Zambian smallholder aquaculture (Kaminski et al. 2018,
Kruijssen et al. 2018, Nsonga 2015). The few fish farmers visited during this study carry out fish farming
for subsistence purposes in undrainable ponds integrated with crops (mostly banana and sugarcane).
Table 4 provides a summary of all the farms visited during the survey.
SLE Discussion Paper 01/201912 Results and discussion
Most of the farmers use maize bran as feed, often in combination with sunflower or soybean cake or
other vegetable material. These materials are mixed and applied as a mash. There is no further
processing of the feed materials (e.g. feed balls or pelleting). Thus the food conversion ratio (FCR) could
be expected to be quite high. Feeding studies by Lundeba et al. (in preparation) have suggested an FCR
of around 5:1 in similar systems with homemade feed in northern Zambia. Only one farmer in the sample
applied compound feed from a feed company based in Lusaka. This farmer had some capital to build
concrete ponds and intended to commercialise his production.
Table 4: Characteristics of some small-scale fish farms in Eastern Province
Years Pond
in fish Total
District Village Water supply Farming system
farmin # area Pond type
g (m2)
Subsistence –
Undrainable Rain,
integrated with
Chipata Pelesia 12 3 336 ponds of groundwater,
sugarcane on
about 1.5 m stream
dykes
excavated in
gentle valley Subsistence –
spring,
Petauke Philipo 18 7 1,590 integrated with
area groundwater
bananas on dykes
Lundazi Lundazi 1 5 400 Concrete Borehole Semi-commercial
Lundazi Rain,
Muntanila 15 1 150 Subsistence
Lumezi groundwater
Subsistence –
Lundazi Spring, integrated with
Chahero 7 4 250
Chasefu groundwater sugarcane
downstream
Subsistence –
Undrainable integrated with
Katete Mphangwe 2 9 2,315 ponds of Spring bananas on dykes
about 1.5 m and sugarcane
excavated in downstream
gentle valley Subsistence –
area Groundwater, integrated with
Sinda Chikankeni 1 2 800
spring vegetables
nearby
Chipata Malaya & Groundwater
15 6 2,400 Semi-subsistence
Co-op others & borehole
Daila &
Lundazi
seven 16 8 2,400 Groundwater Semi-subsistence
Co-op
others
SLE Discussion Paper 01/2019Results and discussion 13
Access to water seemed to follow a similar pattern across all the districts visited. Most ponds are
located in low-lying valley areas where farmers can benefit from groundwater (see Fig. 5), with occasional
springs or a rare stream located nearby. The depth of the fishponds in the area varies by season. During
the drier period of the year (July-November), water levels gradually decrease to about 1 m or less,
although farmers confirmed that water levels were high during the rainy season. Other farms experience
water shortages during the dry season, often resulting in ponds completely drying out. Fish farming
seems to have become a seasonal activity for most farmers, ending when fishponds dry up in August
before the onset of summer. This problem with droughts appears to have increased in recent years (i.e.
less rainfall, according to the perceptions of the farmers interviewed). This seems to have diminished the
motivation for developing fish farming in the area, although this aspect requires further investigation.
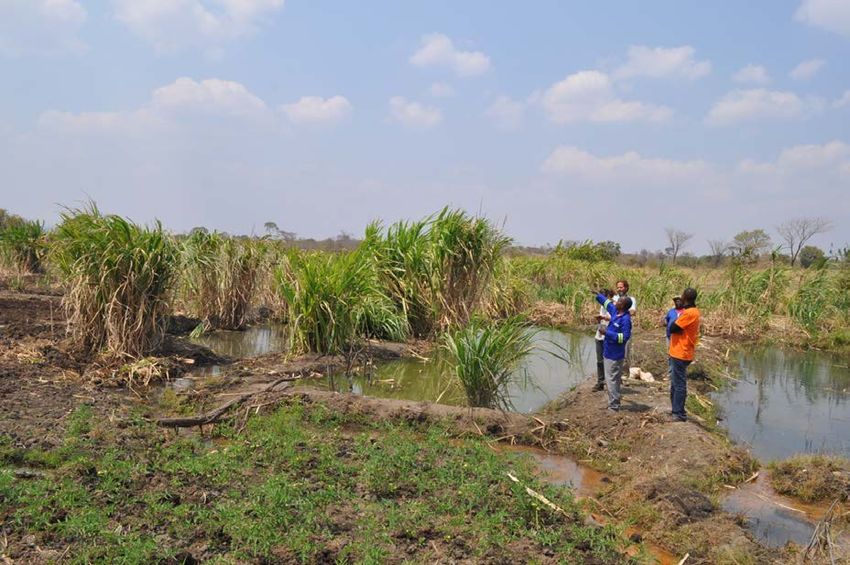
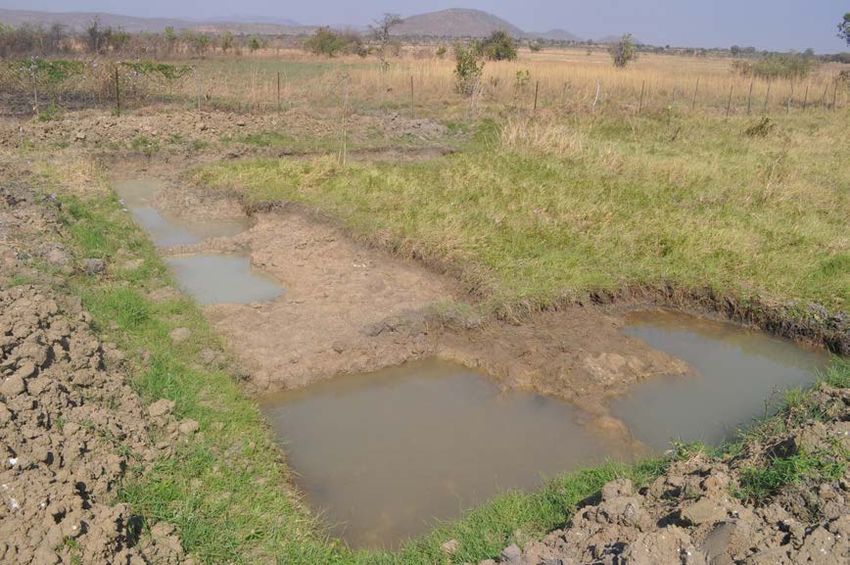
Figure 5: Pond excavation process in Chipata showing groundwater seeping before the pond is fully
constructed
Fish farming faces a long list of major challenges, most of which have long been observed among
small-scale farmers across the country. They include fingerlings of inadequate quality, insufficient animal
manure and compost material, a lack of affordable fish feed, a lack of appropriate technology, poor rural
infrastructure, a lack of marketing opportunities, insufficient extension packages and inadequate
operational funding for research and support to aquaculture stations (ACF/FSRP 2009, Mudenda et al.
2005, Utsugi and Mazingaliwa 2002).
SLE Discussion Paper 01/201914 Results and discussion
The adoption of smallholder aquaculture could help alleviate poverty and improve rural household
food security compared to that experienced by non-fish farming families (Mudenda 2006, Musuka and
Musonda 2012). The two cooperatives visited in Chipata and Lundazi (see Table 4) seemed to be
exploiting this potential. Fish farmers reported improved access to fish since the projects began. In some
instances, the cooperative in Lundazi deliberately made fish available for the most vulnerable members
of the community, particularly pregnant women and children.
Figure 6: Fishponds at the small-scale Lundazi Fish Farmers’ Cooperative , with cooperative
members in the background. The ponds have well-constructed dykes and compost cribs.
The Chipata Malajajest Cooperative owns six fishponds of about 400 m2 (20 m length × 20 m width ×
1.5 m depth) and the Lundazi Fish Farmers’ Cooperative has eight ponds of the same size. The
cooperatives seem to represent a much more successful model of small-scale fish farming compared to
individual farmers in the province. These farmers have more ponds with a larger surface area and well-
constructed dykes (Fig. 6). According to DOF standards, these are well-maintained ponds compared to
those of individual farmers who have fewer, smaller ponds with uneven dykes (Fig. 7).
Both cooperatives are among the few aquaculture projects in the province to have benefited from
donor funding. The Malajajest Cooperative was given a grant by the United States African Development
Foundation (USADF), which was used to fence the ponds, dig a borehole and install a pump and
generator. The cooperative was initially funded by the Lutheran World Federation. The cooperative in
Lundazi received a grant in 2016 from the Enhanced Smallholder Agriculture Promotion Programme
SLE Discussion Paper 01/2019Results and discussion 15
(ESAPP). However, the farmers seemed to have a problem making the project profitable and sustainable
as they mostly consumed the fish themselves with very little left for sale. In 2017, the Lundazi Fish
Farmers’ Cooperative harvested only 70 kg of fish from the eight fishponds (293 kg/ha) and shared 40 kg,
mostly among pregnant women and children, while the rest was sold. In the same year, the Chipata
Malajajest Cooperative harvested a total of 250 kg at about 100 grams per fish from six fishponds (1041
kg/ha) and sold their fish at ZMW 20 per kg to members and ZMW 30 per kg to non-members. This money
was used for operating costs, such as purchasing diesel to run the generator to pump water into the
fishponds. However, the cooperatives do not keep records and are not currently operating as businesses.
Members seemed motivated and knowledgeable about the ongoing activities and seemingly
benefited from sharing knowledge, learning and experience. This was in contrast to some individual
farmers who were attempting to farm fish with little experience, knowledge or extension support. The
cooperatives evidently received training and support from fisheries officers at their inception, although
farmers still stated that they required more training. Due to a lack of natural resources for fish farming in
the province (water, soil and land) and a lack of knowledge, inputs and extension support, it appeared
that people could engage in fish farming more successfully through collective action by forming
cooperatives.
Figure 7: Small uneven ponds with poorly constructed dykes
SLE Discussion Paper 01/201916 Results and discussion
3.5 Seasonal calendar of farming activities
Two focus group discussions revealed the seasonality of aquaculture and the availability of other
farm products. The rainy season begins in December and ends by April, and farmers grow rain-fed crops
such as maize, soybeans, groundnuts, beans, cotton and cassava. This period just before and during the
early rains is the busiest time for farming activities. Land preparation begins by September and tilling is
mostly done using oxen and hand-held tools. December to mid-January is the planting time for most crop
varieties.
Figure 8: A focus group discussion underway with a dam management committee in Lundazi
Fishpond digging usually starts in August and runs until November because this is the drier time of
the year and excavation is more convenient. This period of heavy work of pond construction coincides
with the time needed to prepare the land for crop planting. Farmers with several small ponds may barter
fish in exchange for agricultural labour time during this peak labour season, which also coincides with
periods when rural households experience food shortages (Mudenda 2009). Stocking of fishponds mostly
takes place from March to May since this is the time when ponds collect enough rainwater. Harvesting of
fish starts in June and continues until October. The fish-rearing cycle is around six months and stops when
water levels begin to recede. Some farmers are forced to completely harvest all their fish by August
because their ponds dry up completely. Fishponds are usually harvested when the fish reach between 80
and 200 grams. Since there are no sex-disaggregated fingerlings, fish multiply, which results in a wide
SLE Discussion Paper 01/2019Results and discussion 17
range of fish sizes. Overall, few fish reach a weight of more than 200 grams owing to poor management
techniques.
Table 5: Seasonal calendar for fish farming cooperative groups in Chipata and Lundazi
Sep Oct Nov Dec Jan Feb Mar Apr May Jun Jul Aug
Rainfall
Aquaculture activities
Pond digging
Stocking
Fertilisation
& feeding
Harvesting
Marketing
Main food sources
Maize
Cassava
Beans
Groundnuts
Main income sources
Maize
Groundnuts
Cassava
Soybeans
Sunflowers
SLE Discussion Paper 01/201918 Results and discussion
The main food crops are maize, cassava, soybeans and groundnuts. They are usually planted from
December to January and harvested from June to October. These food sources are abundant for home
consumption during the harvesting period, but drastically decline from November to February as most
of the harvest is sold for cash income. Therefore periods of food shortages occur at the time when rural
households have the least income. Coincidentally the lean season falls in the rainy season when farmers
need resources to prepare their fields. The seasonal calendar with detailed information is shown in Table
5.
In areas with a perennial water supply and located near dams, fish farming could ensure the
availability of fish for home consumption and for sale or barter during this crucial time. Fish farming could
provide an alternative source of food and income during the most challenging times of the year.
3.6 Small water bodies
To assess the opportunities for small water bodies and fish production, five dams were visited in three
districts, focus group discussions were held with dam management committees and interviews were
conducted with key informants. Most of the SWBs were constructed in the 1950s and 1960s and
rehabilitated between 2008 and 2016. SWBs are usually rainfed and/or groundwater-fed and store water
all year round. Around 1,000 to 5,000 people living around the dams have access to the resource and are
allowed to use the water for livestock, irrigation, fishing activities and domestic use (washing of clothes).
The water is not used for drinking because the villages generally have separate boreholes and wells.
In order to strengthen food security in areas with communal water bodies, stocking of fish in existing
water impoundments is one promising approach (Mudenda 2009). This has happened in the district of
Chipata, where 10 small water bodies were recently stocked with fish under the Scaling Up Nutrition
(SUN) programme in 2017 (see Table 7. The Zambian Government is implementing the SUN programme
through the National Food and Nutrition Commission. It is expected that after taking up fish-raising
activities, the surrounding communities will benefit from easy access to fish, which will in turn increase
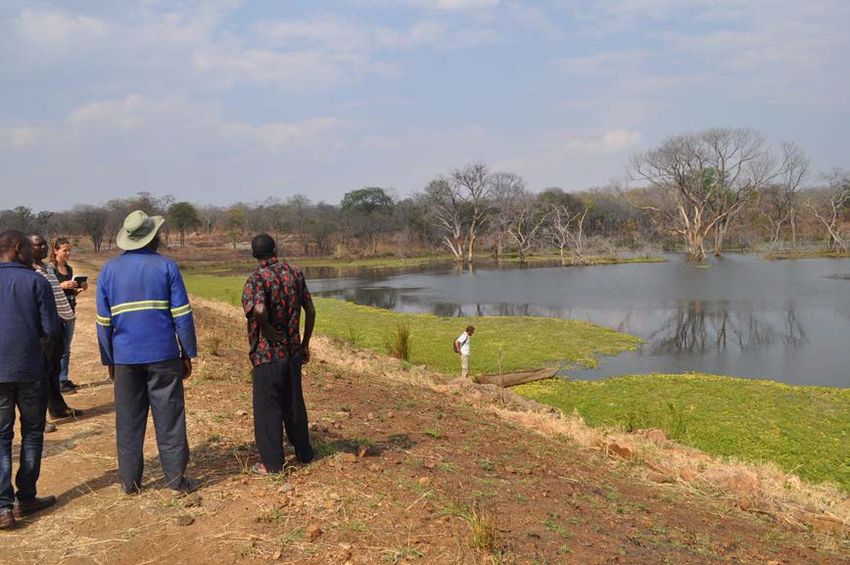
their protein intake and nutrition, especially for children and pregnant women. In Mambwe district an
NGO plans to install cages on Chiwoko dam, which will benefit the surrounding villages. Chiwoko Dam,
which was recently established in 2017, is around 15 m deep. The dam has been invaded by an aquatic
weed (water hyacinth), which needs to be cleared before any further aquaculture development can take
place (see Fig. 9). This weed was not encountered in any of the other dams visited. Some water bodies
are in need of de-silting and dyke repairs as part of the development process.
SLE Discussion Paper 01/2019You can also read