Intensive landscape-scale remediation improves water quality of an alluvial gully located in a Great Barrier Reef catchment - HESS
←
→
Page content transcription
If your browser does not render page correctly, please read the page content below
Hydrol. Earth Syst. Sci., 25, 867–883, 2021
https://doi.org/10.5194/hess-25-867-2021
© Author(s) 2021. This work is distributed under
the Creative Commons Attribution 4.0 License.

Intensive landscape-scale remediation improves water quality
of an alluvial gully located in a Great Barrier Reef catchment
Nicholas J. C. Doriean1 , William W. Bennett1 , John R. Spencer1 , Alexandra Garzon-Garcia2 , Joanne M. Burton2 ,
Peter R. Teasdale3,4 , David T. Welsh5 , and Andrew P. Brooks1
1 Coastal and Marine Research Centre, Griffith University, Southport 4215, Queensland, Australia
2 Department  of Environment and Science, Queensland Government, Brisbane 4102, Queensland, Australia
3 UniSA STEM, Scarce Resources and Circular Economy (ScaRCE), University of South Australia,

Adelaide 5000, South Australia, Australia
4 Future Industries Institute, University of South Australia, Adelaide 5000, South Australia, Australia
5 School of Environment and Science, Griffith University, Southport 4215, Queensland, Australia

Correspondence: Andrew P. Brooks (andrew.brooks@griffith.edu.au)

Received: 5 June 2020 – Discussion started: 7 July 2020
Revised: 28 December 2020 – Accepted: 4 January 2021 – Published: 23 February 2021

Abstract. Gully erosion can be a major disruptor to global        ity monitoring techniques can be deployed in a configura-
fluvial sediment budgets. Gully erosion in the catchments         tion that ensures sample collection redundancy and comple-
of the Great Barrier Reef is attributed to ∼ 40 % of fine         mentary data collection between methods. Monitoring was
suspended sediment pollution to the freshwater and marine         conducted during two consecutive wet seasons and, thus,
ecosystems downstream. Mitigating this source of erosion          can only provide preliminary information. Monitoring over
will have a lasting positive impact on the water quality of       longer timescales (i.e. 5–10 years) will need to be carried
connected rivers and the receiving marine environment. Here       out in order to validate the findings discussed herein. Sam-
we conduct a preliminary evaluation of the ability of inten-      ples collected from the remediated gully had significantly
sive landscape-scale gully remediation to reduce suspended        lower suspended sediment concentrations compared to the
sediment and associated nutrient export from a catchment          control gully, providing preliminary evidence that the reme-
draining to the Great Barrier Reef. The gully remediation         diation works were successful in stabilising erosion within
method was a first attempt, in the region, at investing a high    the gully. Dissolved and particulate nutrient concentrations
level of financial (total cost of remediation AUD ∼ 90 000)       were also significantly lower in the remediated gully sam-
and logistical effort (e.g. intensive earthworks, including the   ples, consistent with the decreased suspended sediment con-
establishment of an on-site quarry) to develop long-lasting       centrations. The novel combination of suspended sediment
erosion mitigation measures (i.e. regraded, compacted, and        measurements from both the gully channels and overland
battered gully walls, rock armouring of banks and channel,        flows in the surrounding gully catchments suggests that sed-
and installation of rock check dams). A novel suspended sed-      iment and nutrients at the remediated site are likely sourced
iment monitoring network, comprised of a suite of new and         from erosion processes occurring within the catchment of the
established automated monitoring methods capable of oper-         gully (at relatively low concentrations). In contrast, the pri-
ating in remote environments, was used to evaluate the wa-        mary source of suspended sediment and associated nutrients
ter quality of a remediated gully, a control gully, and their     at the control gully was erosion from within the gully itself.
respective catchments. The recently developed pumped ac-          This study demonstrates the potential of landscape-scale re-
tive suspended sediment (PASS) sampler optimised to sam-          mediation as an effective mitigation action for reducing sus-
ple ephemeral water flows was deployed in gully outlets           pended sediment and nutrient export from alluvial gullies. It
and catchment runoff flow paths. This study demonstrates          also provides a useful case study for the monitoring effort re-
how the combination of low- and high-cost water qual-

Published by Copernicus Publications on behalf of the European Geosciences Union.
868             N. J. C. Doriean et al.: Intensive landscape-scale remediation improves water quality of an alluvial gully

quired to appropriately assess the effectiveness of this type     coastal waters (Brooks et al., 2009, 2018; Shellberg et al.,
of erosion control.                                               2013).
                                                                     A recent review by Bartely et al. (2020) identified sev-
                                                                  eral scientific studies that evaluated the effectiveness of gully
                                                                  remediation on improving water quality in various regions
                                                                  around the world, including the French Alps (Mathys et
1   Introduction                                                  al., 2003), southern regions of the United States of Amer-
                                                                  ica (Polyakov et al., 2014; Nichols et al., 2016), Spain
Gully erosion is a significant contributor to the increase        (Hevia et al., 2014), China (Rustomji et al., 2008; Wang
in global soil erosion rates and is a major driver of sus-        et al., 2011), and Ethiopia (Ayele et al., 2018; Dagnew et
pended sediment-related impacts on downstream aquatic sys-        al., 2015). Bartely and co-workers (2020) concluded that
tems (Poesen, 2011; Bartely et al., 2020). This is particu-       remediation efforts generally decrease the sediment yield
larly relevant for water quality conditions in the Great Bar-     of eroding gullies and, thus, improve water quality condi-
rier Reef (GBR), which are negatively impacted by fluvially       tions. However, water quality improvements were driven by
sourced pollutants, primarily suspended sediment, dissolved       the extent of remediation (catchment and gully) and the re-
and particulate nutrients, and agrochemicals (Waterhouse et       establishment of vegetation in the gully post-remediation
al., 2018; Bartley et al., 2014; Brodie et al., 2012; Fabricius   (Bartely et al., 2020). Until recently, studies of gully reme-
et al., 2005). Land use change, such as mining, agriculture       diation effectiveness in GBR catchments have focussed on
(grazing and cropping), and urbanisation associated with Eu-      smaller-scale gullies (i.e. hillslope gullies), with the appli-
ropean settlement in the region since the 1860s has increased     cation of low-intensity erosion controls such as cattle exclu-
the output of fine sediment and nutrients from the catch-         sion fencing, revegetation, and the manual installation of tree
ments draining into the GBR (Bartley et al., 2018; Kroon et       branch and/or geotextile fabric check dams (Bartley et al.,
al., 2016). Catchment-tracing studies have consistently iden-     2017; Wilkinson et al., 2013, 2015b, 2018). These strategies
tified sub-surface erosion processes, particularly from stream    are effective at reducing erosion in smaller gullies; however,
banks and gullies, as being the dominant source of fine sed-      they are not well suited for stabilising the much larger allu-
iment delivered to the GBR (Olley et al., 2013; Wilkinson         vial gullies that are present in many GBR catchments.
et al., 2015a). Gully erosion in particular has been identi-         Recent research suggests alluvial gullies in GBR catch-
fied as the largest single source of suspended sediment, es-      ments require the intervention of intensive landscape-scale
timated to contribute more than 40 % of all fluvially trans-      remedial efforts to stem further erosion and reduce sediment
ported sediment entering the GBR (McCloskey et al., 2017).        export (Brooks et al., 2016b; Brooks et al., 2018; Carey et
Recent research suggests that these sediments, particularly       al., 2015; Howely et al., 2018). There are several alluvial
from grazing lands, also act as a source of bioavailable nitro-   gully erosion mitigation projects currently underway in ma-
gen (Garzon-Garcia et al., 2018a, b).                             jor GBR catchments (e.g. the Normanby and Burdekin catch-
    Gullying occurs when unconsolidated soils and sediments       ments), which are trialling various remedial works, including
become exposed and eroded by fast-flowing storm runoff            large-scale earthworks (i.e. reshaping of active gully head
(Brooks et al., 2018; Casalí et al., 2009). Gully erosion is a    scarps and sidewalls), rock chutes (including the applica-
natural process; however, land use changes have increased         tion of geotextile matting), rock capping and mulching of
the rate of gully erosion and the subsequent sediment ex-         potentially erodible soils, and the installation of bed con-
port (Prosser and Slade, 1994; Shellberg et al., 2016). The       trol and water velocity reducing measures (e.g. check dams).
tropical climate of the GBR catchment region creates intense      Stock exclusion and revegetation are also important mit-
rainfall events (often > 40 mm h−1 ) that can rapidly erode       igation measures implemented in these gully remediation
tonnes of soil from an actively eroding gully during a single     projects, often in concert with other treatments. The overall
storm (Brooks et al., 2015; BOM, 2020). Of the various types      aim of these remedial trials is to ascertain the control mea-
of gullies present in the GBR catchment region (i.e. hills-       sures that are capable of permanently reducing alluvial gully
lope, colluvial, ephemeral, and soft-rock badlands), alluvial     erosion and associated sediment and particulate nutrient ex-
gullies likely represent the largest source of sediment to the    port (Brooks et al., 2016b, 2018, 2020b; GA, 2019).
GBR (Brooks et al., 2013, 2020a). Alluvial gullies consist           We hypothesise that the application of landscape-scale
of mostly fine (< 63 µm) dispersive and/or slaking sediments      gully erosion control measures (i.e. gully reshaping, soil
and are located on the floodplains or terraces of river sys-      compaction, rock armouring of channels and banks, and the
tems, thus increasing the chance of sediment transport to ma-     installation of check dams) will cause a reduction in the sus-
jor rivers and marine-receiving environments (Brooks et al.,      pended sediment and nutrient concentrations at the study site.
2013, 2016a). These characteristics, coupled with the high        Here we aim to assess the effectiveness of landscape-scale re-
connectivity of the gullies to river channel networks, mean       mediation in improving the water quality of an alluvial gully
that a large proportion of the eroded fine sediment and as-       situated in the tropics of Queensland, Australia, which flows
sociated nutrients from alluvial gullies will be exported to      to the Great Barrier Reef. We apply a recently developed

Hydrol. Earth Syst. Sci., 25, 867–883, 2021                                         https://doi.org/10.5194/hess-25-867-2021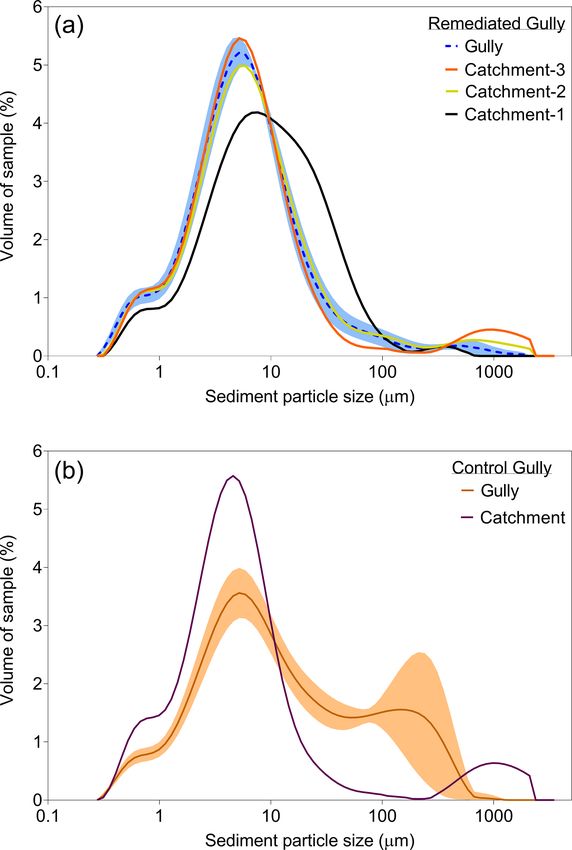
N. J. C. Doriean et al.: Intensive landscape-scale remediation improves water quality of an alluvial gully                      869

gully water quality monitoring approach that facilitates ac-        suspended sediment in a similar manner; thus, it is assumed
curate measurements while meeting the financial and opera-          that the suspended sediment concentration (SSC) and PSD
tional requirements of monitoring in remote locations. This         from the two gullies would have been similar, pending any
work, although done on a limited spatial and temporal scale,        significant differences in water velocity.
provides a critical foundation for developing and evaluating           The remediation of the larger gully complex was designed
landscape-scale remediation of alluvial gullies in the Great        to halt the highly active erosion within the rapidly incising
Barrier Reef region.                                                part of the gully and slow the scalding and sheet erosion
                                                                    processes within the broader gully catchment through de-
                                                                    stocking and the construction of contour berms (Brooks et
2     Methods                                                       al., 2018).

2.1    Study site                                                   2.2   Gully remediation

The study site is located on a cattle station in the Cape York      The large actively eroding alluvial gully complex was re-
Peninsula region of Queensland, Australia. There are several        mediated using various intensive, landscape-scale gully ero-
gullies that have formed in the alluvial floodplain and terrace     sion control earthworks during the 2016 dry season. The
of the Laura River (Fig. 1). The tropical climate of the region     entire gully complex was regraded and compacted using
is characterised by wet (October to April) and dry (May to          heavy machinery. Gypsum was added during this process
September) seasons. Approximately 95 % of the annual rain-          to reduce soil dispersibility (Liu and She, 2017), and ge-
fall (regional mean annual rainfall is 936 mm) occurs during        ofabric covering was applied over the former gully head
the wet season (Brooks et al., 2014a; BOM, 2020). The study         scarp and held in place by a coarse sandstone surface cap-
site topography is relatively flat (average slope of the gul-       ping. The rest of the gully complex was capped with lo-
lies and respective catchments at the site ranges from 8.6 to       cally sourced shale rock. Check dams were installed at reg-
9.7 m m−1 ), with undulating gradients surrounded by sand-          ular intervals (approximately every 40 m) in the three major
stone ranges. The alluvial sediments comprising the flood-          channels that replaced the original gully lobes (Sect. S1 in
plain/terrace are derived from the Laura River catchment,           the Supplement). After this, the entire gully complex was
which is dominated by the Ordovician Hodgkinson Forma-              seeded with native vegetation and livestock were excluded
tion meta-sediments, late Jurassic/early Cretaceous Gilbert         from the gully and its surrounding catchment. No remedial
River sandstones, and Quaternary/Neogene Mclean Basalts             efforts were applied to the control gully, other than the ex-
(Brooks et al., 2013, 2014b; Fig. 1).                               clusion of livestock (Sect. S1; Brooks et al., 2018). Time-
   A total of two gullies were used to evaluate the effective-      lapse footage of the remedial works is available online at
ness of the remediation works. The remediated gully is the          https://www.youtube.com/watch?v=dCbV1BggnKI (last ac-
larger of the two, which encompasses several gully lobes            cess: 22 February 2021; CYNRM, 2017).
that drain into a central channel. The gully treatment area
                                                                    2.3   Monitoring design
is ∼ 0.6 ha, with a catchment area of 13.7 ha. The catch-
ment of the remediated gully is a conglomerate of three sub-        While gullies commonly share similar patterns of formation
catchments (sub-catchments 1–3; Fig. 1). The active sec-            and erosion, there are many variables that need to be con-
ondary incision of the control gully is ∼ 0.2 ha, while the         sidered before implementing a monitoring plan to evaluate
gully catchment, which drains directly into the head scarp,         water quality within a gully system. Ideally, it is best to iden-
has an area of 3.3 ha. Both gullies are situated in highly          tify the factors that will have the greatest influence on gully
dispersible and slaking sodic alluvium. Prior to remedia-           water quality and monitor them prior to any remediation in
tion, both gully catchments would have undergone similar            order to establish a baseline of water quality conditions (i.e.
erosion processes (i.e. scalding, sheet erosion, riling in the      a standard before–after–control–impact (BACI) design). Any
gully catchment and tunnel erosion, head scarp mass fail-           water quality monitoring assessment of a gully, particularly
ure, and gully sidewall erosion within the incised part of          those being used to evaluate the effectiveness of remediation
the gully). Erosion rates derived from repeated airborne lidar      efforts, should provide a representative measure of the fol-
collected before remediation was conducted (2009 to 2015)           lowing parameters:
indicate that the control gully produced slightly more sed-
iment (61 t ha−1 yr−1 ) compared to the remediated gully              – Rainfall – the primary driver of continued gully erosion
(50 t ha−1 yr−1 ), based on the gully catchment area (Brooks            (Castillo and Gómez, 2016).
et al., 2016b). Comparison of the particle size distribu-
tion (PSD; Sect. 3.2.3) from readily erodible soil collected          – Soil – characterising basic soil physico-chemical pa-
from the two gullies, prior to the remediation activities,              rameters will aid in understanding the transformation of
showed that there was no significant difference between the             soil into suspended sediment and how that may affect
two gullies. It is likely that these soils would have eroded into       water quality (Brooks et al., 2016b, 2018).

https://doi.org/10.5194/hess-25-867-2021                                            Hydrol. Earth Syst. Sci., 25, 867–883, 2021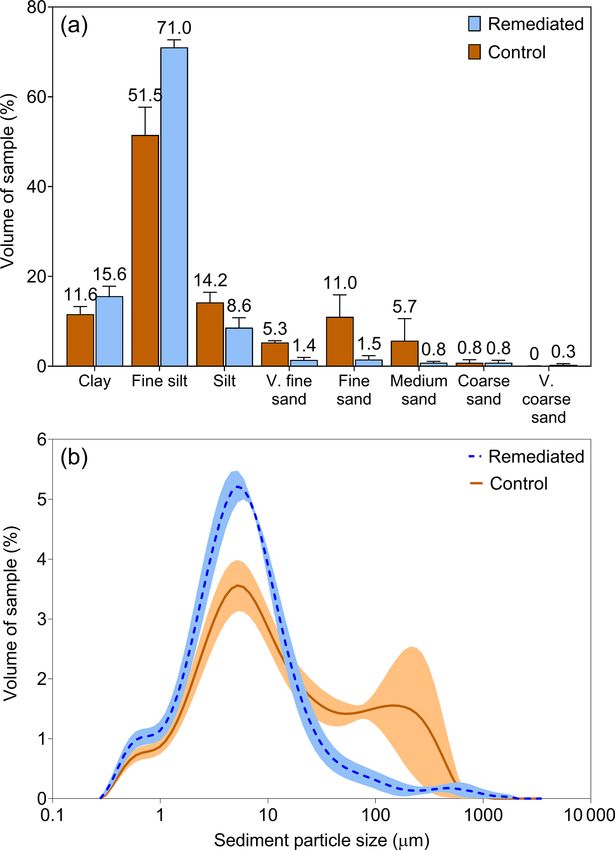
870 N. J. C. Doriean et al.: Intensive landscape-scale remediation improves water quality of an alluvial gully
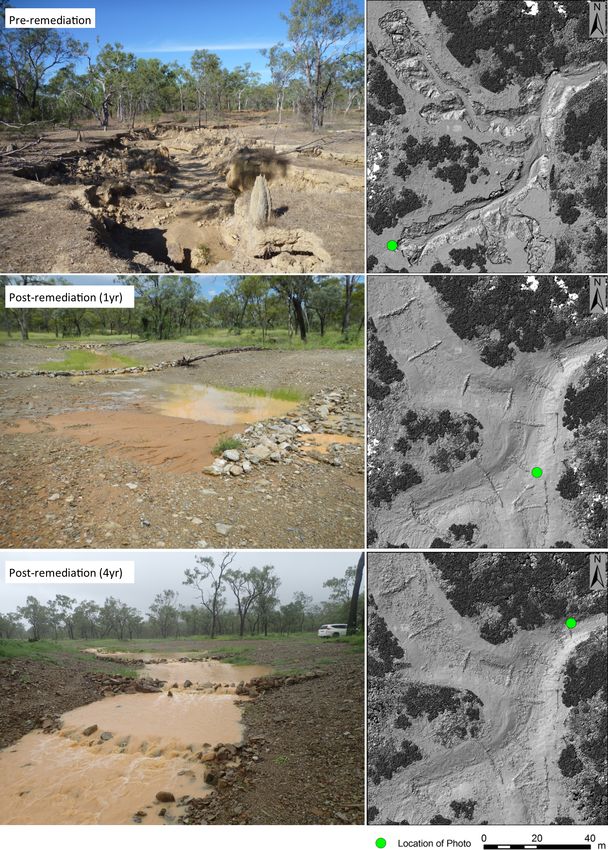
Figure 1. Topographic map of the study site, including surface geology and gully locations. Source: Geoscience Australia (2019). PASS –
pumped active suspended sediment (PASS) sampler; overland PASS – a PASS sampler used to sample water flowing overland (i.e. runoff);
rising stage – single-stage sampler (i.e. rising stage sampler). Note: the overland PASS sampler in sub-catchment 3 of the remediated gully
was deployed several metres away from the flow line inferred by surface geology due to the redirection of flow associated with vegetation
and termite mounds.
– Water quality – it is recommended that at least two dif- 2.4 Monitoring methods
ferent means of water sample collection/measurement
are used to ensure a representative measure of SSC and 2.4.1 Hydrological and meteorological monitoring
PSD. Entire flow events should also be monitored, if
possible (e.g. a time-integrated sample of an event is A total of two rainfall gauges (Hydrological Services tipping
most representative). If possible, samples should be col- bucket rain gauges – 0.2 mm per tip – with HOBO data log-
lected from water flowing into the point of erosion (i.e. gers) were placed in the catchments of the remediated and
above the head scarp) and within the gully after the control gullies (Fig. 1). The rain gauges were programmed
point of erosion (i.e. downstream of the head scarp; to provide a near-continuous account of rainfall for the sam-
Doriean et al., 2020). pling period (2017–2018 and 2018–2019 wet seasons). Wa-
ter level loggers (in situ Rugged TROLL 100® data loggers)
In this instance, the remediation project was required to im- were programmed to measure every 2 min and were secured
plement the treatments and monitor the responses within a on the surface of a straight section of channel just down-
3-year timeframe; thus, a full BACI design was not possible. stream of each gully head (Fig. 1). A barometric logger (in
Instead, a control/impact design was used in which remedi- situ BaroTROLL® data logger) was placed underneath the
ation effectiveness was evaluated against a nearby, compara- remediated gully rainfall gauge and set to record atmospheric
ble un-remediated control gully (Sect. S2). A total of three pressure every 15 min.
repeat airborne LIDAR surveys were collected over a 6-year
period, which enabled the calculation of normalised baseline 2.4.2 Sample collection and monitoring
erosion rates for the two sites, demonstrating the comparabil-
ity of the treatment and control gullies (Brooks et al., 2016b). The original monitoring plan to evaluate the water quality
conditions, focusing on suspended sediment, was limited by
Hydrol. Earth Syst. Sci., 25, 867–883, 2021 https://doi.org/10.5194/hess-25-867-2021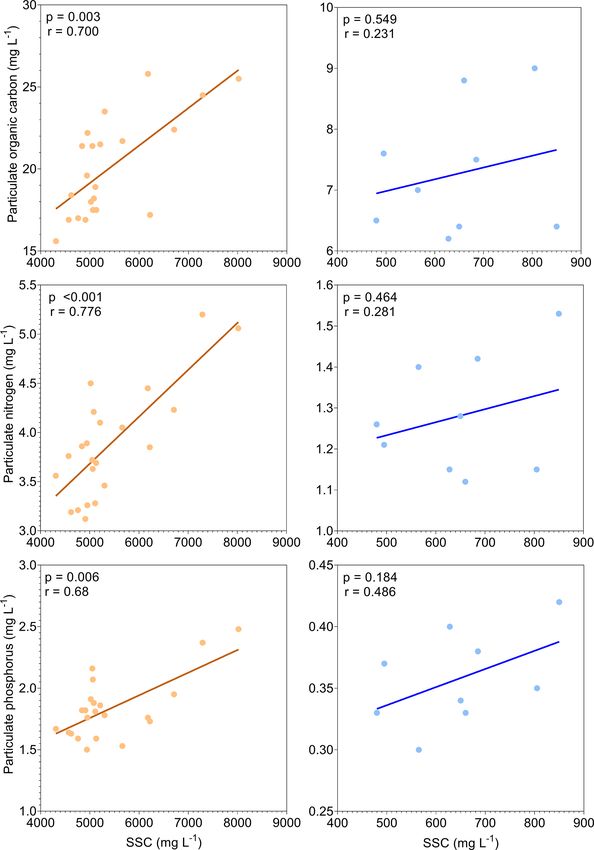
N. J. C. Doriean et al.: Intensive landscape-scale remediation improves water quality of an alluvial gully                   871

funding and available measurement techniques, which re-          pended sediment during a flow event (e.g. gully wall collapse
sulted in only the outlets of both gullies being monitored for   can impact large sections of the head scarp and expose deeper
the first wet season (2017–2018). The successful modifica-       erodible soils; Garzon-Garcia et al., 2016a).
tion of a recently established suspended sediment monitor-
ing method, the pumped active suspended sediment (PASS)          2.5   Sample analysis and statistics
sampler, for operation in gullies (Doriean et al., 2020) al-
lowed the monitoring network to expand spatially and, thus,      Water samples collected from the remediated and control
enabled the monitoring of the time-weighted average (TWA)        gullies were analysed for suspended sediment concentra-
SSC and PSD of sediment entering each gully from their re-       tion using gravimetry (ASTM standard method D 3977-97)
spective catchments during the 2018–2019 wet season.             and particle size distribution, using laser diffraction spec-
   A total of four different suspended sediment monitoring       troscopy (Mastersizer 3000; Malvern Panalytical). Samples
methods were used to collect water samples in the gullies,       were screened using a 2 mm sieve prior to analysis to remove
namely PASS samplers (Doriean et al., 2019) modified for         any large debris or detritus. TWA SSC of PASS samples was
gully deployments (Doriean et al., 2020), rising stage (RS)      determined using Eq. (1) as follows:
samplers (Edwards et al., 1999), autosamplers (Edwards et                      M
al., 1999), and turbidity loggers (Rasmussen et al., 2009;       TWA SSC mg L−1 =    ,                                       (1)
                                                                                  tF
Doriean et al., 2020). Several monitoring methods were used
in this study to provide multiple lines of evidence to deter-    where the total mass of suspended sediment collected by the
mine the effectiveness of the remediation activities in reduc-   sampler (M; mg) is divided by the volume of water sam-
ing suspended sediment and nutrient export and provide in-       pled during deployment subtracted from the duration of sam-
sight into the performance of the different monitoring meth-     pler operation (t; min) and multiplied by the pump flow
ods. Each of the monitoring methods used in the control and      rate (F ; L min−1 ).
remediated gullies were recently described and comprehen-           Sediment used for particle size analysis was not chemi-
sively evaluated by Doriean et al. (2020). The turbidity mea-    cally treated and was kept in suspension using mechanical
surements recorded from the two gullies did not provide use-     dispersion methods (i.e. a baffled container with an impeller
ful information for comparison of the gullies, and there were    stirrer; Doriean et al., 2020). Nutrient analyses were con-
few instances where turbidity measurements correlated with       ducted on a select group of samples. The samples were anal-
physically collected samples. Therefore, turbidity measure-      ysed for total and dissolved organic carbon (5310 TOC and
ment data collected from the gullies are not reported further    DOC 2017), and total and dissolved nitrogen and phospho-
here (see Doriean et al., 2020). The TWA SSC and PSD of          rus (4500-Norg D and 4500-P B). Dissolved nutrient species
overland flows (i.e. catchment runoff) into the gullies was      (ammonium, oxidised nitrogen, and phosphate) were anal-
measured from samples collected using PASS samplers con-         ysed using the following segmented flow analysis methods:
figured to operate in ephemeral waterways (Doriean et al.,       4500-NH3, 4500-NO3, and 4500-P (APHA 2005; Garzon-
2020). The natural slope of the land flowing into the gul-       Garcia et al., 2015, 2018c). Due to the remoteness of the
lies had several depressions or low points that collected wa-    field sites and the sporadic nature of flow events, it was only
ter as it flowed over the land; PASS samplers were installed     possible to retrieve nutrient samples from the autosampler
at these locations with the intake and float switch located      within 48 h of the initial collection on 24 January 2018 and
0.09 m above the ground (Sect. S2).                              6 February 2019. Nutrient samples were not retrieved from
                                                                 the other instruments (Manual, RS, or PASS samplers) be-
2.4.3   Soil sampling and analysis                               cause the samplers contained samples from previous flow
                                                                 events, or the samples could not be collected and processed
Soil samples were collected as part of the design phase of the   within the 48 h time frame. Consequently, the percentage of
gully remediation project (Brooks et al., 2016b, 2018). Soil     sand was likely underestimated in the samples, collected by
samples (1–2 kg) were collected from the face and walls of       the autosampler, which were analysed for nutrients (Doriean
the gullies (i.e. the areas undergoing erosion) using a hand     et al., 2020).
trowel and auger at depths ranging from the surface to 1 m.         GraphPad Prism® was used for statistical analysis of the
A total of 21 and 9 samples were collected from the reme-        sample data following an evaluation of the equality of group
diated and control gullies, respectively, prior to the remedi-   variances, using the Brown–Forsythe and Bartlett tests be-
ation activities. The soil samples were analysed for particle    fore an analysis using paired t tests, to assess the differences
size distribution, using the soil hydrometer method (Amer-       between the sample groups (p = 0.05). The data were found
ican Society for Testing and Materials (ASTM) standard           to be normally distributed. Pearson’s correlation analysis was
method 152H; Brooks et al., 2016b). Soil particle size dis-      also used to assess the relationship between SSC and nutrient
tribution data were composited and treated as an average for     concentrations.
the purpose of comparing gully soil to suspended sediment.
This was done as soil up to 1 m deep can be eroded into sus-

https://doi.org/10.5194/hess-25-867-2021                                         Hydrol. Earth Syst. Sci., 25, 867–883, 2021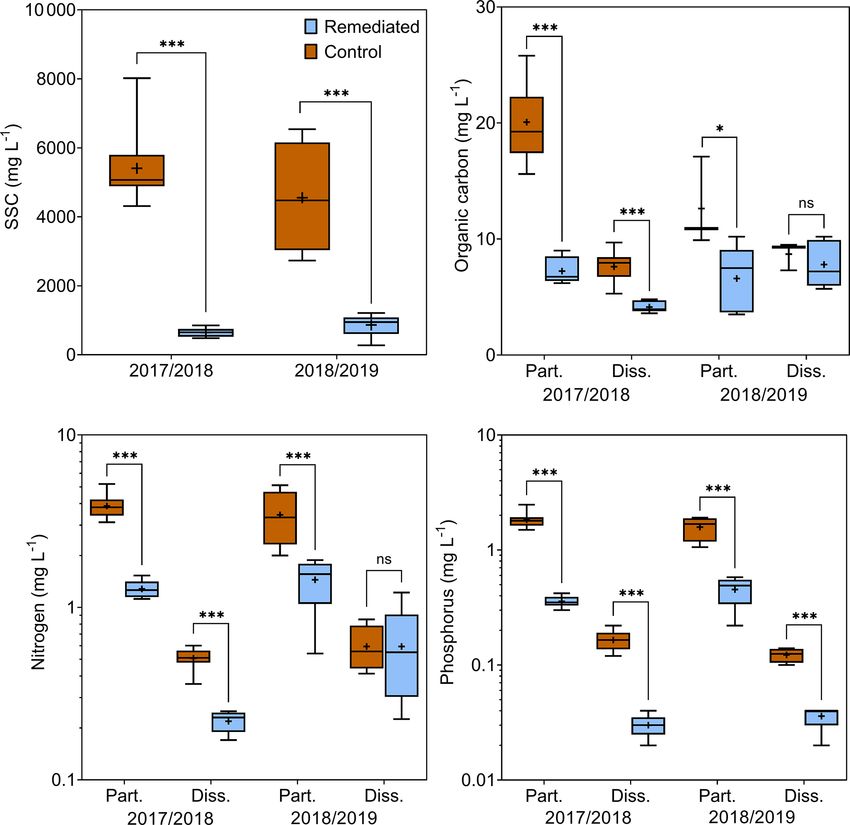
872                 N. J. C. Doriean et al.: Intensive landscape-scale remediation improves water quality of an alluvial gully

Table 1. Uncertainties, of either SSC or PSD measurements, associ-               be deployed to achieve accurate rainfall intensity data. While
ated with suspended sediment monitoring methods used in alluvial                 there were many intense storms that resulted in flow events
gullies. Source: Doriean et al. (2020).                                          in the studied gullies, there were two major flood backwa-
                                                                                 tering events that occurred in the 2018–2019 wet season as
    Sampler type                         Uncertainty (%)                         a result of high-intensity rainfalls in the region surrounding
                      TWA SSCa          PSD d10       PSD d50          PSD d90   the study site (Sect. S3). A review of historical DNRME
                                                                                 stream gauge water level data of the Laura River at Coal
    Autosampler          25 (±10)              10         25                45
                                                                                 Seam Creek showed that these backwatering events typically
    RSSb                 20 (±10)               9         12                 2
    PASS sampler           9 (±5)              10         20                20   occurred with a ∼ 3-year frequency over the 20-year data set
                                                                                 (DNRME, 2019).
a TWA SSC – time-weighted average SSC; b RSS – rising stage sampler.

                                                                                 3.2     Impact of remediation on suspended sediment
                                                                                         characteristics
2.6     Data quality and uncertainty
                                                                                 Soil characteristics and erosion estimates for the control and
Throughout this study, we attempt to acknowledge the un-                         remediated gullies (prior to remediation) based on catchment
certainty associated with the various monitoring techniques.                     size, area of readily erodible gully soil, and repeat lidar aerial
A previous evaluation of the sample collection methods was                       measurements suggest that the control and remediated gullies
used during this study to determine the approximate uncer-                       likely had similar suspended sediment dynamics (Brooks et
tainty associated with each method (Table 1; Doriean et al.,                     al., 2013, 2016b). The following sections describe how PSD,
2020). These uncertainties were accounted for when inter-                        SSC, and most nutrient concentrations of samples collected
preting data from the various methods.                                           from the remediated gully were significantly different and
                                                                                 lower than the control gully for both wet seasons (2017–2018
                                                                                 and 2018–2019). A time series of all monitored flow events
3     Results and discussion                                                     is included as supporting information (Sect. S3).
Repeat airborne and terrestrial lidar imaging suggest the ero-                   3.2.1    Suspended sediment concentration
sion controls deployed in the remediated gully had no sig-
nificant failures, and that sediments are being retained be-                     The remote location and challenging monitoring conditions
hind the check dams (Fig. 2). Samples were collected from                        which are typical of alluvial gullies meant that multiple sus-
approximately half (five to six) of all flow events (> 0.2 m                     pended sediment sampling methods were used to ensure that
peak water level) recorded for the 2017–2018 wet season.                         the most representative data were collected throughout both
Fewer events (3–4) were sampled during the 2018–2019 wet                         wet seasons (Doriean et al., 2020). Overall, the SSC range
season due to two major backwater flooding events at the                         of samples collected by each method from the outlet of the
study site caused by high water levels in the Laura River (see                   remediated gully were significantly lower compared to those
Sect. S3 for hydrographs of all sampled events). These flood                     collected from the outlet of the actively eroding control gully
events damaged equipment and contaminated samples with                           (Table 2).
flood water. However, the flood events did not appear to af-                        PASS sampler data were used to compare time-weighted
fect the erosion mitigation structures of the remediated gully                   average (TWA) SSC and other suspended sediment charac-
(Sect. S4). Despite the challenges of monitoring these remote                    teristics (i.e. PSD and SSC by sediment particle size class) of
systems, and the unpredictable nature of flow events, suffi-                     the remediated and control gullies because the method col-
cient samples were collected from a range of flow event types                    lected samples with the most representative PSD and TWA
(i.e. intensity, length, and time of year; Sect. S3) to meet the                 SSCs (Doriean et al., 2020) and monitored the most flow
objectives of the study.                                                         events during both wet seasons (Sect. S3). The low temporal
                                                                                 resolution of PASS sample data, theoretically, allows for the
3.1     Rainfall and major hydrological events                                   potential underestimation of SSC when very high SSCs are
                                                                                 present at high flow rates for only short periods over the dura-
Rainfall totals at the study site for the 2017–2018 (920 mm)                     tion of a flow event (Doriean et al., 2019). However, compa-
and 2018–2019 (915 mm) wet seasons were not significantly                        rable SSC data collected by manual flow proportional sam-
different from the yearly average (943 ± 283 mm) of the                          pling, autosamplers, and RS sampler methods, which have
permanent rain gauge operated by the Queensland Depart-                          high temporal resolution, corresponded well with the SSC
ment of Natural Resources, Mines, and Energy (DNRME)                             range of the PASS samples from both gullies (Table 2), in-
located at Coal Seam Creek, ∼ 13 km from the study site.                         dicating that the PASS samples were representative of the
The on-site and DNRME rain gauges were in broad agree-                           measured events.
ment (R 2 = 0.50; Sect. S5), although the variability in the re-
lationship confirms that on-site rainfall gauges should always

Hydrol. Earth Syst. Sci., 25, 867–883, 2021                                                         https://doi.org/10.5194/hess-25-867-2021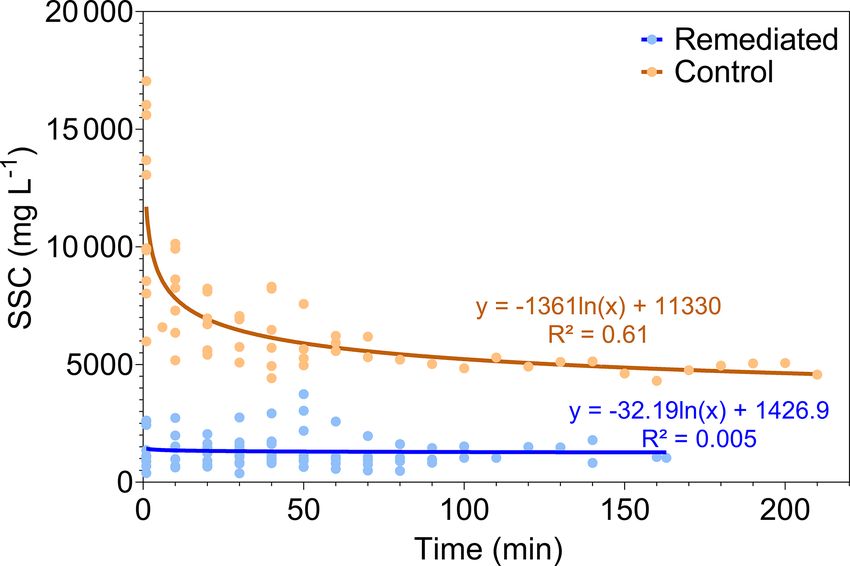
N. J. C. Doriean et al.: Intensive landscape-scale remediation improves water quality of an alluvial gully                             873

Figure 2. Before and after photos (left column) of the remediated gully and repeat lidar images (right column) of the remediated gully for
the years 2016 (unremediated), 2017 (post-remediation – 1 year), and 2019 (post-remediation – 4 years). Note the aggradation of sediment
in the gully. Green dots show the locations of the photographs. The information in this figure has been modified from Brooks et al. (2020b).

   The median TWA SSC of PASS samples collected from                    2709 mg L−1 ) validate the assumption of similar contribu-
the control gully (7123 ± 2670 mg L−1 ) was about five-fold             tions of suspended sediment from the two gully catchments
higher than the median TWA SSC of samples collected                     during the monitoring period (see Table 4; Sect. 3.2.3). Com-
from the remediated gully (1429 ± 411 mg L−1 ) (Table 3;                parison of remediated and control gully TWA SSC by sedi-
Sect. 3.2.3). This, and the statistical analysis, suggests there        ment particle size class indicates that the remedial works re-
was significantly (p < 0.001) more sediment export due to               duced the concentration of suspended sand (by 96 %), silt (by
erosion within the control gully than in the remediated gully.          76 %), and clay (by 73 %; Fig. 3). Bulk densities of the dif-
The TWA SSC of the catchment water flowing into the                     ferent sediment size fractions were very similar (∼ 0.1 g L−1
remediated (461–3556 mg L−1 ) and control gullies (485–                 difference), and thus, an average density was used to deter-

https://doi.org/10.5194/hess-25-867-2021                                                 Hydrol. Earth Syst. Sci., 25, 867–883, 2021
874             N. J. C. Doriean et al.: Intensive landscape-scale remediation improves water quality of an alluvial gully

Table 2. Descriptive statistics of SSC samples collected from the control and remediated gullies during the 2017–2018 and 2018–2019 wet
seasons.

                Sampling method                                 Remediated gully                                      Control gully
                                                         AS       FPS       RSS       PASS∗                 AS        FPS         RSS        PASS∗
                Number of samples                        79         7         18           6               61          10          18             8
                Minimum (mg L−1 )                       350       364        378        1150             4146        3823        5675          5948
                25 % percentile (mg L−1 )               827       421        906        1201             5055        4829        7874          6103
                Median (mg L−1 )                       1063       493       1502        1280             6180        5761        9177          7348
                75 % percentile (mg L−1 )              1492       688       2736        2011             8162        6631       11278          8472
                Maximum (mg L−1 )                      3035       842       5278        2044            53086        8550       28696         14125
                Range (mg L−1 )                        2685       478       4900         895            48939        4728       23021          8177
                Mean (mg L−1 )                         1204       562       1860        1495             7773        5858       10560          7963
                Standard deviation (mg L−1 )            542       177       1275         411             6669        1331        5167          2670
                Standard error of mean                   61        67        300         168              854         421        1218           944
                Lower 95 % CI of mean                  1083       398       1226        1064             6065        4906        7990          5730
                Upper 95 % CI of mean                  1325       725       2494        1927             9481        6811       13129         10195
                Coefficient of variation               45 %      31 %       69 %        28 %             86 %        23 %        49 %          34 %
                Sampler type                           Are the control and remediated gullies significantly different? (p = value)
                AS                                                                        Yes (p < 0.0001)
                FPS                                                                       Yes (p = 0.0001)
                RSS                                                                       Yes (p < 0.0001)
                PASS                                                                      Yes (p = 0.0007)
              AS – autosampler; FPS – flow proportional sampling; RSS – rising stage sampler; PASSS – PASS sampler. ∗ S – PASS samples represent the
              time-weighted average suspended sediment concentration for the time that the sampler was deployed.

                                                                                    Table 3. Time-weighted average suspended sediment concentration
                                                                                    and particle size distribution data of samples collected, using PASS
                                                                                    samplers, from the remediated and control gullies during the 2017–
                                                                                    2018 and 2018–2019 wet seasons. Note that the catchment samples
                                                                                    (n = 2 per sampling location) were only collected during the 2018–
                                                                                    2019 wet season.

                                                                                      Sampling location                TWA SSC (mg L−1 )                   PSD (µm)
                                                                                                                                                    d10       d50      d90
                                                                                      Control gully                            7123 (±2670)         1.79     10.8     175
                                                                                      Control catchment                           485–2709          1.04     4.29      26
                                                                                      Remediated gully                          1429 (±419)         1.40     5.84      27
                                                                                      Remediated catchment 1                        337–563         1.71     8.11      36
                                                                                      Remediated catchment 2                      461–1517          1.27     5.52      30
Figure 3. Median SSC by sediment size class for PASS samples
                                                                                      Remediated catchment 3                      808–3556          1.27     5.06      24
collected from the control (brown) and remediated (blue) gullies
                                                                                    Please note that each catchment PASS sample TWA SSC represents the average SSC of several
during the 2017–2018 and 2018–2019 wet seasons. Error bars rep-                     flow events.
resent the sample standard deviation. Autosampler and RS sampler
SSC by PSD are included in Sect. S7.
                                                                                    3.2.2     Relationship between SSC and flow
mine the different SSCs by size class (Sect. S6). The reduc-
                                                                                    There is currently insufficient water discharge data to accu-
tion in SSC across different sediment particle size classes in-
                                                                                    rately estimate the sediment loads of the two gullies moni-
dicates that the remedial works are effectively reducing ero-
                                                                                    tored in this study. The unstable nature of gully banks and
sion and sediment export from the remediated gully. How-
                                                                                    bed features means the channel cross-section can change
ever, because this study only includes two wet seasons of
                                                                                    dramatically during a single event, thus obtaining an accu-
data, it should be considered preliminary until it is further
                                                                                    rate measurement of the gully channel cross section over a
validated by continued monitoring of the remediated gully
                                                                                    wet-season is rarely feasible. As a result, the use of a dis-
for several additional wet seasons.
                                                                                    charge related rating curve based on a single measure of

Hydrol. Earth Syst. Sci., 25, 867–883, 2021                                                                  https://doi.org/10.5194/hess-25-867-2021
N. J. C. Doriean et al.: Intensive landscape-scale remediation improves water quality of an alluvial gully 875
Figure 4. Relationship between SSC and stream height for single flow events in the control (a – flow event B) and remediated (b – flow
event F) gullies that occurred during the 2018–2019 wet season (Sect. S3). Water level (black line), PASS TWA SSC (green line), and flow
proportional (FP) sampling (red circles with black line) are shown.
channel cross-section will have high uncertainty (Malmon et
al., 2007). Furthermore, manual measurements of water ve-
locity are dangerous due to the risk of rapid water level rise
(e.g. the control and remediated gullies often encounter water
level changes of 0.5 m in under 5 min) and the potential for
bank collapse in the control gully. Automated methods for
determining velocity or discharge (e.g. acoustic doppler ve-
locimeters/acoustic doppler current profilers) offer an alter-
native to manual measurements, however, these methods are
expensive and are limited to waters where SSC is typically
less than 15 000 mg L−1 , without additional site-specific cal-
ibration (Sottolichio et al., 2011). For these reasons it takes
considerable time and effort to collect sufficient data to ac- Figure 5. Relationship between time after initiation of flow and
curately determine gully discharge and, therefore, sediment SSC of samples collected from the control (brown) and remediated
load. Once an adequate amount of gully water discharge data (blue) gullies using autosamplers and RS samplers during the 2017–
are collected, sediment load estimates for the remediated and 2018 and 2018–2019 wet seasons. Trend lines represent logarithmic
control gullies will be calculated and published. regression models.
In the absence of water velocity data, comparison of water
levels (and thus shear stress), likely to show similar trends to
(R 2 < 0.01) between SSC and time after the initiation of flow
velocity and SSC, show that there was no obvious relation-
in the remediated gully (Fig. 5). The SSC trend in the reme-
ship for the control gully. However, SSC trends in the reme-
diated gully is no longer symptomatic of an actively eroding
diated gully, particularly in the 2018/19 wet season, may be
system, rather, it is a relationship similar to that of streams
linked to water level, likely as a function of velocity (Fig. 4;
transporting sediment sourced from the catchment (Doriean
Sect. S3). Additional flow event data, including water veloc-
et al., 2019; Nistor and Church, 2005). This suggests gully
ity measurements are needed to confirm this.
erosion is no longer a dominant sediment source and the
The SSC of samples collected from the control gully, us-
gully may now be a conduit for suspended sediment sources
ing RS samplers and autosamplers, suggest there is a gen-
from erosion processes occurring in the catchments.
eral decreasing trend in SSC following the initiation of flow
(R 2 = 0.61), regardless of changes in flow event length or 3.2.3 Particle size distribution (PSD)
stage height (Sect. S3; Fig. 5). This trend is likely the result
of instream processes, such as the rapid mobilisation of read- The PSD of erodible soil collected from both the control and
ily erodible soil from the gully and deposited fine sediment remediated gullies, prior to remediation, were not signifi-
from previous flow events. This contributes to a high initial cantly different (Sect. S8; Fig. 6). For both gullies, ∼ 45 %
SSC followed by a steady decrease in SSC to an equilibrium of readily erodible soil from the gully head scarp was com-
between the scouring of erodible gully soil source material prised of sand, with the remainder being silt (∼ 35 %) and
and the transport capacity of the water flowing through the clay (∼ 20 %; Fig. 6). The near identical PSD characteristics
gully (Malmon et al., 2007). These processes have been ob- of the readily erodible soil from both gullies is consistent
served in other ephemeral waterways and may be an inher- with their proximity and indicates that the control gully pro-
ent feature of these systems (Dunkerley and Brown, 1999; vides an appropriate comparison to evaluate the effectiveness
Malmon et al., 2002). In contrast, there was no relationship of remedial works at the remediated gully.
https://doi.org/10.5194/hess-25-867-2021 Hydrol. Earth Syst. Sci., 25, 867–883, 2021876 N. J. C. Doriean et al.: Intensive landscape-scale remediation improves water quality of an alluvial gully
Figure 6. Average PSDs, by size class, of soil collected from the
control (brown; n = 4) and remediated (blue; n = 14) gullies prior
to remedial works. Error bars represent the standard deviation of
each class.
Figure 8. Average suspended sediment PSD by sediment size
class (a) and plotted by frequency (b) for PASS samples collected
from the control (brown) and remediated (blue) gullies during the
2018–2019 and 2018–2019 wet seasons. Error bars (a) and shad-
ing (b) indicate the error as a standard deviation. Clay – < 2 µm; fine
silt – 2–20 µm; silt – 20–63 µm; very fine sand = 63–100 µm; fine
sand = 100–250 µm, medium sand – 250–500 µm; coarse sand –
Figure 7. Control gully soil (brown; n = 4) and control gully sus- 500–1000 µm; very coarse sand – 1000–2000 µm.
pended sediment (light brown; n = 6) PSD by size class. Error bars
represent the error as a standard deviation for the soil and sediment
PSDs, respectively.
sand was almost completely absent (< 6 %) in the remedi-
ated gully samples (Fig. 8). There was no visual evidence of
Suspended sediment samples from the control gully, col- bedload sediment (i.e. sand) settling in the remediated gully
lected using a PASS sampler, demonstrate the alteration in channel, rather, these coarser sediment particles (> 63 µm)
PSD of the gully soil when it becomes suspended under appeared to be trapped behind flow reduction structures (i.e.
flow, mixed with sediment from the catchment and selec- check dams; Sect. S9). This is consistent with observations
tively transported downstream (Fig. 7). This change in PSD of check dam performance in similar applications (Nyssen et
is expected because the sediment particles will distribute in al., 2004; Rustomji et al., 2008; Wei et al., 2017; Bartely et
the water column based on their physical and chemical char- al., 2020). Comparison of suspended sediment PSD charac-
acteristics, such as shape, size, mass, and affinity to floccu- teristics – 10th (d10 ), 50th (d50 ), and 90th (d90 ) percentiles –
late into composite particles (Vercruysse et al., 2017; Walling of PASS samples collected from the control and remediated
and Collins, 2016). Hence, lighter and finer particles (clay gullies show that the suspended sediment from the remedi-
and silt) were dominant in the suspended sediment samples. ated gully (d50 of 5.84 µm) was significantly finer than that
The bulk of the sand in the eroded gully soil is likely trans- of the control gully (d5 of 10.8 µm) (Table 3).
ported as bed load, with the proportion in the suspended frac- The PSD of control gully catchment PASS samples shifted
tion dependant on periods of high flow-velocity (Horowitz, to smaller sizes compared to the gully outlet PASS samples
2008). The presence of large deposits of sand within the con- (Table 3), which indicates that the contribution of slightly
trol gully channel bed supports this interpretation (Sect. S9). coarser suspended sediment from gully erosion (d50 of
Comparison of the average PSD of suspended sediment 10.8 µm) is greater than the suspended sediment contribu-
samples collected from the remediated and control gullies tion of the catchment (d50 of 4.29 µm) in the control gully. In
show that silt and clay were dominant in both, however, contrast, the PSD of suspended sediment samples collected
Hydrol. Earth Syst. Sci., 25, 867–883, 2021 https://doi.org/10.5194/hess-25-867-2021N. J. C. Doriean et al.: Intensive landscape-scale remediation improves water quality of an alluvial gully 877
3.3 Particulate and dissolved nutrients
Three opportunities occurred during the study period (24 Jan-
uary 2018, 15 December 2018, and 5 February 2019) where
samples were able to be retrieved from the remote sampling
site within a time frame that allowed them to be processed
(i.e. refrigerated, and samples filtered and frozen within 48 h
of collection) and analysed. A total of 40 samples were col-
lected from the remediated (n = 14) and control (n = 26)
gullies for nutrient analysis. The hydrographs and SSC trends
of these sampling events indicate they were representative of
the other flow events observed in the two gullies (Sect. S3)
and provide enough data for a preliminary assessment of nu-
trient transport trends within the gullies. Note, the SSC of
these samples were likely underestimated by ∼ 15 % because
they were analysed using the total suspended solids (TSSs)
analysis method rather than the SSC method (Gray et al.,
2000).
The bulk of total organic carbon and nutrient (nitrogen
and phosphorus) concentrations, for both gullies, consisted
of particulate fractions (Fig. 10). Organic carbon and nutri-
ent concentrations of samples collected from the remediated
gully were significantly lower than control gully samples for
both dissolved and particulate fractions, except for dissolved
organic carbon and nitrogen during the 2018/19 wet season
(Table S10; Fig. 10).
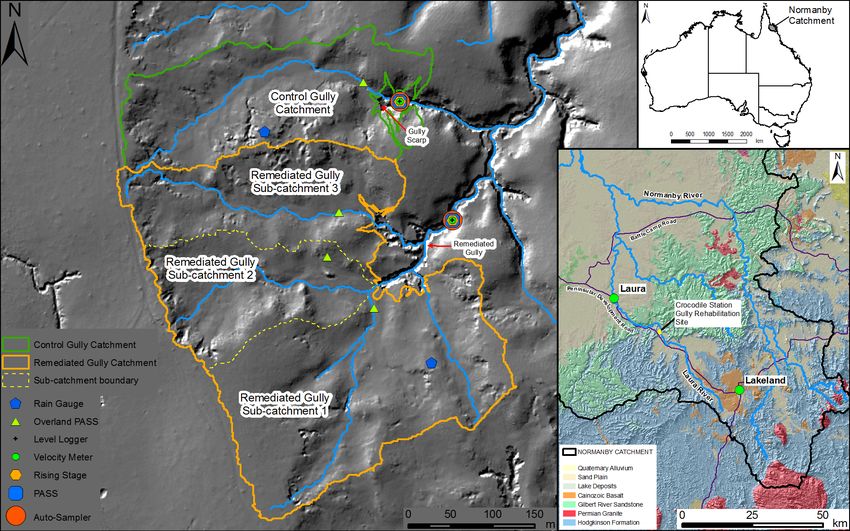
Figure 9. Average PSDs of PASS samples collected from the reme- Dissolved nutrients are influenced by numerous biogeo-
diated gully (blue) and catchments (orange, yellow, and black) and
chemical processes that occur in the catchment and the gully,
control gully (brown) and catchment (purple) suspended sediment
PSD frequency plots during the 2018–2019 wet season. Shading
with some of these processes occurring rapidly (i.e. instantly
around gully PSDs represents the error as a standard deviation. or within several minutes) and significantly altering nutri-
ent chemical speciation (Garzon-Garcia et al., 2015, 2016b;
Lloyd et al., 2019). We do not currently have sufficient infor-
from the outlet of the remediated gully (d50 of 5.84 µm) and mation to investigate the effect these processes have on dis-
samples collected from Catchment 2 (d50 of 5.52 µm) and solved nutrient trends occurring in the gullies and their catch-
3 (d50 of 5.06 µm) of the three catchment areas draining into ments, thus, our interpretation of this data will be limited.
the gully were very similar, thus suggesting their sediment However, particulate nutrients and carbon are more stable,
contributions would be similar, when normalised for differ- taking days or weeks to undergo large changes due to bio-
ences catchment area size (Table 3; Fig. 9). The lack of sim- geochemical processes once initial leaching of soluble com-
ilarity in suspended sediment PSD characteristics between ponents has occurred (Garzon-Garcia et al., 2018a; Water-
the remediated and control gullies outlets, and similarity in house et al., 2018). Therefore, we can assume that the partic-
the PSD of the remediated gully and its catchments, indi- ulate nutrients are relatively stable and representative of their
cates gully subsoil (i.e. sand and coarse silt) is no longer a source when sampled from the gully outlet.
significant source of the suspended sediment flowing from For the samples collected during flow events on 23 Jan-
the remediated gully. It also indicates that the dominant PSD uary 2018, the SSC and particulate nutrient concentrations
component of fine suspended sediment (i.e. clay and silt) showed a significant correlation in the control gully (r = 0.68
in the remediated gully is now primarily sourced from the to 0.78; p < 0.01), whereas there was no significant correla-
gully catchments. This finding supports the key conclusions tion (r = 0.23 to 0.48; p > 0.05) between SSC and particu-
of the recent review conducted by Bartely et al. (2020), which late nutrient concentrations in the remediated gully (Fig. 11;
found that remediation of both the gully and its catchment(s) Sect. S10). The strong positive relationship between SSC and
will generate a more immediate and effective reduction in nutrient concentrations in the control gully supports the hy-
sediment yield than remediation of the gully alone. pothesis that erosion processes within the gully are acting
as the dominant source of suspended sediment and particu-
late nutrients. In contrast, the poor relationship between SSC
and nutrient concentrations in the remediated gully is likely
due to the much lower rates of gully erosion at this site,
https://doi.org/10.5194/hess-25-867-2021 Hydrol. Earth Syst. Sci., 25, 867–883, 2021878 N. J. C. Doriean et al.: Intensive landscape-scale remediation improves water quality of an alluvial gully
Figure 10. SSC and nutrient concentrations of samples collected during flow events in the 2017–2018 and 2018–2019 wet seasons. Note that
the 2017–2018 data represent a single flow event, and the 2018–2019 data represent multiple flow events. Box plots represent the minimum,
maximum, 25th and 75th percentiles, median (horizontal line in box), and mean (cross). Brackets above the box and whisker plots represent
the results of paired t tests, where p < 0.001 (∗∗∗ ), p < 0.01 (∗∗ ), p < 0.05 (∗ ), or p > 0.05 (ns).
which limits the range of SSCs over which the relationship seek to investigate the specific sources of suspended sedi-
can be evaluated. It may also indicate multiple sources (i.e. ment and associated nutrients at the study sites.
sediment and detritus inputs from the catchment) are con-
tributing to particulate nutrient export. The remediated gully 3.4 Monitoring approach assessment
suspended sediment had a significantly higher nutrient pro-
portion by mass than that from the control gully (Sect. S11), The large investment in monitoring effort reported in this
consistent with the higher proportion of fine suspended sedi- study was necessary in order to properly assess the effect
ments observed in the remediated gully, as a result of reduced of landscape-scale remediation on alluvial gully water qual-
subsoil erosion effects (Fig. 8; Horowitz, 2008). Reliably dif- ity and to test the effectiveness of the different monitoring
ferentiating fine suspended sediment and associated nutrients methods. It is imperative that environmental managers apply
sourced from either the catchment or the gully itself is chal- robust monitoring plans when conducting gully erosion con-
lenging without dedicated sediment tracing data (e.g. stable trol measures to ensure that their effectiveness is appropri-
or radioisotopes, biomarkers), and/or a distributed network of ately evaluated. This study identified the following important
event samplers within the catchment. Despite this, our PSD factors to consider when implementing a gully water quality
data is consistent with a dominant catchment source of sus- monitoring plan:
pended sediment and particulate nutrient sources in the reme-
diated gully. In contrast, the significant relationships between 1. The combination of a small number of high-cost mon-
SSC and particulate nutrients in the control gully demon- itoring methods (i.e. autosamplers) complemented by
strates that eroding subsoil was likely a major source of par- low-cost automated methods (i.e. RS and PASS sam-
ticulate nutrients in the control gully. Future work should plers) allows for both redundancy and more representa-
tive data collection at key monitoring locations, such as
Hydrol. Earth Syst. Sci., 25, 867–883, 2021 https://doi.org/10.5194/hess-25-867-2021N. J. C. Doriean et al.: Intensive landscape-scale remediation improves water quality of an alluvial gully 879
Figure 11. Relationships between SSC and particulate organic carbon and nutrient concentrations in the control (brown) and remediated
gully (blue) from single flow events on the same day during 2017–2018 wet season.
gully outlets. For example, the PASS sampler collected 2. The application of low-cost methods (e.g. the PASS
samples from events that occurred after the RS and au- sampler) allows for the establishment of a wider spa-
tosamplers were at capacity, the RS samplers provided tial monitoring network. In this study, the PASS sam-
important information on in-stream suspended sediment pler was deployed at several monitoring locations, in
heterogeneity over the rising stage, and the autosampler both gully catchments and outlets, which would com-
provided important discrete sample data used to evalu- monly not be a feasible approach with the other runoff
ate suspended sediment dynamics (e.g. SSC and water- monitoring methods.
level hysteresis).
3. A complete conceptual model of potential inputs and
outputs of a gully should be established before monitor-
https://doi.org/10.5194/hess-25-867-2021 Hydrol. Earth Syst. Sci., 25, 867–883, 2021880 N. J. C. Doriean et al.: Intensive landscape-scale remediation improves water quality of an alluvial gully
ing begins. Failure to do so could lead to inconclusive mental design, carried out field work, interpreted the results, and
results and a poor evaluation of gully remediation ef- assisted with the preparation of the paper.
fectiveness. For example, the lack of catchment data for
the 2017–2018 wet season needed to be addressed for
the following wet seasons in order to account for all the Competing interests. The authors declare that they have no conflict
potential influences acting on the suspended sediment of interest.
dynamics occurring in the gullies.
Acknowledgements. The authors acknowledge the traditional own-
4 Conclusion ers of the country in which this study was conducted. We thank
the Laura Ranger group for their support throughout the field-
The water quality data collected during this study, using mul- monitoring component of this study. We also thank William Higham
tiple monitoring methods, support the application of inten- and Michael Goddard, from Cape York Natural Resource Manage-
sive landscape-scale remediation to significantly reduce sus- ment, for giving us the opportunity to collaborate with them on-site
at Crocodile Station. The authors also acknowledge the Managers
pended sediment concentrations in actively eroding gullies.
of Crocodile Station, Roy and Karlene Shepherd.
This is accompanied by the added benefit of significant re-
ductions in nutrient (nitrogen and phosphorus) and carbon
concentrations in gully discharge. The findings from this
Financial support. Funding for this study was provided by the Aus-
study, regarding the longevity of the erosion mitigation con- tralian Government National Environmental Science Programme
trols used as part of the gully remediation works, are con- under Project 3.1.7 – Effectiveness of Alluvial Gully Remediation
sidered to be preliminary, pending the results of monitoring in Great Barrier Reef Catchments. The Queensland Water Mod-
data collected from the site over longer timescales (i.e. semi- elling Network also provided funding for the nutrient analysis com-
decadal to decadal). Development of gully flow velocity or ponent of this study.
discharge measurement capabilities should be conducted to
address the current limitations of discharge measurements in
these, often remote, locations. Future studies should also in- Review statement. This paper was edited by Christian Stamm and
vestigate the speciation of particulate and dissolved nutrients reviewed by Simon Walker and two anonymous referees.
in remediated and active alluvial gully systems to better un-
derstand the effects of landscape-scale gully remediation on
the reduction of bioavailable nutrient export.
References
Code availability. The data that support the findings of this study
Ayele, G. K., Addisie, M. B., Langendoen, E. J., Tegegne, N. H.,
are available from the corresponding author upon reasonable re-
Tilahun, S. A., Moges, M. A., Nicholson, C. F., and Steenhuis,
quest.
T. S.: Evaluating erosion control practices in an actively gullying
watershed in the highlands of Ethiopia, Earth Surf. Proc. Land.,
43, 2835–2843, https://doi.org/10.1002/esp.4436, 2018.
Data availability. The data that support the findings of this study Bartley, R., Bainbridge, Z. T., Lewis, S. E., Kroon, F. J., Wilkin-
are available from the corresponding author upon reasonable re- son, S. N., Brodie, J. E., and Silburn, D. M.:. Relating sediment
quest. impacts on coral reefs to watershed sources, processes and man-
agement: a review, Sci. Total Environ., 468, 1138–1153, 2014.
Bartley, R., Hawdon, A., Henderson, A., Wilkinson, S., Goodwin,
Supplement. The supplement related to this article is available on- N., Abbott, B., and Telfer, D.: Quantifying the effectiveness
line at: https://doi.org/10.5194/hess-25-867-2021-supplement. of gully remediation on off-site water quality: preliminary re-
sults from demonstration sites in the Burdekin catchment, NESP
Project 2, no. 4, Report to the National Environmental Sci-
Author contributions. NJCD designed the experiments, carried ence Programme, Reef and Rainforest Research Centre Limited,
them out, did the sample and data analysis, investigated the data, Cairns, 76 pp., 2017.
and prepared the paper with contributions from all co-authors. Bartley, R., Thompson, C., Croke, J., Pietsch, T., Baker, B., Hughes,
WWB provided guidance in the experimental design, method de- K., and Kinsey-Henderson, A.: Insights into the history and tim-
velopment, and interpretation of results and assisted with the prepa- ing of post-European land use disturbance on sedimentation rates
ration of the paper. JRS provided assistance in the method develop- in catchments draining to the Great Barrier Reef, Mar. Pol. Bult.,
ment, carried out field work, and interpreted the results. AGG and 131, 530–546, 2018.
JMB provided sample and data analysis, interpreted the results, and Bartley, R., Poesen, J., Wilkinson, S., and Vanmaercke, M.: A re-
assisted with the preparation of the paper. PRT and DTW provided view of the magnitude and response times for sediment yield re-
the interpretation of results and assisted with the preparation of the ductions following the rehabilitation of gullied landscapes. Earth
paper. APB provided supervision, offered guidance in the experi- Surf. Proc. Land., 45, 3250–3279, 2020.
Hydrol. Earth Syst. Sci., 25, 867–883, 2021 https://doi.org/10.5194/hess-25-867-2021You can also read