Georgica Pond Water Quality Restoration Action Plan - East ...
←
→
Page content transcription
If your browser does not render page correctly, please read the page content below
Georgica Pond Water Quality
                     Restoration Action Plan

               East Hampton, Suffolk County, New York

Prepared By:                          Sara Davison
                                      Executive Director
                                      Friends of Georgica Pond Foundation
                                      www.friendsofgeorgicapond.org

                                   ___Dr. Christopher Gobler
                                      Endowed Chair of Coastal Ecology and Conservation
                                      Stony Brook University
                                      you.stonybrook.edu/goblerlab/

                                     Date: April 2021

               Action Plan Approved by East Hampton Trustees April 26, 2021

                 Additional participants involved in plan development include:
         Town of East Hampton, Village of East Hampton, East Hampton Town Trustees,
            Stony Brook University, and Friends of Georgica Pond Foundation, Inc.
Table of Contents

Table of Contents ............................................................................................................................ 1
1.     Purpose .................................................................................................................................... 1
2.     Setting ...................................................................................................................................... 1
3.     History of Pond & Pond Openings .......................................................................................... 3
4.     Endangered Species and Aquatic Communities ...................................................................... 6
     4.1.      Endangered Species.......................................................................................................... 6
     4.2.      Aquatic Vegetation ........................................................................................................... 7
     4.3.      Finfish............................................................................................................................. 12
     4.4.      Invertebrates ................................................................................................................... 12
     4.5.      Plankton Community...................................................................................................... 13
5.     Recreation .............................................................................................................................. 15
6.     Commercial Fishing .............................................................................................................. 16
7.     Pollution and Nutrient Source Analysis ................................................................................ 16
8.     Continuous monitoring of Georgica Pond ............................................................................. 22
     8.1.      USGS Pond Level Monitoring Gage .............................................................................. 23
     8.2.      Microbial Source Tracking............................................................................................. 25
9.     Phragmites australis .............................................................................................................. 25
10.         Management Objectives & Pond Opening Decision Making Context .............................. 26
11.         Management Plans Beyond Pond Openings ...................................................................... 30
     11.1.        Septic Upgrades .......................................................................................................... 30
     11.2.        Maintenance Dredging ............................................................................................... 32
     11.3.        Fine Sediment Dredging ............................................................................................. 33
     11.4.        Aquatic Plant and Macroalgae Harvesting ................................................................. 35
     11.5.        Natural Vegetation Buffers ......................................................................................... 37
     11.6.        Reduction of Fertilizer Use......................................................................................... 39
     11.7.        Storm Water Runoff ................................................................................................... 40
     11.8.        Land Acquisition ........................................................................................................ 40
     11.9.        Mute Swans ................................................................................................................ 41
     11.10.       Climate Change .......................................................................................................... 41
12.         Future Research ................................................................................................................. 42
13.         References .......................................................................................................................... 43
14.         Appendices ......................................................................................................................... 46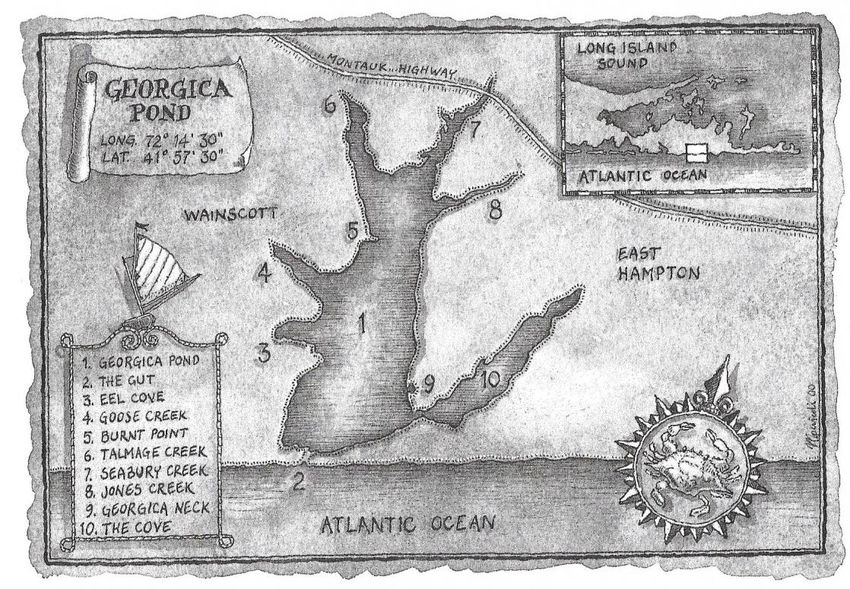
List of Figures
Figure 1. Relative Submerged Aquatic Plan Density at 80 locations throughout Georgica Pond.
Figure 2. Distribution of Sago Pondweed throughout Georgica Pond.
Figure 3. Comparison of algal biomass levels present in Georgica Pond in 2015 and 2018.
Figure 4a. A comparison of blue-green algal biomass levels present in 2015, 2016, 2017, & 2018.
Figure 4b. Continuous blue-green algae concentrations (µg/L) taken from a monitoring buoy in
Georgica Pond from 2015 – 2019.
Figure 5. Gobler Independent Hybrid Nitrogen Loading Model
Figure 6. Gobler Independent, Hybrid Phosphorus Loading Model
Figure 7. Telemetry water quality buoy installed April through November 2015 – 2019.
Figure 8 USGS Pond Level Telemetry Gage
Figure 9. 10-year record of water level in Georgica Pond
Fig 10. An aerial photo from 2015 showing the gut which opened naturally on land owned by
the Georgica Association west of the Trustee’s parcel (thin rectangle). Note extensive sand
shoals within the pond.
Figure 11. Sediment composition of Georgica Pond and thickness of muds (Gobler, 2015)
Figure 12. Summer minimum dissolved oxygen in Georgica Pond, 2013 - 2019
Figure 13. Blue-green algae levels in Georgica Pond, 2014-2019
Figure 14. A newly planted buffer of native species on Georgica Cove.
Figure 15. The same area, the following year, June, 2017
Figure 16. A well-established native plant buffer on the west shore of Georgica Pond

List of Maps
Map 1. Names of Creeks feeding Georgica Pond
Map 2 1873 showing Burnt Point Bridge
Map 3. 1902. Burnt Point Bride is gone
Map 4. East Hampton water protection districts for Georgica and Wainscott Ponds.
Map 5. Groundwater travel time map provided by Suffolk County Subwatershed Wastewater
Plan.
List of Tables
Table 1. Characteristics of Georgica Pond and its watershed, data from East Hampton Town
Wide Wastewater Management Plan. Lombardo Assocations, Inc. 2015.
Table 2. Georgica Pond Beach Nesting Shorebirds, data from Natural Resources Department,
Town of East Hampton
Table 3. Macrophyte Harvest at Georgica Pond, data from Friends of Georgica Pond Foundation
1. Purpose

       The purpose of this plan is to outline a process to restore the water quality of Georgica

Pond. Recent blue-green algae blooms that have forced the seasonal closing of the pond to fishing,

crabbing and recreation, low dissolved oxygen levels, and fish kills have all plagued Georgica

Pond during the past five years. This plan collects known data and current research on the pond

pertinent to water quality, indigenous organisms, and ecosystem function and provides user groups

and governing bodies an action plan to improve conditions within the pond. This plan will also

serve to meet the requirements of the New York State Department of Environmental Conservation

(DEC) and the US Army Corp of Engineers (ACOE) for their issuance of maintenance dredging

permits and provide a context for traditional pond openings by the East Hampton Town Trustees.

It is expected that this plan will continue to evolve as new information is available and results from

ongoing research and management become clear. Regular updates to the plan will be made.

2. Setting

       Georgica Pond is a 290- acre coastal salt pond or lagoon (New York Natural Heritage

Program, 2015) located in East Hampton Village and East Hampton Town, Suffolk County, New

York. It perches on the Atlantic Ocean at Latitude: 40०55’53.5” and Longitude 72०13’47.8”. The

pond’s bottomlands and inlet are owned and managed by the East Hampton Town Trustees. The

pond is fed by groundwater within a watershed of approximately 4,000 acres. Approximately 59%

of the watershed is developed with low density residential development (approximately 2,000

homes) as well as the business district of Wainscott, some industrial development (East Hampton

Municipal Airport, a cement plant, and storage and landscaping companies), farmland and two

regional schools. One third of the watershed is undeveloped including a large area of protected

                                                                                                    1
pine barrens forest around the East Hampton airport and 8% of the watershed is water. The pond

and its immediate area is cited by the New York Department of State in their 2010 publication:

East Hampton Scenic Areas of Statewide Significance and Georgica Pond has been designated a

locally significant Coastal Fish & Wildlife Habitat by the East Hampton Local Waterfront

Revitalization Plan.

        The political jurisdiction of the pond is complex with the eastern shoreline within the

Village of East Hampton and the western shoreline within the Town of East Hampton. In addition,

certain, regulatory bodies including the NYS Department of Environmental Conservation, Suffolk

County Department of Health Services and the US Army Corp of Engineers may require approvals

for differing activities within the pond and/watershed. To facilitate collaboration and cooperation

among these sundry groups, a “Georgica Pond Steering Committee” has been created including

East Hampton Town, East Hampton Village, the East Hampton Town Trustees plus Stony Brook

University, the Friends of Georgica Pond Foundation and the Nature Conservancy.

       Some watershed characteristics are provided in Table 1. (Lombardo Associates, Inc., 2015)

                                                                                                 2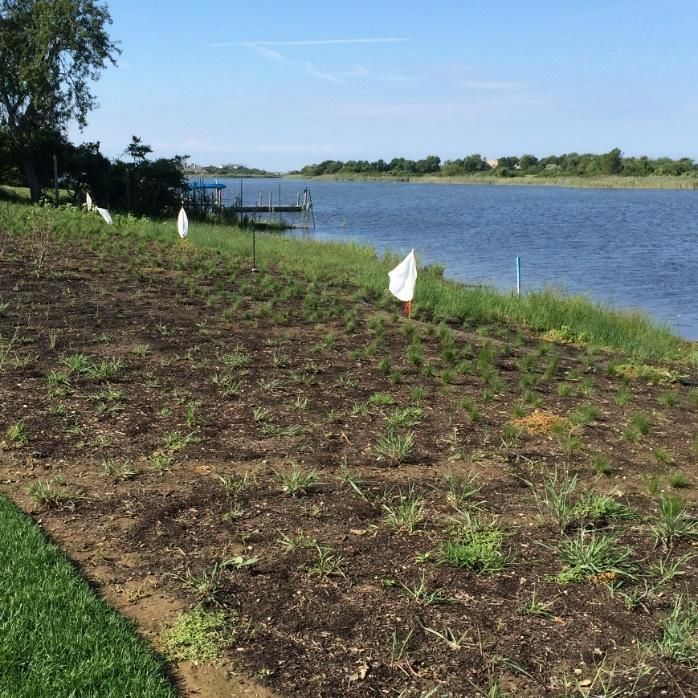
Map 1. Names of Creeks feeding Georgica Pond

                    Table 1. Characteristics of Georgica Pond and its watershed.
                                                Georgica Pond & Watershed
                                                                                                       Wastewater
                                                                          Pond
                                                                                   Design Groundwater    as % of
                                                                        Shoreline
             No of Properties              Total Area (acres)                     wastewater from rain Groundwater
                                                                         Length
                                                                                     flow      (gpd)    Flow from
                                                                           (ft)
                                                                                                           rain
 Region Dev      Undev     Total    Dev     Undev     Water     Total
   Town 1,111     312      1,423   1,813    1,187      294      3,293    14,216
  Village 224      78       302     511      141        10       663     30,700
   Total 1,335    390      1,725   2,324    1,328      304      3,956    44,916   574,892   5,977,015    9.62%
 Percent 77%      23%              59%       34%       8%

3. History of Pond & Pond Openings

       Historically, Georgica Pond has been opened to the Atlantic Ocean by the East Hampton

Town Trustees, two or three times per year. The traditional fall opening is in October and the

spring opening, which often occurred in April, has been moved to March to avoid all conflict with

the federally threatened piping plover (see section 6). This practice is based on observations by

colonial settlers who according to A Poose and its Neighbors: Episodes from the History of

                                                                                                                 3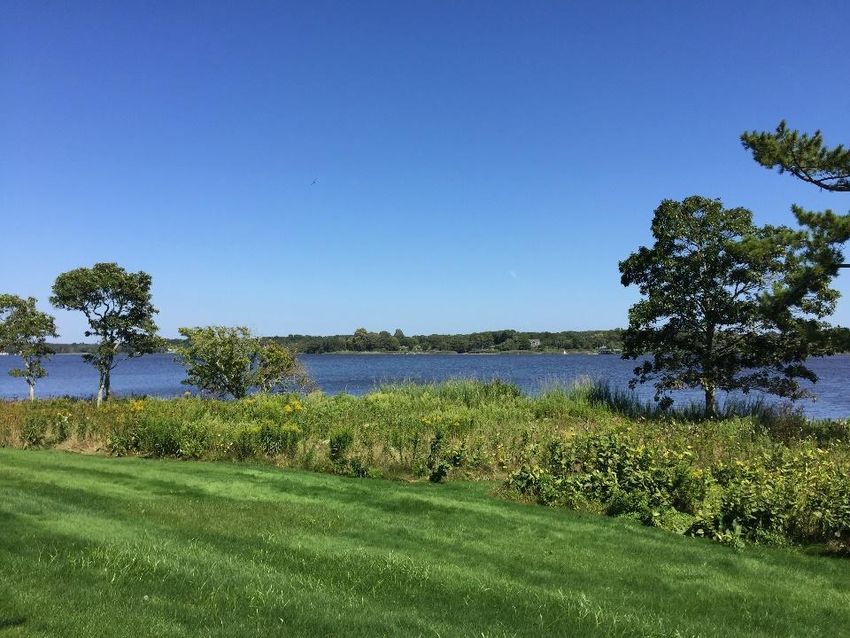
Georgica Pond and its Bar (Pierson, 1992) observed Native Americans digging out Georgica Pond

with clam shells when “the ponds were full and fish were running up or down the coast. They had,

as it were, discovered a seasonal food supply and used these brackish ponds to trap it.” The English

colonists continued this practice using shovels or draft animal to open the pond. Today, it is opened

using a mechanical backhoe.

       The evidence of the regular opening of ponds by the East Hampton Town Trustees is

supported in the Trustee records and historical maps. Trustee records mainly between 1870 and

1925 mention that the beaches opposite the inlets of Georgica and Hook Ponds were to be

restricted and reserved for the purpose of draining the ponds. (Our emphasis) (East Hampton

Town Trustees Records, 1870-1925). More recent records of the Trustee openings of the pond are

provided in Appendix I.

       The pond also opens on its own through forces of nature including wind, storms and high

tides as it does to this day. A sad notice in the Records of the Town of East-Hampton (1905) states

“1714 Feby 5. Three young men getting fish when Georgike pond was out (tis supposed), coming

home over the gut with the canoe were carried into the surf and drowned, viz: Joseph Earle, that

lived with Joseph Stretton. Zebedee, son of Th. Osborn of Wainscott. John, eldest son of Matthias

Hoppin.”

       The fishing in the pond was of significant economic importance to the early settlers so

much so that they were prepared to go to court over the fishing rights. On page 8 of the East

Hampton Town Trustees’ records, 1826-1845, it says that in 1833, “Southampton men took fish

with a seine in Georgica Pond, and the Trustees resolved to prosecute; they also decided to defend

all townsmen granted permission to draw seines by the Trustees, who might be prosecuted by

Southampton men or owners of land bordering the pond and who objected to East Hampton men

                                                                                                   4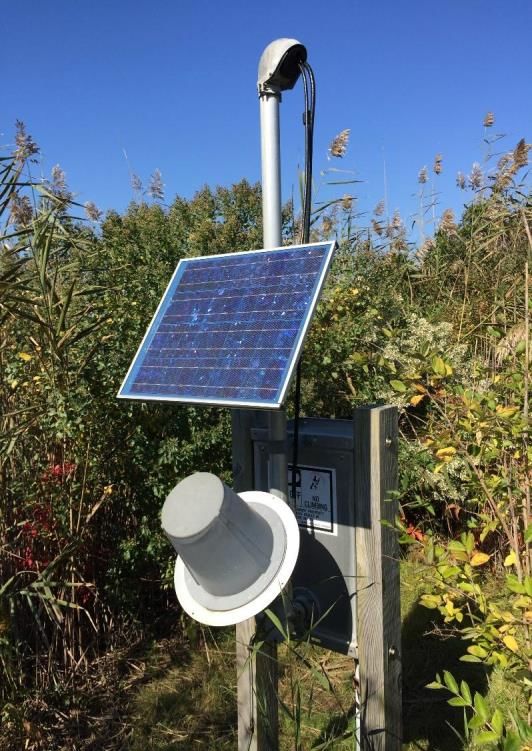
fishing in the pond and cove. Riparian rights were investigated.” On page 66 it goes on to say,

“The trustees met…and agreed to institute a suit against Stephen Topping and others of the Town

of Southampton for drawing a seine in Georgica Cove and pond contrary to an ordinance of this

town passed the third day of May 1813.”

   Over the centuries, there have been only minor changes to Georgica Pond’s drainage and form.

Surrounding woodland succumbed to farmland which has largely transitioned to low density

residential development. A review of historical maps reveals only a few infrastructure changes of

any note:

   1. The building of Montauk Highway (Rt. 27) which crosses Talmage Creek, Seabury Creek

       and Jones Cove at the north end of the pond.

   2. A bridge at Burnt Point the narrowest part of the pond shown on a map from 1873 was

       gone by the time a map was printed in 1902 (see maps 2 & 3).

   3. The building of four groins in the 1960s to the east of the pond by the Army Corp of

       Engineers and New York State has had the most significant impact on the pond’s coastal

       processes by intercepting the westerly moving littoral drift.

   4. The addition of a storm drain which originates at Rt. 114 and flows into Georgica Cove.

                                                                                                5
Map 2 1873 showing Burnt Point Bridge Map 3. 1902. Burnt Point Bride is gone
4. Endangered Species and Aquatic Communities
4.1. Endangered Species
Both the federally threatened and state endangered Piping Plover (Charadrius melodus)
and the state threatened Least Tern (Sterna antillarum) nest on the sandy beach and dune edge on
the Atlantic Side of Georgica Pond. The intertidal mud and sand flats of the pond provide feeding
habitat. These populations are managed by the East Hampton Town Department of Natural
Resources under the auspices of the East Hampton Management & Protection Plan for Threatened
and Endangered Species (Town of East Hampton, 2015). The following table with data compiled
by the East Hampton Town Natural Resources Department shows the last eleven years of nesting
pair data. Diligent work by the Town Natural Resources Department has resulted in this increasing
trend.
6Table 2. Georgica Pond Beach Nesting Shorebirds
Piping Least
YEAR Plover Tern
Pairs Pairs
2010 2 81
2011 4 NS
2012 4 23
2013 3 5
2014 2 22
2015 3 24
2016 6 48
2017 6 60
2018 6 ?
2019 7 48
2020 3 35
A nesting pair of the New York State threatened Bald Eagles (Haliaeetus leucocephalus) was
documented at the pond in 2019. A large pitch pine (Pinus rigida)on a privately-owned house lot
served as the nest tree. At least one chick successfully fledged. Successfully fledging was not
documented in 2020. Protection of vegetated buffers and large trees near the pond is essential for
their persistence at the pond.
4.2. Aquatic Vegetation
The submerged aquatic plant community of Georgica Pond is comprised of sago pondweed
(Stuckenia pectinata), filamentous green algae (Cladophora vagabunda), and clasping leaf
pondweed (Potamogeton perfoliatus). Sago and clasping leaf pondweed are rooted perennial
aquatic plants; Cladophora vagabunda is a green algae that establishes attached to the substrate
via a holdfast, but may break from the substrate and persist as massive free-floating mats (up to
0.5m thick) in the water column. Free-floating Cladophora may settle in rooted stands of sago
pondweed.
7The plant density and species composition in Georgica Pond varies annually based on
meteorological conditions and the condition of the pond’s inlet. Plant density also varies annually
and spatially from low-density conditions, i.e. sparse or occasional widely spaced shoots, to high-
density conditions where biomass densely fills the water column. Density of submerged aquatic
plants and macroalgae has typically been greatest in the sheltered creeks in the freshwater
headwaters of Georgica Pond and Georgica Cove, with lower density observed in the more
dynamic, mineral substrate of the nearshore and deepwater zones of the main basin.
Stands of submerged aquatic plants begin to develop early in the growing season (late
April), but do not become well-developed until early June when warmer water temperate supports
higher growth rates. As the summer progresses, warm temperatures and an abundance of nutrients
support high growth rates and biomass accumulation of Cladophora and sago pondweed. During
peak accumulation, sago pondweed shoots may fill the water column and then grow laterally along
the water surface. Stony Brook University reported dense plant growth would foul the propeller
of the small outboard motor on their skiff used for environmental monitoring. In 2014-2015, dense
masses of Cladophora were observed throughout Georgica Pond.
Descriptions of the species composition of the submerged aquatic plant community are
based on observations from 2014-2018, observations of harvested biomass in 2016-2018, and
monitoring in 2019. Cladophora was dominant in Georgica Pond in 2014-2015, both years with
abundant spring precipitation and early closures of the pond inlet. Sago pondweed dominated the
submerged aquatic plant community in 2016-2018, perhaps due to less abundant rainfall and lower
pond water level and control of Cladophora via harvester. In 2016, Cladophora was the second
most abundant plant to sago pondweed, while clasping leaf pondweed was second most abundant
8in 2017 and 2018. The pond inlet remained open for nine months from October 22, 2018 to July
25, 2019—perhaps the longest documented opening of the pond. Submerged aquatic plant
densities were anecdotally much lower in 2019 compared to previous years with sparse and trace
densities of sago pondweed observed throughout much of the pond and various marine algae
present including Ulva lactuca, Enteromorpha sp., and Ulva intestinalis.
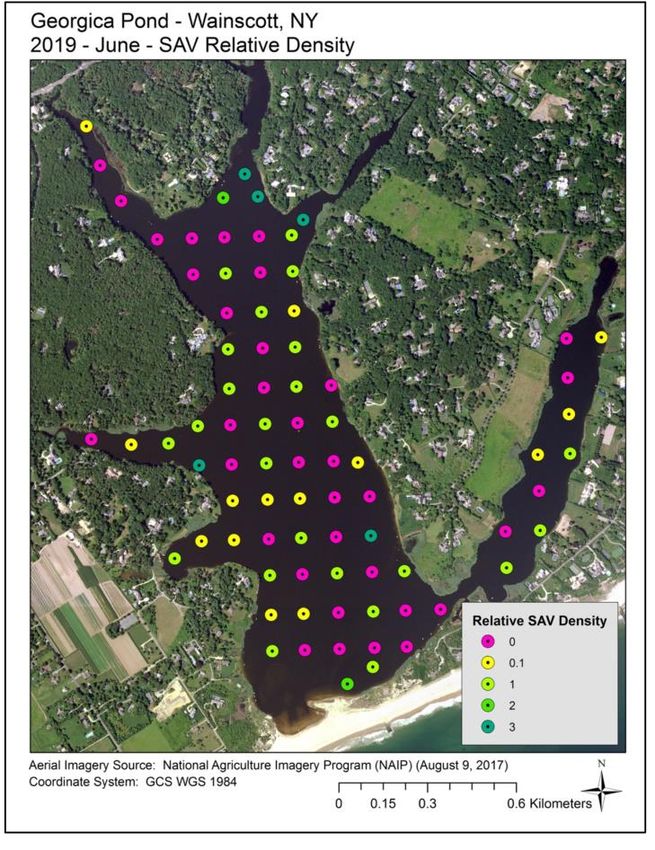
In June 2019, the submerged aquatic plant density was quantitatively evaluated using a
double-sided rake at 80 locations throughout Georgica Pond. The submerged aquatic plant density
was relatively evenly distributed throughout Georgica Pond with 61.25% of sites yielding no to
trace amounts of submerged aquatic plants and 30% of sites yielding plants filling less than 25%
of the rake. Only 8.75% of sites yielded plants filling 25 to 100% or more of the rake; these sites
tended to be located within the creeks draining into Georgica Pond. Sago pondweed was observed
at 31.25% of sampling locations. Ulva lactuca was observed at 26.25% of sampling locations and
Cladophora vagabunda was observed at 10% of sampling locations.
Submerged aquatic plant density and species composition maps from 2019 prepared by
Stony Brook University are provided below (Figures 1, 2). Monitoring of the submerged aquatic
plant community in Georgica Pond will continue in future growing seasons.
9Figure 1. Relative Submerged Aquatic
Plan Density at 80 locations throughout
Georgica Pond.
Figure 2. Distribution of Sago
Pondweed throughout Georgica Pond.
10Submerged aquatic plant beds provide important ecological functions and benefits.
Submerged aquatic plant beds provide shelter for forage fish and juvenile fish, and serve as
substrate for eggs for demersal-laying species. Submerged aquatic plant beds may serve as
substrate for the epiphytic growth of algae and grazing habitat for microinvertebrates. Biological
sampling by Stony Brook University indicates that various invertebrates utilize Georgica Pond’s
submerged aquatic vegetation beds as habitat including gamarid amphipods, damselfly nymphs,
snails such as minute hydrobia (Hydrobia totteni), caddisfly larvae, and isopods including
Cyanthus polita and Idotea phosphorea. Blue crabs use submerged aquatic plant beds as forage
and nursery grounds for juvenile crabs and shelter during mating and molting. The starchy tubers
of Sago pondweed are an important food resources for breeding and overwintering waterfowl.
Submerged aquatic plants have direct and indirect effects on harmful algae blooms and
water quality parameters (such as dissolved oxygen and nutrient concentrations). Substrate within
submerged aquatic plant beds may influence phytoplankton assemblages by serving as substrate
for seeding or initiating blooms of phytoplankton or habitat for phytoplankton grazers. Submerged
aquatic plant beds are also important components of the nutrient cycles in water bodies, both
uptaking nutrients from water column and substrate and releasing nutrients to the water column
upon senescence. Decomposition of senescenced submerged aquatic vegetation in late summer
may release/increase biologically available nutrients, thereby fostering harmful algae blooms, and
may consume dissolved oxygen adversely impacting fish communities and increasing the
likelihood of fish kills.
114.3. Finfish
Finfish species that utilize Georgica Pond’s submerged aquatic plant beds have been
monitored and inventoried from 2016-2019 by the Gobler and Peterson laboratories of Stony
Brook University, SOMAS (Appendix II). Bycatch and beach seine sampling data suggests that
these habitats are mostly utilized by relatively small, low trophic level finfish species including
silversides (Menidia menidia and Menidia beryllina), juvenile eels (Anguilla rostrata), killifish
(Fundulus diaphanous), fourspine stickleback (Apeltes quadracus), sheepshead minnow
(Cyprinodon variegatus), and mummichog (Fundulus heteroclitus). Northern pipefish
(Syngnathus fuscus), alewife (Alosa pseudoharengus), and rainwater killifish (Lucania parva) are
present at very low abundance. These fish provide prey for larger finfish, blue crabs, wading birds
and waterfowl. Predatory fish that forage for prey fish around the margins of submerged plant
beds include adult white perch (Morone americana) and summer flounder (Paralichthys dentatus).
4.4. Invertebrates
Additional invertebrate species that utilize Georgica Pond, per data collected by the Gobler and
Peterson Laboratories (Appendix II), include blue crabs (Callinectes sapidus), minute hydrobia
(Hydrobia totteni), grass shrimp (Palemonetes pugio), three different types of gamarid amphipods,
isopods (Cyanthus polita and Idotea phosphorea), damselfly nymphs, caddisfly larvae and pupae,
and a polychaete worm.
Blue Crab (Callinectes sapidus)
Blue crabs inhabit shallow estuarine and coastal waters, where they are an important ecological
and predatory species in salt marshes and seagrass (SAV) communities. Both overwintering and
12summer blue crabs were inventoried. No overwintering blue crabs were found using the blue crab
dredge during February and March of 2017. All crabs caught in summer were adult males and
appeared to have overwintered in the pond. No larval crabs were found in larval tows. Research
on where in the pond the adult blue crabs overwinter and how the population is sustained within a
temporarily open estuary is continuing.
4.5. Plankton Community
Annual studies indicate that the phytoplanktonic community of Georgica Pond is comprised
of green algae, cyanobacteria (blue-green algae), brown algae, and cryptophytes. Genre
identified in these studies are as follows:
Green algae: Scenedesmus, Chlamydomonas, Selenastrum, Pediastrum
Cyanobacteria: Microcystis, Anabaena, Aphanizomenen, Planktothrix,
Cylindrospermopsis, Synechococcus
Brown algae: Melosira, Navicula, Thalassiosira, Cocconeis, Fragilaria, Prorocentrum
Overall, total algal biomass levels have decreased since the initiation of harvesting in 2016
(Figure 3). Cyanobacteria abundance was an order of magnitude lower in each of the three years
of harvesting, compared to 2015 prior to harvesting (Figure 4). According to the 2018 Final
Report from the Gobler laboratory, in harvester years, cyanobacteria never bloomed to the extent
that it excluded other phytoplankton species.
Within each season, data suggests that relatively small cyanobacteria blooms tend to occur in
the late summer between August-September. While this seasonal trend still appeared present
during harvesting years, the total abundance of cyanobacteria was much lower than pre-harvest
years, allowing its coexistence with the several other types of phytoplankton listed above. In fact,
from 2016 to 2018 Georgica Pond exhibited some of the lowest levels of blue-green algae
13present in lakes and ponds throughout Suffolk County, while in 2014 to 2015 Georgica Pond had
the highest levels of blue-green algae throughout the County.
Figure 3. Comparison of
algal biomass levels
present in Georgica Pond
in 2015 and 2018.
Data from C. Gobler 2019
Final Report, Evaluation
of macroalgae and
aquatic plant harvesting
as a means for improving
water quality in Georgica
Pond (February 2019).
Figure 4a. A comparison of
blue-green algal biomass
levels present in 2015, 2016,
2017, and 2018. Data from
C. Gobler 2019 Final Report,
Evaluation of macroalgae
and aquatic plant harvesting
as a means for improving
water quality in Georgica
Pond (February 2019).
14Figure 4b.
Continuous blue-
green algae
concentrations
(µg/L) taken from a
monitoring buoy in
Georgica Pond from
2015 – 2019.
5. Recreation
Georgica Pond is a highly valued community resource. The Town of East Hampton
prohibits motorized boats with certain exceptions for research and baymen. Non-motorized
boating such as canoeing, kayaking, sailing, and paddle boarding is very popular in the summer.
Users often put in at the Route 27 rest stop and paddle to the ocean beach. Access points are
currently limited to two locations and efforts to preserve and improve those access points are on-
going. Sailing is also popular with the launch area at Eel Cove in the Georgica Association which
is available to Georgica Association members. Recreational crabbing for blue crabs occurs in
summer with baited lines laid out near the beach. Recreational fishing in the pond occurs to a
lesser degree. Recreational and commercial harvest of shellfish in Georgica Pond is prohibited by
NYSDEC due to elevated levels of potential pathogenic bacteria.
156. Commercial Fishing
In the last decade with the arrival of significant HABs and fish kills, the commercial fishing
at Georgica Pond has declined significantly. There are a handful of commercial fisherman who
still use the pond to catch bait fish, eels, and crabs when conditions are suitable. The pond is
closed to bivalve shellfishing by the NYSDEC.
7. Pollution and Nutrient Source Analysis
Dr. Christopher Gobler of Stony Brook University’s School of Marine and Atmospheric
Sciences (SOMAS) has been studying the water quality and sources of pollution at Georgica Pond
since 2013 as part of a town-wide water monitoring program funded by the East Hampton Town
Trustees. In 2015, his work was expanded to include real-time telemetry buoy monitoring and to
identify threats and make recommendations for remediation by the Friends of Georgica Pond
Foundation, Inc. His preliminary findings from 2014 - 2019 are provided in Appendix III.
Briefly, Georgica Pond currently suffers from an array of water quality and habitat
impairments. Since 2013, the Gobler Laboratory has documented a series of significant water
quality impairments in Georgica Pond including anoxia (no oxygen), fish kills, macroalgal blooms,
blue-green algal blooms, and elevated levels of the cyanotoxin, microcystin. These events worsen
during summer (July - September) and are most problematic during late August and into
September. As a result of blue-green algal blooms with elevated levels of cyanotoxins, Georgica
Pond has been sporadically closed for harvesting of blue crabs during late summer and fall.
Experimental investigations by the Gobler Laboratory have demonstrated that the growth
of the macroalgae Cladophora, blue-green algae, and other algae and phytoplankton in the pond
are all promoted primarily by excessive nitrogen but can be further promoted by the combination
16of nitrogen and phosphorus. Because the pond can vary in salinity from 2 to 30 PSU and because
groundwater is highly enriched in nitrogen but not phosphorus, the relative importance of nitrogen
and phosphorus is likely to change from month-to-month and season-to-season. With phosphorus
mostly likely to control primary producers when temperatures and salinity are low, and nitrogen
becoming more important when salinity and temperatures are higher. Given the dynamic nature of
this system, a management approach that seeks to restrict the delivery of both nitrogen and
phosphorus is warranted.
To support the development of a watershed-based management plan, nutrient budget
models have been developed by Dr. Gobler for both nitrogen and phosphorus and are provided in
Figures 5 & 6. The aerial extent of the Georgica Pond watershed was determined using Suffolk
County’s LiDAR elevation data, topographical maps demarking the surface watersheds (HUC 12),
and groundwater flow patterns, which have been previously found to generally follow hydraulic
gradients established by surface topography (Schubert, 1998).
The first model used to predict the total dissolved nitrogen input into the Georgica Pond
was the Nitrogen Loading Model (NLM) (Valiela et al. 1997). The model is available through the
Nitrogen load web-based modeling tool (nload.mbl.edu) described in Bowen et al. (2007) and used
in Bowen and Valiela (2004) and recently in Kinney and Valiela (2011b), among others. The NLM
uses information about land use in a defined watershed to predict both the amount of nitrogen that
is released into the watershed from various sources and how much of it ends up in a corresponding
waterbody. This model requires accurate land-use and land cover information, such as area of
agriculture, residential areas, and impervious surfaces as well as other environmental data gathered
from scientific literature, GIS data, USGS reports, the Town of East Hampton, and Suffolk County
17as described in Table 1. For this study, the model was updated to use constants and data specific
to Georgica Pond, East Hampton, and Suffolk County.
The NLM is a good fit for watersheds such as Georgica Pond that are a mix of residential,
forested, and agricultural lands. The NLM assumes that the primary transport mechanism for
nitrogen entering the bays from each watershed is ground-water flow. This assumption is
consistent with data available for the Georgica Pond as there is little inflow to the bay from streams
and geologically, Long Island is composed of unconsolidated sands that allow for relatively easy
transport of groundwater to coastal bays.18 The NLM assumes that all nitrogen entering the bays
from external sources originated from atmospheric deposition to the watershed, wastewater, or
fertilizer. This study also includes atmospheric deposition directly to the surface water of the Bays.
Valiela et al. (1997) validated this model by comparing its nitrogen load prediction to empirically
measured nitrogen levels. They found the NLM’s results to be statistically indistinguishable from
measured concentrations and that a linear relationship exists between the percent contributions
from wastewater that the NLM predicted and the stable isotope signature for wastewater expected
from known isotopic nitrogen values of nitrate in groundwater. The NLM is one of the most
inclusive nitrogen loading models regarding the transformation and transport of nitrogen as it
travels from watershed to estuaries (Bowen & Valiela, 2001). The NLM utilizes multiple features
within the model for each subwatershed; these features include: number of buildings; buildings
within 200 meters of shore; surface area of the subwatershed; area of freshwater wetlands;
agriculture; golf courses; parks and athletic fields; freshwater ponds; and, impervious surfaces,
and were obtained from the Town of East Hampton and Suffolk County. The model also includes
a list of inputs assigned default values based on an extensive metadata analysis (Table 1; Valiela
et al., 1997). These model defaults were changed when local and site-specific information were
18available. For example, a recent study by Young et al. (2013) of denitrification in Long Island’s
aquifer, found that the 15% of nitrogen in groundwater is denitrified rather than the 35% assumed
by Kinney and Valiela (2011b). The NLM has a 12% standard error coefficient (Valiela et al.,
1997). Specific details of the NLM followed Gobler and Stinette (2016).
A Volumetric Flux Model (VFM) was created to predict nitrogen and phosphorus loads to
the bays based on the volume of water that discharges from the watershed into the bay and the
nitrogen concentrations in groundwater, streams, and runoff within the watershed. The VFM has
been used successfully to predict nitrogen loads to several Long Island estuaries, bays, and harbors
including West Neck Bay on Shelter Island, North Sea Harbor in Southampton, and Flanders Bay
in Riverhead (Gobler & Sañudo-Wilhelmy, 2001; Gobler & Boneillo, 2003; Koch & Gobler, 2009). This
model relies on the assumption that groundwater discharge to the bay is equal to the recharge of
the aquifer. In contrast to the NLM, which breaks down the nitrogen load into sources (i.e.
wastewater v. fertilizer), the VFM differentiates nitrogen inputs by transport mechanism: stream
flow, surface runoff, or groundwater flow. The methods used here largely followed those of Gobler
and Stinette (2016).
The NLM and VFM were combined along with additional information to create an
independent hybrid model. Specifically, benthic fluxes were added to the model based on the
methods of Gobler et al. (2001) with sediment cores collected during multiple seasons and the
precise flux of nutrient from the cores incubated under ambient conditions quantified. Bird inputs
were estimated as per Fleming and Fraser (2001).
With regard to nitrogen loading to Georgica Pond (Figure 5) it was found that the majority
of nitrogen entering the Pond (50%) emanates from septic tanks and cesspools of the more than
2,000 homes within the Pond’s watershed. Sediments were estimated to be the second largest
19source of nitrogen, representing 22% of the total load of this element. Sediment analyses confirmed
this finding as about 80% of the pond bottom is comprised of muddy sediments with a high level
of organic matter (up to 13% by mass). Atmospheric deposition represented a significant portion
of the total nitrogen load to the pond (21%). Much of this load was to the 2,500-hectare watershed
(17%) and then was delivered to the Pond while a smaller fraction was deposited directly into the
Pond (4%). Fertilizer represented a small fraction of the total nitrogen load to the Pond (5%) with
much of that nitrogen associated with agriculture in the northeastern extent of the watershed.
Waterfowl were found to be a minor source of nitrogen (1%). The large majority of nitrogen is
specifically delivered via groundwater flow (75%), with input from stream flow and runoff being
minor.
With regard to phosphorus loading to Georgica Pond (Figure 6) it was found that the
majority of phosphorus entering the pond (60%) emanates from the organic-rich, muddy sediments
across the pond bottom. Fertilizer represented a larger fraction of the total phosphorus load to the
pond (15%) with much of that phosphorus associated with agriculture in the northeastern extent of
the watershed (9%) and residential fertilizer accounting for an addition 6%. Septic tanks and
cesspools were a minor source of phosphorus (4%) as most wastewater phosphorus gets retained
within aquifer sediments, being bound to clays and sands. Atmospheric deposition represented a
minor portion of the total phosphorus load to the pond (3%) while waterfowl were found to be
slightly more important (6%). Surface runoff was also a significant source of phosphorus, being
11% of total inputs.
These models are meant to be refined with time. For example, one major recommendation
of phase one of studying Georgica Pond was to dredge sediments as a means to increase the volume
of Georgica Pond and to remove a key source of nitrogen and phosphorus to overlying waters.
20While dredging the entire pond might be desirable, the logistical feasibility of such an approach is
not tenable. Hence, it is important that as much information as possible can be generated in advance
of any dredging so that it can be done in a cost-effective manner that maximizes environmental
benefit to the pond. Toward that end, a project was conducted to quantify the precise amounts of
nitrogen and phosphorus emanating from Georgica Pond sediments which to date have only been
estimated and have been assumed to be uniform in space and time. Dr. Stuart Waugh of Stony
Brook University led this effort quantifying the rates at which phosphorus and nitrogenous
nutrients emanate from sediments. Furthermore, the rates at which nitrogen in sediments is
converted to innocuous nitrogen gas (also known as denitrification) was also quantified (See
Appendix IV for Dr. Waugh’s report). This is highly important as some organically-enriched
sediments can undergo denitrification at a high rate while others do not. Quantification of the
precise rates at which nitrogen and phosphorus are released from sediments as well as the
quantification of any denitrification in those sediments will guide future plans to dredge Georgica
Pond and will further permit a refinement of nitrogen and phosphorus budget constructed for the
Pond in 2015.
Figure 5. Gobler Independent Hybrid Nitrogen Loading Model
21Figure 6. Gobler Independent, Hybrid Phosphorus Loading Model
8. Continuous monitoring of Georgica Pond
In 2015, a monitoring buoy was installed within Georgica Pond that provides the
continuous levels of temperature, dissolved oxygen, pH, salinity, chlorophyll a, and blue-green
algae (Figure 7). The telemetry buoy is secured in the deepest area of the pond in the southeast
corner. This device has proved extremely useful for detecting the emergence of blue-green algae
blooms and hypoxic / anoxic events, all of which can emerge rapidly and some of which may be
present on a transitory basis, for example the occurrence of nocturnal hypoxia. This device has
been equally important for observing the sudden changes that occur in Georgica Pond following
the opening of the ocean inlet. For example, this buoy clearly demonstrates that opening of the
Pond leads to a rapid drop in water level, a temporary dip in oxygen levels, and then the initiation
of tidal flushing of Georgica Pond. Examples of these data sets can be found within Appendix III
of this report. Buoy data is seasonally available via
https://you.stonybrook.edu/georgicapond/buoy/ , the Friends of Georgica Pond website:
www.friendsofgeorgicapond.org and the East Hampton Town Trustees website
www.ehtrustees.com
22Figure 7. Telemetry water quality buoy installed April through November 2015 – 2019.
8.1. USGS Pond Level Monitoring Gage
Since June of 2003, the United States Geological Service (USGS) has maintained a real-
time pond level gage for the purposes of monitoring pond water levels (Figure 8). Real-time data
from the pond level gage can be obtained at the USGS website www.usgs.gov or the Friends of
Georgica Pond Website www.friendsofgeorgicapond.org. This project is funded in part by the
Village of East Hampton, Friends of Georgica Pond Foundation and the USGS. The gage is located
on the southern edge of Georgica Cove. This device has proven useful for demonstrating the
precise and relative changes in depths associated with the opening and closing of the Pond,
superimposed over normal seasonal cycles of maximal freshwater input (spring) and maximal
evapotranspiration (summer) [Figure 9].
23Figure 8 USGS Pond Level Telemetry Gage
Figure 9. 10-year record of water level in Georgica Pond
248.2. Microbial Source Tracking
In 2017, the Gobler Lab began a 2-year investigation of pathogenic bacteria entering the
pond. Tributaries feeding the pond were selected as sampling locations and DNA-based microbial
source tracking was used to identify the source of fecal contamination. In Georgica Pond two
major sources of fecal bacteria were detected: dog/small mammal and birds. The relative
proportion of these two groups changed with the season. Readings at obvious storm water runoff
sources including the Cove Hollow pipe and the Rt 27 Rest Stop confirm high bacterial counts
often exceeding EPA recreational water standards. Readings at these two locations taken since
2015 by the Surfrider Foundation also confirm the high levels. Dr. Gobler’s report is attached as
Appendix VIII.
9. Phragmites australis
In 2017-2018 a study by Ray Hinkel of AECOM was commissioned to inventory and map the
Phragmites at the pond. Genetic analysis was conducted to be certain that the Georgica Pond
strain was the invasive variety. Findings include: more than 60% of the shoreline is invaded by
Phragmites, and that the species occupies 10% of the total pond area. The brackish conditions at
Georgica Pond are ideal for Phragmites. Increased salinity could discourage the proliferation of
Phragmites and opening the pond may benefit the native brackish shoreline habitat at the southern
end of the pond. The Hinkle study is attached in Appendix V.
2510. Management Objectives & Pond Opening Decision Making Context
The long-term management objective for Georgica Pond is to restore the water quality to
the USEPA water quality guidelines for nitrogen and phosphorus (0.02 µg per L total P and 0.45
µg per L total N) and reduce bacterial contamination to NYSDEC-approved levels for shellfishing
and NYSDOH approved levels for swimming. There are many steps necessary to reach these two
goals and pond opening is not viewed as the primary technique to restore water quality, although
opening the pond can address immediate water quality issues such as blue-green algae blooms and
severe flooding conditions. As stated in the historical overview, the purpose of the traditional pond
openings was to enhance fisheries including migration of fish and crab and their juveniles and
larvae to and from the pond to the ocean. Georgica Pond is an important nursery for bait fish, eels
and the blue crab. (Gobler and Peterson, 2019; New York State Department of State, 2007). A
better understanding of this dynamic is needed. As a primarily brackish pond, the connection to
the ocean on a seasonal basis is important to maintain species balance, help control invasive species
such as Phragmites, carp, and harmful species such as blue-green algae. In addition, dissolved
oxygen levels improve after pond openings established tidal cycles (Gobler, 2015)
The observations made in Georgica Pond since 2014 provide important insight and further
confirmation regarding the effects of pond opening on water quality and water levels. In 2014 and
2015, the toxic blue-green algae blooms in the pond ended following the opening of the inlet. The
three factors considered as likely contributors towards this rapid occurrence included:
1. Tidal Transport. The induction of tidal exchange with the ocean facilitates the export of the
blue-green algae to the ocean.
2. Increased Salinity. Higher salinities brought to the pond via the ocean water created salt
conditions which were not conducive to blue-green algae that thrive under freshwater and
26low salinity conditions. Anabaena can only tolerate salinities below 15 (Moisander et al.
2002) and Microcystis thrives at salinities below 10 (Orr et al. 2004)
3. Lower Temperatures. Blue-green algae abundances generally parallel temperatures (Paerl
& Huisman, 2008).
Further evidence of the role of ocean salinity in discouraging blue-green algae in Georgica
Pond was produced from an experiment conducted in 2015 by Dr. Christopher Gobler. On August
14th water was collected from the south end of Georgica Pond with high levels of blue-green algae.
This water was diluted by half with filtered pond water or filtered ocean water, the former leaving
the salinity unchanged but the later raising salinity levels from 13 to 21. After 48 hours, blue-green
algae levels in the low salinity water increased slightly whereas levels in the higher salinity water
declined by 40%. (see Appendix III). This outcome suggests that raising salinity in Georgica Pond
is a means for successfully mitigating blue-green algal blooms.
The presence of a toxic blue-green algae bloom (higher than 25 µg per L) is a key environmental
parameter that can be mitigated by a pond opening and the introduction of high salinities to the
pond. Georgica Pond’s water levels and salinity are highly responsive and dynamic. In 2015,
following the closure of the inlet in June, salinity dropped from over 30 PSU to below 15 PSU in
only 31 days; levels low enough to support blue-green algae, which bloomed shortly thereafter. In
2019, a similar change in salinity occurred in less than three weeks.
Data from the pond gage show that occasional high-water marks have been observed over the last
10 years. In the Spring of 2017, the pond was not opened as part of the practice of traditional spring
openings as the presence of nesting piping plovers prevented the spring opening. Due to heavy
27rainfalls, and no spring opening, pond levels reached 6.5 ft. above sea level, near the record highs.
This was one foot higher than the same time in 2016, there was widespread standing water in low
areas and flooding of basements and septic systems near the pond.
● The presence of water levels higher than 5.5 feet as measured by the USGS pond gage
could trigger a pond opening to alleviate localized flooding and potential
contamination from inundated septic systems.
● The pond must not be opened during the piping plover breeding window which runs
from April 1 to August 31. If all plover chicks have fledged prior to August 31, the
regulatory agencies may be petitioned to allow earlier pond opening.
● Should a public health, natural resource impact, or storm-related emergency occur
during the breeding window, an emergency inlet opening request would be made to
the NYSDEC and U.S. Fish & Wildlife Service (USFWS). All parties would need to
agree to a previously established and approved emergency opening protocol that
would ensure that the endangered nesting species would not be impacted.
Beyond the ability to improve water quality conditions, opening the cut of Georgica Pond to
the Atlantic Ocean has numerous other ecological benefits. When the cut is open land derived
nutrients that enter the Pond are tidally flushed to the ocean. In his 2015 modeling of nutrient
loads to and from Georgica Pond, Dr. Gobler determined that keeping the cut open for longer
reduces the amount of watershed-based nutrient reductions needed to achieve EPA guideline levels
of nitrogen and phosphorus. For example, tidal exchange with the ocean was estimated to flush
1,400 lbs. of N per month and a six-month opening instead of two months would reduce the amount
of nitrogen load reduction needed from 93% to 80% and a ten-month opening (as occurred in 2018-
282019) would require only a 60% reduction in watershed nitrogen loads to achieve EPA target
concentrations of nitrogen.
Duration of pond openings should be further examined to quantify beneficial results
compared to any negative impacts.
Fig 10. An aerial photo from 2015 showing the gut which opened naturally on land owned by the
Georgica Association west of the Trustee’s parcel (thin rectangle). Note extensive sand shoals
within the pond.
Beyond the specifications regarding the conditions under which the Pond should open, it
is the consensus of all Georgica Pond stakeholders that the East Hampton Town Trustees should
29open the pond in the center of the sandy beach on land owned by the Trustees (SCTM #300-15-5-
17, Figure 10). Locating the cut as centrally as possible will reduce any potential erosion to
neighboring private property owners. A Memorandum of Understanding between the East
Hampton Town Trustees and the Georgica Association, the neighbor to the west, agreeing to the
location, notice, access and use of dredged sand was signed by the Trustees and the Georgica
Association in August of 2017 and is included in Appendix VI. A series of satellite photographs
of the pond from 1994 to 2016 show that of the 17 images, half of them show the pond with the
inlet open.
11. Management Plans Beyond Pond Openings
11.1. Septic Upgrades
Because the largest source of nitrogen to Georgica Pond is wastewater from residential
septic systems, a plan to reduce this input is imperative to improving the water quality of Georgica
Pond. Working with local government and Suffolk County, the Friends of Georgica Pond
Foundation has launched a septic upgrade campaign for the Georgica Pond watershed. This
campaign is intended to encourage voluntary upgrades in conjunction with the Town of East
Hampton and Village of East Hamptons recent code changes which require low-nitrogen systems
for all new construction and major renovation and makes a rebate available to homes in the Town
and Village’s “Water Protection Districts”.
30Map 4. East Hampton water protection districts for Georgica and Wainscott Ponds.
With approximately 2,000 homes in the entire watershed and decadal travel times of
groundwater across the entire watershed (Map 5), this is a long-term project. The highest priority
homes for upgrading septic systems are the 75 pond-front homes and, secondarily, the
approximately 280 homes in the 2-year groundwater travel time (Map 5). As of May 2020, 33
legacy septic systems within the 2-year groundwater travel time zone have been replaced (14) or
are in planning/permitting (19) to be replaced.
Outreach activities have included hosting educational workshops and one-on-one meetings
to assist homeowners with educational information on the technology and administrative
requirements. This is ongoing and adapting as the local and county programs continue to change.
Local workshops organized by the Town of East Hampton and local NGOs have also been used to
promote low nitrogen septic systems.
31Map 5. Groundwater travel time map provided by Suffolk County Subwatershed Wastewater Plan.
11.2. Maintenance Dredging
There is a well-established history of NYSDEC and ACOE permits allowing the Town and
Trustees to perform maintenance dredging at the mouth of Georgica Pond to address the shoaling
(flood tidal delta) of the pond. A review of East Hampton Town Trustee recent files documented
10-year maintenance dredging permits issued in 1989-1990, 2003-2013, and 2018-2028.
Maintenance dredging to remove sand shoals which build up at the mouth of Georgica Pond have
multiple benefits to Georgica Pond:
● Increasing the depth of the pond, lowering water temperatures and dilution of nutrients and
contaminants.
● Deepening passage from Georgica Cove to the main pond, allowing the Cove to better
exchange with the pond.
32● Improve the effectiveness of traditional pond openings.
Sand recovered during the dredging is used to nourish nearby dunes as per the NYSDEC permit
#1-4724-01190/00013.
11.3. Fine Sediment Dredging
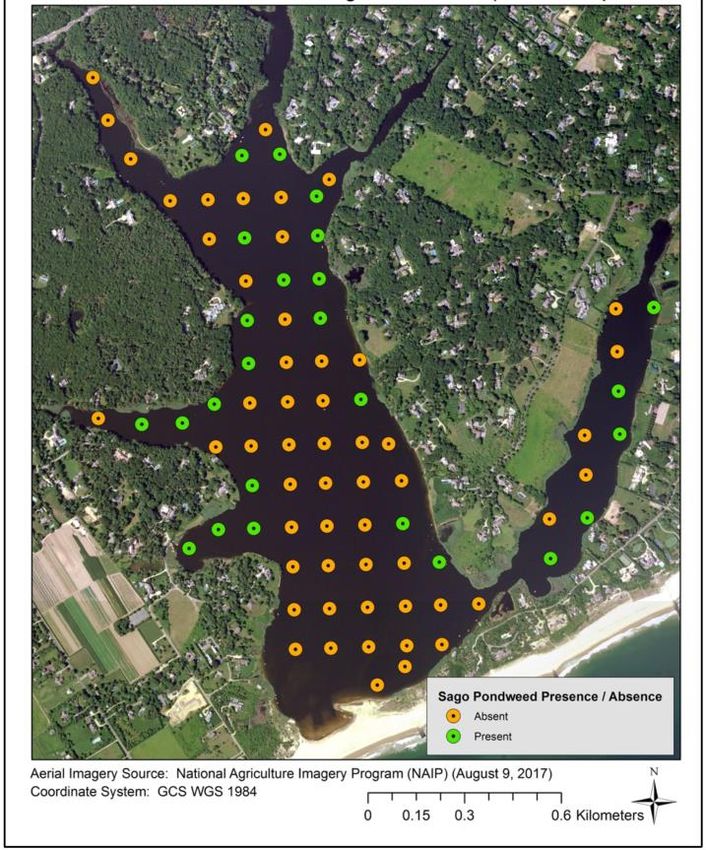
Much of the bottom of Georgica Pond consists of a thick layer of mud and silt particularly
in some of the feeder creeks and Georgica Cove (see Figure 11). Pond sediments were mapped in
the 2015 Gobler Study and removal of this thick layer in parts of the pond could eliminate a
significant source of phosphorus and nitrogen fueling algal blooms in the pond. Five test sites were
selected in 2016 and sampled for contaminants of concern for NYSDEC with respect to disposal
of dredged sediments. Two samples (Seabury Creek and Goose Creek) were free of contaminants
while elevated levels (above the minimum, below the maximum) of lead, chromium and mercury
were found in the main pond, Georgica Cove and Talmadge Creek. In 2017, Dr. Stuart Waugh of
SOMAS, Stony Brook University sampled pond sediments to further quantify the amounts of
nitrogen emanating from Georgica Pond sediments as well as rates of denitrification. Dr. Waugh’s
report is attached in Appendix IV. The Waugh report concluded that the amount of denitrification
in Georgica Pond sediments is low and that in addition to phosphorous, Georgica Pond sediments
are a strong nitrogen source. This finding strengthens the conclusion that dredging of muddy
sediments will mitigate a large nitrogen source to the pond.
33Figure 11. Sediment
composition of
Georgica Pond and
thickness of muds
(Gobler, 2015)
All these efforts
are being made towards
gathering the information needed to initiate a fine sediment dredging plan for the pond. A pilot
dredging project was initiated in 2018 at the top of Georgica Cove approved by the NYSDEC
permit #1-4724-01190/00010, Army Corps permit #NAN-2016-01054 and the East Hampton
Town Trustees and the Village of East Hampton. Phragmites roots and fine sediments were
removed using a hydrorake and small suction dredge. The project was concluded in 2020 and was
a modest success. Flow in the channel was increased and access was improved. The actual
amount of fine sediment removed was below the anticipated amount and technological and site
34limitation prevented further removal. The difficulty of access and de-watering sites at the pond
are limiting factors.
11.4. Aquatic Plant and Macroalgae Harvesting
From 2016-2018, a NYSDEC license to collect was issued to Dr. Christopher Gobler and
the East Hampton Town Trustees to use an aquatic weed harvester to remove macrophytes from
the water column as an experimental nutrient bioextraction strategy to minimize the intensity of
blue-green algae blooms (Gobler, 2016-2018; Appendix II). In 2014 and 2015 in Georgica Pond,
dense blooms of Cladophora degraded during the summer and were succeeded by blue-green algal
blooms that likely fed off of the nitrogen and phosphorus released by Cladophora. The same
pattern of succession has also been observed in neighboring Wainscott Pond. During 2016 – 2018,
macrophytes harvested included Cladophora sp., Stuckenia pectinata and Potamogeton
perfoliatus. Table 3 compares the total loads harvested in each year and the percent of the summer
nitrogen and phosphorus loads removed by this process.
Table 3. Macrophyte Harvest at Georgica Pond
Lbs. %N %P
YEAR
Harvested Removed Removed
2016 55,740 10% 20%
2017 32,700 6% 12%
2018 93,140 15% 18%
By-catch analysis of the harvester was conducted in 2018 and the details of the project are provided
in Appendix II.
35Macrophyte harvesting has correlated with a statistically higher dissolved oxygen levels
during the summer and reductions in the intensity and duration of blue-green algae blooms within
Georgica Pond (Figures 12, 13). While there was no harvester and no blue-green algae in 2019,
the Pond was open to the ocean until almost August, prohibiting salinities that would allow for
blue-green algae growth until September and prohibiting direct comparisons of this parameter to
prior years.
Figure 12. Summer
minimum dissolved
oxygen in Georgica
Pond, 2013 - 2019
Figure 13. Blue-
green algae levels in
Georgica Pond,
2014-2019
36Due to the success of the pilot project, FOGP is proposing to continue to perform annual
aquatic vegetation and macroalgae harvest using the same methods as the pilot project. In 2019,
FOGP applied for NYSDEC wetlands permits and an East Hampton Town Natural Resource
Special Permit.
No macrophyte harvesting took place in 2019. Sampling in June and September of aquatic
vegetation and fish and small crustaceans was conducted by Dr. Brad Peterson to document
conditions in the absence of the harvester. Ultimately, the reduction of macrophyte growth by
reducing nutrient inputs from the watershed to the pond will obviate the need for mechanical
harvest of macrophyte blooms. In the meanwhile, the data suggests this bioextraction approach
has a positive effect on water quality and a minimal effect of aquatic life in the pond.
11.5. Natural Vegetation Buffers
Working with the Town, Town Trustees and Village of East Hampton and other
organizations, FOGP utilizes newsletters, policy statements, and workshops with property owners
to educate and advocate for upland vegetative buffers on private and public properties; and for
reduction or elimination of fertilizer use within the Georgica Pond watershed. Where regulatory
opportunities arise, the Town, Village and Trustees have been advocating and/or requiring them.
Through this effort, over 150 acres of privately owned land in the Pond’s Water Protection District
are maintained without synthetic fertilizers, and the number of parcels with lawns to the edge of
the Pond has been reduced to 10 properties (Figures 14-16).
37You can also read