AUSTRALIAN COTTON SUSTAINABILITY REPORT 2019 - PLANET. PEOPLE. PADDOCK. SUSTAINABLE AUSTRALIAN COTTON - Cotton Australia
←
→
Page content transcription
If your browser does not render page correctly, please read the page content below
AUSTRALIAN COTTON
SUSTAINABILITY REPORT 2019
      SUSTAINABLE AUSTRALIAN COTTON
     PLANET. PEOPLE. PADDOCK.
AUSTRALIAN COTTON GROWERS HAVE BEEN QUIETLY                                                           THEY’RE WORKING TO
    IMPROVING THEIR SUSTAINABILITY FOR DECADES                                                            IMPROVE EVEN MORE
                                            PERSEVERANCE                                                  Australia’s cotton growers are working to make Australia a global leader in sustainable cotton production.

                                                                                                          This is not a new goal. Since becoming the first Australian agricultural industry to benchmark its
                                            In agricultural systems where everything is interconnected,   environmental impacts in the early 1990s, it has a long-term record of continual improvement.
                                            sustainability doesn’t happen overnight. Social, economic
                                            and environmental sustainability takes dedication and a       We know, though, being a global sustainability leader doesn’t just mean doing more with less. It also means
                                            genuine whole-of-industry commitment to continuously          being accountable for the actions and impacts of our industry.
                                            improve over many years.
                                                                                                          This Australian Cotton Sustainability Report is one way of doing that. Following the industry’s first five-year
                                                                                                          Sustainability Report in 2014, this Report meets the industry’s commitment to inform stakeholders of its
                                                                                                          actions and performance over the five years to June 2019.

                                                                                                          The report shows there is much the industry can be proud of. Its long-term trend of reducing water use per
                                            RESEARCH, EXTENSION & BEST PRACTICE                           bale by 2.5 per cent per year has continued. It has significantly reduced the hazard of pesticides used to grow
                                                                                                          cotton. It has a well-educated workforce, resilient and innovative growers who run efficient farm businesses,
                                            For decades the Australian cotton industry has invested       and, like other Australian farmers, cotton growers have a generosity of spirit that sees them invest heavily in
                                            millions of dollars each year in research, development        the fabric of their communities.
                                            and extension, in the industry between growers and
                                            government. The industry has created the world-leading        Tracking progress over the past five years also shines a light on areas the industry can improve.
                                            myBMP cotton certification standard to establish best         Like much of society, the industry needs to do more to reduce its carbon emissions. It also needs to be more
                                            practice and developed the CottonInfo program to drive        efficient with its use of nitrogen fertiliser, enhance on-farm biodiversity and improve the safety of farm
                                            grower adoption of research.                                  workplaces.

                                                                                                          To give greater focus to its efforts to continually improve, the Australian cotton industry is now setting
                                                                                                          sustainability targets and plans to achieve them. Some targets will require the industry to continue its long-
                                                                                                          term rate of improvement, and targets for other areas will stretch the industry to go beyond business as usual.
                                            CHANGE                                                        The Australian cotton industry will rise to this challenge, because these things are as important to growers as
                                                                                                          they are to the wider community. Both want natural assets to be protected for future generations. Both want
                                            This coordinated industry effort is producing premium         farmers to make a fair living from producing food and fibre sustainably. And both understand the need to take
                                            Australian cotton fibre that is sustainably grown.            care of people and make positive contributions to society.
                                            The industry has a track record of long-term
                                            improvements in areas it focuses on, and its journey is       At the time of writing, most Australian cotton growers were ending their second season of severe drought,
                                            ongoing. Sustainability targets, and plans to achieve         with latest estimates showing a 2019-20 crop one seventh the size of two years ago. This has had a significant
                                            them, are now being developed, with priority given to the     impact and will limit sustainability progress in some areas: many growers have not been able to plant a crop,
                                            areas this Report shows the industry can do better in.        and with no crop there can be no progress.

                                                                                                          The industry’s long-term track record shows that despite inevitable poor seasons, Australia’s cotton growers
                                                                                                          have continuously improved over time. The current drought is particularly harsh, and serves as a stark
                                                                                                          reminder of the critical importance of this sustainability work. The Australian cotton industry is committed to
                                                                                                          continue its journey towards being a global leader in sustainable cotton production.

                  CONTENTS                   PLANET                          PEOPLE
                                             10 Water                        23 Quality of work life
                  3 Chairs’ letter
                                             13 Carbon                       26 W
                                                                                 ellbeing and social
                  4 A
                     bout the Australian
                                                                                capital
                    cotton industry          16 Biodiversity
                  6 S
                     ustainability          18 Pesticides
                    management
                                                                             30 Global sustainable
                  7 S
                     ustainability                                              cotton leadership
                    performance
                                             PADDOCK                         31 Governance
                  8 About this report
                                             20 Efficiency
                                             21 Profitability

                                                                                                          Hamish McIntyre                               Richard Haire
                                                                                                          Chair,                                        Chair,
                                                                                                          Cotton Australia                              Cotton Research and Development Corporation
2                                                                                                                                                                                            AUSTRALIAN COT TON SUSTAINABILITY REPORT 2019   3
Clermont ABOUT THE AUSTRALIAN A COLLABORATIVE INDUSTRY
Creating a sophisticated industry with a long-term track record of improvement has been the result of a sustained and
COTTON INDUSTRY
Emerald
coordinated effort by the entire industry. Millions of dollars and thousands of hours every year have been invested in
Biloela incremental improvements by growers and industry organisations.
Theodore
QUEENSLAND Five key organisations coordinate this work, in partnership with governments, cotton growers and related businesses.
Dalby Cotton is a renewable resource that is biodegradable and 100 per
Toowoomba
St George cent natural.
Cecil Plains BRISBANE
Dirranbandi
Goondiwindi
Mungindi Australia is the third largest exporter of cotton in the world and
NEW Bourke Moree
Wee Waa produces very high quality cotton sought after by customers.
SOUTH Walgett
Narrabri
WALES Boggabri
Gunnedah
Cotton is grown mainly on family farms in inland eastern Australia.
Warren
Trangie Areas for cotton production are being explored in northern Australia.
Narromine
Research ways to improve Grower input into Encourage best practice
Hillston Condobolin Cotton is an integral and dynamic part of the Australian economy.
The Cotton Research and Development decision-making myBMP is the Australian cotton
The industry includes growers, cotton gins to separate seed from
SYDNEY Corporation (CRDC) is a partnership between Cotton Australia provides a united industry’s voluntary certification
Griffith the cotton lint, and a range of associated support industries including
Hay
cotton growers and the Australian Government, voice for cotton growers across standard, demonstrating cotton
Jerilderie Narrandera crop consultants, input suppliers, farming contractors, transport
investing in world-leading cotton research, R&D priorites, government growers’ achievement of best
CANBERRA and warehousing facilities, cotton classers, merchants and cotton
development and extension outcomes for policy, stewardship, and cotton management practice at the farm
VICTORIA researchers.
cotton and its communities. production issues. level.
MELBOURNE
Growing cotton is a complex process where natural capital, human
capital and other inputs are carefully transformed into cotton lint
and seed.
AUSTRALIAN GROWN COTTON INPUTS 2014-19 OUTPUTS
4
$1.8 BILLION
Natural capital Extend research to growers
Partnering in research and extension
CottonInfo is the Australian cotton industry’s joint extension program,
• Up to 1,500 farms grow cotton annually in
Cotton Seed Distributors Ltd. are Australia’s delivered by joint venture partners Cotton Australia, Cotton Seed Distributors
rotation with other crops average annual gross value of
supplier of cotton planting seed; investing in plant and CRDC. CottonInfo delivers research outcomes to cotton growers and
• Soil provides nutrients for plant growth cotton lint and seed production.
breeding (in partnership with CSIRO), variety and consultants helping them to take up new innovations and technologies and
• Water comes from rainfall and irrigation agronomic research, development and extension. achieve best practice.
• Native vegetation stores carbon, prevents erosion,
and provides habitat and other benefits.
3 MILLION BALES In addition to the sustainability highlights recorded in this Sustainability Report, the industry undertakes a very significant body of
work across these and other areas. More information on the industry’s extensive activities can be found on the websites of Cotton
Australia and CRDC.
Human & relationship capital or 680,400 tonnes, of cotton lint
produced per year on average.
• Grown in more than 40 rural Local
Government Areas myBMP (Best Management Practices) is a voluntary farm and
• Collectively, farms employ an average 10,740 environmental management system which provides self-assessment
Enough cotton to clothe
people per year, not including contractors, who mechanisms, practical tools and auditing processes to ensure
live locally and contribute to their communities
• Partnerships with government, industries and 375 MILLION The Australian cotton industry’s sustainability standard
Australian cotton is produced according to best practice.
The original BMP program began in 1997 and has been regularly
PEOPLE
communities to create private and public good. reviewed and refined since. Over 400 checklist items are categorised
into 10 key modules, or subject areas; 300 of these are audited, and
Manufactured capital about 100 are aspirational.
annually.
• Crop protection products, fertilisers and In 2019:
machinery are used to grow the crop.
• 630 cotton growing businesses (some operating more than one
Financial & intellectual capital
• Strategic planning guides research investments
930,000 TONNES farm) representing 66 per cent of the Australian industry were
registered for myBMP
• 234 farms, or 18 per cent of the industry, had completed
of cotton seed produced each
a third-party assurance program to be myBMP accredited
• Best practices extended to growers year on average. Each tonne
of seed yields about 200kg of • The number of myBMP accredited farms increased from
• Research and technology adopted by growers 43 in 2014.
cholesterol-free cotton seed oil,
• Innovation and commercialisation of R&D helps and about 800kg of meal and myBMP is part of the industry’s extension program, CottonInfo,
to create new companies, jobs and growth. hulls used for stock feed. ensuring that growers are provided with the latest information
resulting from research, and encouraging the continuous adoption
of best practice.
4 AUSTRALIAN COT TON SUSTAINABILITY REPORT 2019 5
SUSTAINABILITY SUSTAINABILITY LONG-TERM SUSTAINABILITY TRENDS
In agriculture and sustainability, a longer view
is often needed to see real change. Years of
MANAGEMENT PERFORMANCE drought or one bumper season can distort the
true picture, even over a five-year period.
In 1991, cotton became the first Australian
agricultural industry to benchmark its
Sustainability for the Australian cotton An Australian cotton sustainability framework called PLANET. PEOPLE. This report provides sustainability performance for the five years to
environmental performance by undertaking
industry means running profitable and PADDOCK. has been created to guide work to: June 2019. It shows the industry is doing some things well, and some
a whole of industry independent environmental
efficient businesses while creating things need to improve. The industry is now working to set five-year
• Set sustainability targets in the areas most important to industry and audit. The results provided a catalyst
environmental, economic and social targets and plans to achieve them.
stakeholders for transformation.
value. It also means being accountable
to stakeholders for the industry’s actions A long-term track record of continual improvement in areas the industry Since 1992, industry research data shows a
• Coordinate a whole-of-industry strategy to achieve these targets
and impacts. has focused on in the past, gives confidence it can achieve the targets to trend of improvement in many areas. Producing
• Engage effectively with stakeholders on actions and progress. be set for these areas in the future. a bale of irrigated cotton now requires:
The Australian cotton industry has been
PLANET. PEOPLE. PADDOCK. is not a compulsory standard or a brand.
actively working to do this for over 30
It is a framework that recognises sustainability is an integral part of
years.
doing business, and provides a path for the entire industry to benefit from 2014 TO 2019 SUSTAINABILITY RESULTS 48% LESS WATER
Now, the industry is seeking to improve continually improving sustainability performance.
even more as it works to its vision of
being a global leader in sustainable
Through a process of consultation and review, eight environmental,
Water: A long-term decrease in the volume of water used
34% LESS LAND
economic and social topics have been assessed as being most important
cotton production.
to customers, cotton growers, industry organisations, regional 9.4% to grow a bale of cotton has continued.
communities and other stakeholders. 97% LESS INSECTICIDES
Each topic aligns with relevant United Nations Carbon: Carbon emissions have increased, mainly from
Sustainable Development Goals (SDGs). The SDGs increased nitrogen fertiliser use. The amount of carbon Water use*: ML/bale
are widely recognised as providing a global pathway 12.6% stored on farms is not currently measured.
2
to achieve a better and more sustainable future for
all. Click on the SDG logo here to learn more about 1.5
how the industry contributes to these goals. Biodiversity: The area of land managed for
conservation has declined slightly or remained steady. 1
0.5
Pesticides: The amount of toxic pressure on human 0
health and the environment from pesticides has continued
92
94
96
98
00
20 2
04
06
08
10
12
14
16
18
0
20
20
20
20
20
19
19
19
19
20
20
20
20
18.2% to decrease. Work to reduce the hazard and volume of
pesticides is ongoing.
Land use: hectare/bale
PAD 0.18
EC D ON Efficiency: The amount of cotton grown per hectare
0.15
OCK
0.12
9.9% continued its long-term increase.
OM
WATER: EFFICIENCY:
less drops more cotton 0.09
IC
per crop per hectare
0.06
0.03
Profitability: Increased yields and historically high
0
75.8% cotton prices increased profitability.
94
96
98
00
02
04
06
08
10
12
14
16
18
20
20
20
20
20
19
19
19
20
20
20
20
20
CARBON: acting PROFITABILITY:
ENVIRONMENT
on climate change growing livelihoods
PLANET
BIODIVERSITY: QUALITY OF WORK Total insecticide use: grams a.i.**/bale
benefiting from LIFE: safe, inclusive
Quality of work life - safety: Injuries have 1800
biodiversity and
skilled decreased, but fatalities have increased. 1500
workplaces
1200
900
PESTICIDES: WELLBEING AND
efficient, responsible SOCIAL CAPITAL: Quality of work life - diversity and training: 600
pesticide use vibrant regional Most diversity indicators increased; the proportion
communities 300
of young people decreased.
SOC
IAL
0
PLE
PEO
94
96
98
00
02
04
06
08
10
12
14
16
18
20
20
20
20
20
19
19
19
20
20
20
20
20
Wellbeing and social capital: The wellbeing and
social capital of growers and their communities was
measured for the first time. Graph data: two-year moving average, irrigated cotton.
* Partial Gross Production Water Use Index (irrigation
water plus effective rain per bale).
**a.i. = active ingredient.
6 AUSTRALIAN COT TON SUSTAINABILITY REPORT 2019 7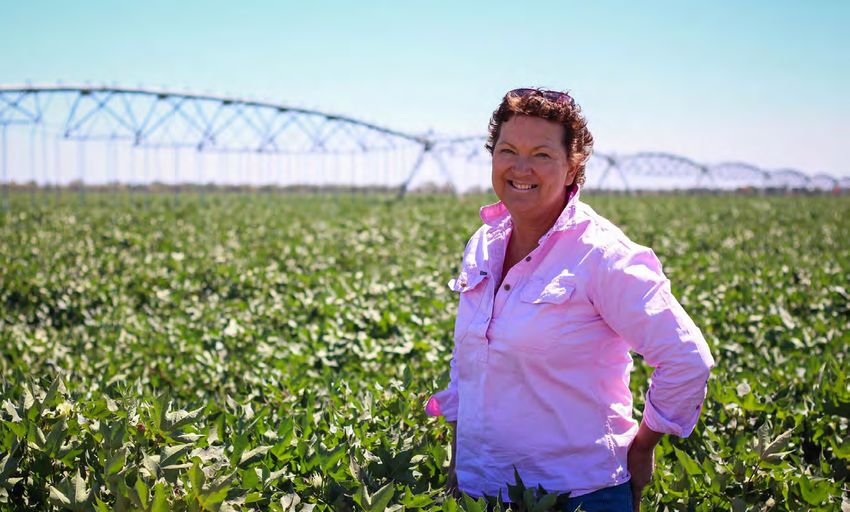
ABOUT THIS REPORT CLOSING THE LOOP
Cotton is made from plants, not plastics. It is a renewable resource that
is 100 per cent natural and biodegradable: it breaks down quickly in soil
This is the Australian cotton industry’s second five-year sustainability and water, so it does not contribute to microplastic pollution. Choosing
report, following a first report published in 2014. It provides data and Stakeholders who have provided their time cotton is one way to minimise the harmful impact of fashion on rivers
commentary for the Australian cotton industry’s most important, or to inform the material sustainability topics and oceans and at the same time, support more than 100 million farming
material, sustainability topics for the five years to 30 June 2019. Where reported on include: families growing cotton in 75 countries around the world.
possible, data from earlier years is provided to show longer trends. The
most recent industry data for some topics is not always available for the Cotton has a natural place in the textile circular economy. The Australian
Cotton industry organisations and service cotton industry is working with the textile industry to reduce waste, with
full five years to June 2019; this is clearly stated where relevant.
organisations the ultimate goal of turning textiles into products that can be used back
The report is focused on the sustainability topics most important to the • Association of Australian Cotton Scientists on farms. The industry invests in research and development, and is part
industry and its stakeholders. Through a process involving a technical of the Cotton Converts group that’s working to turn textile waste problems
• Australian Cotton Ginners Association
review, industry input and external stakeholder consultations – including into solutions.
a stakeholder forum, followup with key stakeholders, and feedback from • Australian Cotton Shippers Association
a range of internal and external stakeholders – eight material topics have • CottonInfo
been identified.
• Cotton Australia members representing
This report is written primarily for an external audience: people outside local Cotton Grower Associations, service
the Australian cotton industry who are interested in its sustainability and ginning organisations
performance. It aims to provide a succinct and balanced summary of our • Cotton Innovation Network Independent insight
sustainability work. Links to online pages with more detail are available
• Cotton Research and Development
throughout the report for readers wanting more information.
Corporation
The industry undertakes many more activities across a range of other • Cotton Seed Distributors
areas. More information on the industry’s extensive body of work can be
• Raingrown Cotton Initiative
found on the websites of Cotton Australia and CRDC.
• Wincott (Women in Cotton).
Unless stated otherwise, all data relates to on-farm activities.
External stakeholders
Data used to report against indicators is sourced from Census data, or
research by third party researchers funded by industry and government. • Agri-Science Queensland, Department
Data in this report has not been independently verified, but for of Agriculture and Fisheries
transparency, indicator data is linked to the online source where possible.
• Australian Centre for Agricultural Health
& Safety (University of Sydney)
• The Department of Agriculture, Water
and the Environment KMART PARTNERS WITH AUSTRALIAN COTTON FOR A MORE SUSTAINABLE FUTURE
• Australian Wool Innovation
As a large cotton user, Kmart Australia is committed to sourcing cotton in a way that minimises impacts on the
• Baptist World Aid
environment and has set a target to source 100 per cent of cotton as Better Cotton, organic cotton or recycled cotton for
• Country Women’s Association of NSW clothing, towel and bedding ranges by July 2020*. The Australian cotton industry has played an important role in Kmart’s
• Dairy Australia journey toward more sustainable cotton.
• Kmart/Target Australia Kmart started its relationship with Cotton Australia back in 2016 when the business successfully trialled Australian-grown
• Local Land Services cotton in its men’s T-shirt range. With strong interest from buying team members to expand into new categories, the
business commissioned an independent social and environmental risk assessment of the Australian cotton industry, and
• National Farmers’ Federation
customer insights research, to provide the business with the confidence it needed to invest.
• NSW Farmers
Although there will always be challenges and areas for improvement, the assessment concluded that risks were being
• NSW Natural Resources Commission
well-managed by the industry and through the leadership of Cotton Australia, with the myBMP program highlighted as an
• Pacific Brands example of global best practice in environmental management. The customer research suggested that Australian cotton
• QLD Farmers’ Federation is perceived as both superior quality and a great way to support Australian jobs and industry - Australian cotton was thus
seen as a win-win for our customers and the environment.
• Save the Children
• Various researchers: CSIRO, QLD More recently, Kmart has been working with its suppliers to transition all Australian grown cotton products to Better
University of Technology. Cotton as part of its 100 per cent more sustainable cotton commitment. With growing awareness of the Better Cotton
brand in Australia and globally, the program provides Kmart with a simple way to reinforce trust among customers and
The Australian cotton industry is grateful other stakeholders. By July 2020, all Australian grown cotton products at Kmart will be sourced as Better Cotton.
for the contributions from stakeholders.
It will continue to engage with stakeholders We commend Cotton Australia for their leadership in sustainable farming practices in Australia and globally through
in a range of ways to understand their partnerships such as the Better Cotton Initiative, and look forward to continuing our partnership into the future.
expectations, communicate impacts and
*Commitment excludes footwear, accessories and all functional trims (e.g. zips) and decorative details (e.g. lace or
assess materiality of forward-looking topics.
ribbons).
Kmart Australia
8 AUSTRALIAN COT TON SUSTAINABILITY REPORT 2019 9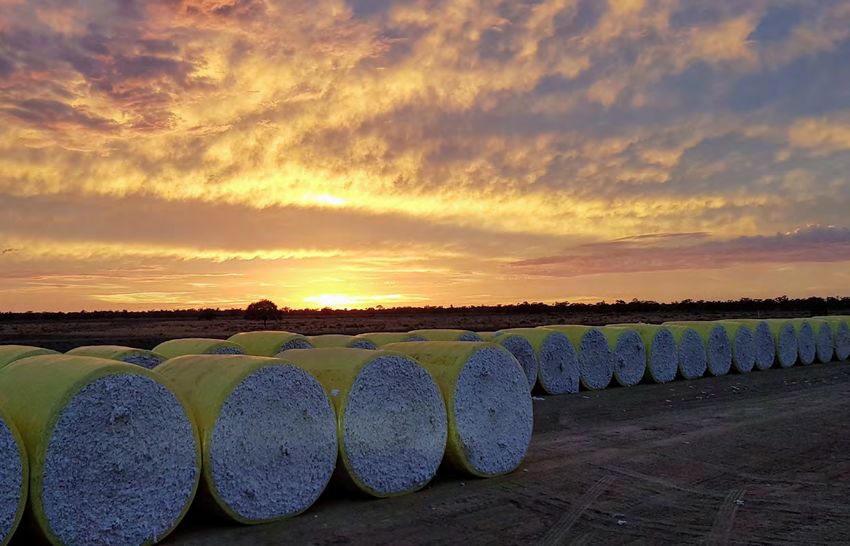
PLANET RESEARCH AND EXTENSION
WATER Less drops
per crop
The industry has invested in research including:
• The Smarter Irrigation for Profit project, led by CRDC under the Australian Government’s Rural R&D for Profit program,
involves a network of 19 farmer-managed learning sites around Australia. The first stage of this project found dairy,
cotton, sugar and rice farmers could achieve a 10 to 20 per cent improvement in water productivity and efficiency by
adopting new and existing precision irrigation technologies
• Industry-wide water productivity is now being monitored and benchmarked annually. Regular measurement of this
While dryland (rain-grown) cotton crops are successful in some Australian regions and and other climate and crop management data allow deeper analysis into the effects of soil type, rainfall, temperatures,
seasons, irrigation enables high-yielding cotton to be grown in a wider range of regions more evapotranspiration, irrigation systems, establishment method, fertiliser rates, crop rotations and other factors in driving
of the time. Water is thus a cotton grower’s most precious natural resource. Saving water has water productivity
been a focus for decades.
• The Keytah System Comparison, a grower-run project to assess the efficiencies of four different irrigation systems since
The Australian cotton industry experiences seasonal variation in water use, but has a long- 2009 to give growers detailed data to inform irrigation investment decisions.
term trend of reduced water use and increased water efficiency per bale.
This has led to practice changes including:
Water allocations are prioritised for towns, stock, and the environment before any water
is made available to irrigation licences. This is part of a governmental management plan • Efficient irrigation systems: in 2018, 25 per cent of growers were using overhead irrigation systems
that aims to provide sufficient river flows to support the health of rivers and the plants and
• Good field design: 83 per cent of growers maintained field slope in 2018, up from 61 per cent in 2014
animals that depend on them.
• Identifying field soil variation: 72 per cent of growers took soil characteristics into account in 2018 to help identify where
From 1992 to 2019, there has been a 97 per cent increase in the bales of cotton grown per
water delivery improvements can be made, up from 41 per cent in 2014
megalitre (ML) of water (effective rain and irrigation). This equates to a 48 per cent decrease
in the water required per bale of cotton. In other words, Australian cotton growers are now: • Automation: in 2018, 27 per cent of growers reported using some form of automation, and a further 47 per cent said they
are considering automation solutions.
• using almost half as much water to produce a bale of cotton, compared to 1992
• producing almost twice as much cotton from a ML of water, compared to 1992.
2014 – 2019 CHANGE Industry insight
Australian cotton growers have continued to achieve significant gains in water productivity and irrigation efficiency in
recent years. IRRIGATION IN AUSTRALIA
Since 1992, there has been an average 2.5 per cent decline annually in
Gross Production Water Use Index the volume of water used per bale of cotton. This trend has continued in Australia is a highly water-efficient producer of cotton. However, we
(ML/bale)* the last five years, and is the result of sustained effort to improve water understand many people are concerned about scarcity of water in
1.5 Australia: they appreciate cotton farmers are efficient but wonder if
use efficiency and crop productivity.
1.3 there is enough water to use in the first place.
*Gross Production Water Use Index (GPWUI) measures the total irrigation, rainfall and
1.1 water stored in the soil to grow a bale of cotton. It is regarded as the best measure for The reality is water in Australia is allocated to irrigators to match the
comparing water use between farms or seasons, and is measured as bales/ML. This scarcity or abundance of flows in any given year. Water is a highly
09 Report uses the inverse of this standard measure – ML/bale – to show the decrease in
water used to produce each bale of cotton.
regulated natural resource, with rules to ensure the basic needs of the
0.7 environment and humans must be met before any water can be allocated
0.5 to farmers for irrigation. If water in a river system is scarce in any given
1998 2007 2009 2013 2018 year, water available for irrigation is proportionally scarce. In some
years, there is no allocation of water to irrigators.
Data source: 2017-18 Water Productivity Benchmarking
study. Click here for published indicator data. A water licence gives a share of the water that is available that year after
environmental and human needs are met. Farmers with a water licence
can use their allocation to grow what they choose; many choose cotton
Whole Farm Irrigation Efficiency (WFIE) has improved in recent years. because it gives them the best financial return per unit of water.
Whole Farm Irrigation Efficiency
This tells us more water is being used by the crop instead of being lost
(per cent) We acknowledge compliance systems for enforcing these rules
on-farm, mainly due to reduced evaporation from storage dams, and
100 have been found inadequate in the past. Government enforcement
drainage and seepage in water delivery and across the fields.
80 mechanisms are being strengthened, and we strongly support reforms
WFIE shows the amount of irrigation water used by the plant as a percentage of total that make compliance robust, transparent and cost-effective. We have
60 irrigation water inputs to the farm. WFIE values are influenced by rainfall and will be
zero tolerance for any illegal activity and believe offenders should face
higher in drier years. This explains why WFIE declined slightly from 83 per cent in
40 2012-13, when there was 167mm of effective rain, to 81 per cent in 2017-18, when the full force of the law.
20 205mm of effective rain was recorded.
For more information on water and Australian cotton, click here.
0
1998 2007 2009 2013 2018
Data source: 2017-18 Water Productivity Benchmarking
study. Click here for published indicator data.
10 AUSTRALIAN COT TON SUSTAINABILITY REPORT 2019 11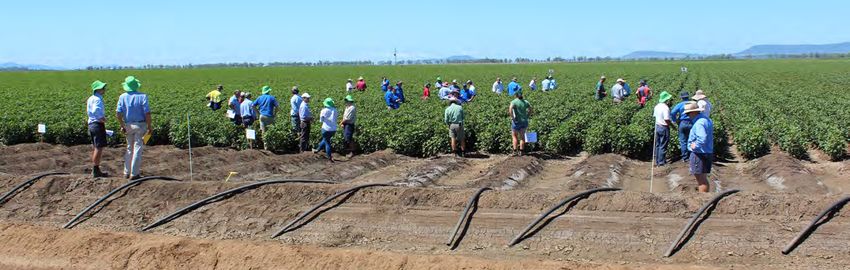
PLANET
CARBON Acting on
climate change
Climate change is expected to impact Australia’s cotton growing regions via higher temperatures, increased evaporation
and less frequent but more intense rainfall. All of these have potential negative impacts on the efficient production of cotton.
Cotton growers are taking steps to adapt to the impacts of climate change by implementing new practices and adopting new
varieties of cotton to make farms more resilient.
Cotton production emits about 0.2 per cent
Vegetation & soil on farms stores Cotton production emits
carbon. Sequestration to soil is ?% 0.2% about 0.2 per cent of of Australia’s greenhouse emissions. The
not currently measured at the Australia’s greenhouse gases.
industry scale.
main sources of emissions to grow then ship
to port one bale of cotton in the five years
to 2018-19 were nitrogenous fertiliser (58
per cent), on-farm fuel (15 per cent), and
Average percentage of greenhouse gas emissions to grow, gin and ship to port one bale of cotton, 2015-2019.
ginning energy (10 per cent). It’s important
to remember emissions are one side of
CAN WE HAVE IRRIGATED COTTON AND AN IMPROVED the carbon cycle; on the other side, farms
Independent insight Other pre-and on-farm
sequester and store atmospheric carbon in
RIPARIAN ENVIRONMENT? On-farm fuel
Other post-farm
soil and vegetation. Research is now showing
some farms are carbon positive: that is, more
Electricity
Cotton needs plenty of water, but it might actually be one of the best carbon is stored by the farm than is emitted
Fertiliser Ginning Chemicals
crops to help cope with a rapidly changing climate. This is because by its cotton production. Due to a lack of data
cotton is an annual crop: growers plant and harvest in the same We are working to measure Greenhouse gas emissions increased
and increase the amount from 2014-2019, mainly due to
on the amount of carbon stored on farms at
?% 12.5%
12-month period. This means they can look to the year ahead and of carbon sequestered by increased nitrogen fertiliser use. We the industry scale, the industry is currently
vegetation and stored in soils. are working to reduce emissions.
decide how much to plant given water availability and seasonal rainfall measuring only emissions, which does not
predictions. provide the full picture. Measuring cotton’s
carbon footprint is a target area for further
With the Murray and Darling rivers being some of the most variable 2014 – 2019 CHANGE research.
river systems in the world, this flexibility to plant more or less in a given
year is very valuable. In a drought year with limited water, a grower may
even choose to plant nothing and sell their diminished water allocation The volume of greenhouse gases emitted to grow, gin and transport to port, a bale of irrigated cotton increased by 12.6 per cent
to another farmer – for example, one who grows perennial crops like over the last five years. The increase in emissions is mainly due to a decrease in nitrogen use efficiency.
vineyards or orchards. This increases the resilience of communities
Adequate crop nutrition is critical to maximising crop yield. This includes
across the basin by supporting a diverse range of commodities and Mean carbon emissions per bale
maintaining stubble from the previous crop, crop rotations (such as
industries. (kg CO2e) (Irrigated cotton)
legumes), and the addition of nutrient fertilisers, including nitrogen,
While I think we need cotton, I don’t think we’re distributing water well. 400 phosphorus and potassium.
Algal blooms and fish kills are evidence of that.
350 Being an annual crop, growers need to resupply some of the nutrients
The 2012-26 Murray Darling Basin Plan is a good first step to distribute cotton plants need to thrive. However, with nitrogen fertilisers contributing
300
water to the environment, communities and industries, but it is poorly more than half the carbon emissions of a bale of cotton, improving nitrogen
implemented. Industry and environmental interests in the Basin should 250 use efficiency is an area for further work in the next five years. As well as
collaborate to: contributing to greenhouse gas emissions, if more nitrogen is being applied
200 than recommended it represents an additional cost to growers that doesn’t
• Improve monitoring 2012-14 2015-19
necessarily result in increased production.
• Relax constraints that are preventing best use of environmental water
Data source: 2019 carbon footprint study, five-year In addition to reducing emissions, the industry is also working to increase
to conserve flora and fauna average. Click here for published indicator data.
the amount of carbon stored in soil and vegetation on farms. In 2019,
• Recover agreed environmental water 72 per cent of growers were taking steps to specifically reduce emissions
• Plan for climate change. Mean nitrogen use efficiency or sequester carbon, including vegetation management (40 per cent),
(kg lint/kg N)(Irrigated cotton) cover cropping (35 per cent) and tree planting or using organic manure
Achieving this can deliver a healthy river system that also provides (28 per cent each).
certainty to support vibrant regional communities and sustain 12.0
productive agricultural industries – including cotton. This data is telling us an industry priority needs to be to work towards
9.0
carbon neutrality by making greater efforts to reduce emissions, to
6.0 increase sequestration, and to measure the industry’s net carbon footprint.
Professor Jamie Pittock
Part of this challenge is developing a process to efficiently and robustly
Fenner School of Environment and Society 3.0 measure carbon sequestration and storage at a farm and industry scale.
The Australian National University
0.0
2010-14 2015-19
Data source: rolling five-year average of CRDC Cotton
Grower Survey. Click here for the most recent Cotton
12 Grower Survey.
AUSTRALIAN COT TON SUSTAINABILITY REPORT 2019 13
RESEARCH AND EXTENSION Carbon positive cotton: driven by native vegetation
The Kahl family near Wee Waa in New South Wales are
The industry has invested in research to reduce its net carbon footprint showing how a cotton farm can be carbon neutral, and even
including: carbon positive, through careful land use management.
• Optimising the management of manures in southern NSW cotton The Kahls have reduced farm emissions through a holistic
production rotation system that sees them grow cotton in a four year
rotation with crops like corn, wheat and mungbeans, and
• Investigating the role of rotations and cover crops in cotton farming
graze livestock on soils not suitable for cropping.
systems Better monitoring improves nitrogen
They also maximise sequestration by maintaining healthy
• Optimising the efficiency of water pumps
use efficiency vegetation zones. Of the 1,200 hectares on their ‘Redbank”
• The carbon farming project to promote on-farm renewable energy,
property, 839 hectares are vegetation including 153 hectares
responsible use of nitrogen fertiliser, management practices to improve Graham Volck is always looking to improve
of super-sequestering River Red Gum riparian forest.
soil carbon levels, and environmental plantings resource use efficiency on his irrigated
• Researching the use of gin trash as a biofuel to produce ethanol, to cotton farming business near Emerald, These careful land management decisions mean their
potentially reduce ginning emissions. Queensland. Less inputs means less property sequesters approximately 1,185 kilograms of carbon
resources used, lower costs – and in the case per hectare over and above the carbon emitted.
The industry has invested in research to improve nitrogen use of nitrogen fertiliser, lower greenhouse gas
efficiency including: emissions and reduced run-off of nitrates. The farm also gains other benefits including reduced erosion,
pollutants and pests.
• Significant investment in research, development and extension to For the 2017-18 and 2018-19 seasons,
better understand and more efficiently manage the complexities of Graham offered his farm as a demonstration
nitrogen use site to show nitrogen use efficiency can be
improved by monitoring nitrogen movement
• The More Profit from Nitrogen project, led by CRDC under the
and losses.
Australian Government’s Rural R&D for Profit program, in cooperation
with the dairy, sugar and horticulture industries, to enhance nitrogen Graham increased his soil testing program
use efficiency from once to three times each year to get a
• Research showing simple management practices such as how fertiliser better understanding of what was happening
is placed, the rate of application, and how changes in early season with soil nitrate levels before, during and
irrigation can reduce nitrogen losses substantially and reduce indirect after the cotton crop. This gave Graham the
nitrous oxide emissions. confidence to remove one in-crop nitrogen
fertiliser application of 50 to 60 kg N/ha,
This has led to practice changes including: which saved $68 to $80/ha in fertiliser costs.
It also reduced soil disturbance, thereby
• Alternative energy sources are used: 27 per cent of growers generated helping maintain good soil structure and soil
solar energy in 2019 carbon levels.
• New pump stations that are the best design and type for the farming
system The results of the tests are being shared
widely with other growers at workshops
• Energy use in tractors is optimised: 91 per cent of growers used and on YouTube. Graham is now looking at
autosteer and 64 per cent used traction control in 2019 to improve more precise nitrogen fertiliser management
energy efficiency practices to further reduce nitrate run-off
• Nitrogen use efficiency is recorded and monitored over time. and greenhouse gas emissions, without
impacting yield.
Carbon positive cotton: driven by soil carbon
The Statham family acknowledge they are temporary custodians of their land, and for decades have been working in
harmony with nature to leave it in the best possible condition for future generations.
To the Stathams, this means being accountable for running a highly productive cotton farm within planetary
boundaries. The family has invested in constant research, trials and innovation for many years to achieve their
sustainability results. This work has seen significant improvements in water use, fertiliser efficiency, soil health and
biodiversity enhancement. It has also made their farm carbon positive.
David and Danielle Statham requested a full sustainability report to be undertaken by the University of Queensland.
This showed the carbon footprint per bale of irrigated cotton produced, ginned and delivered to port by the Stathams
in 2018 on a high-yielding crop of 14 bales per hectare was - 412kg CO2e per bale. This means the Statham’s 20,000
hectares of black alluvial soils are a carbon sink, storing more carbon than is emitted to grow cotton. This has largely
been achieved through practices such as using composted waste matter, crop rotation, and minimum or zero tillage.
Together, these have seen soil carbon levels rise from 0.5 per cent in 2013 to 0.74 per cent in 2017.
The Stathams also graze cattle on carefully managed land and maintain about 10 per cent of their farm as forest and
floodplain. The University of Queensland study showed the carbon footprint for the entire farm, including cattle, was
-26,682 T CO2e. That means the Stathams are running a productive food and fibre business – and storing enough extra
On-farm field days are an important part of extending research to growers. carbon to offset the total annual emissions of about 1,800 Australians.
14 AUSTRALIAN COT TON SUSTAINABILITY REPORT 2019 15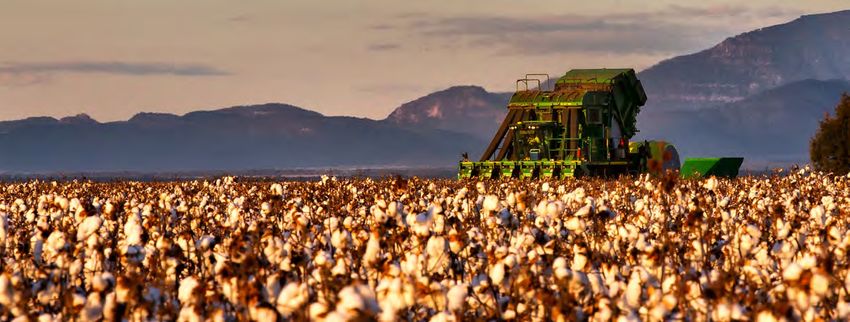
PLANET RESEARCH AND EXTENSION
Industry insight
BIODIVERSITY Benefiting
from biodiversity The industry has invested in research including:
• Research showing growers who maintain healthy trees, good
groundcover, diversity of native plant species, complex habitat
structure and connectivity will benefit from riparian ecosystem
services. These include reduced sediment runoff, natural pest control
and increased carbon sequestration; old growth River Red Gums
can store almost 400 tonnes of carbon over the life of the tree, and
Biodiversity is the variety of life forms found in an environment including animals, plants, bacteria, fungi and micro-organisms.
sequester on average 2.5 tonnes per hectare per year
It also includes the diversity within and between species and the diversity of ecosystems. Biodiversity can provide natural pest
control and pollination, control erosion, store carbon and enhance water retention. The major threats to biodiversity on farms are • Benchmarking biodiversity assets across cotton landscapes and
invasive species, habitat loss and land degradation. identifying priority management actions for the restoration of
threatened and iconic species within cotton landscapes
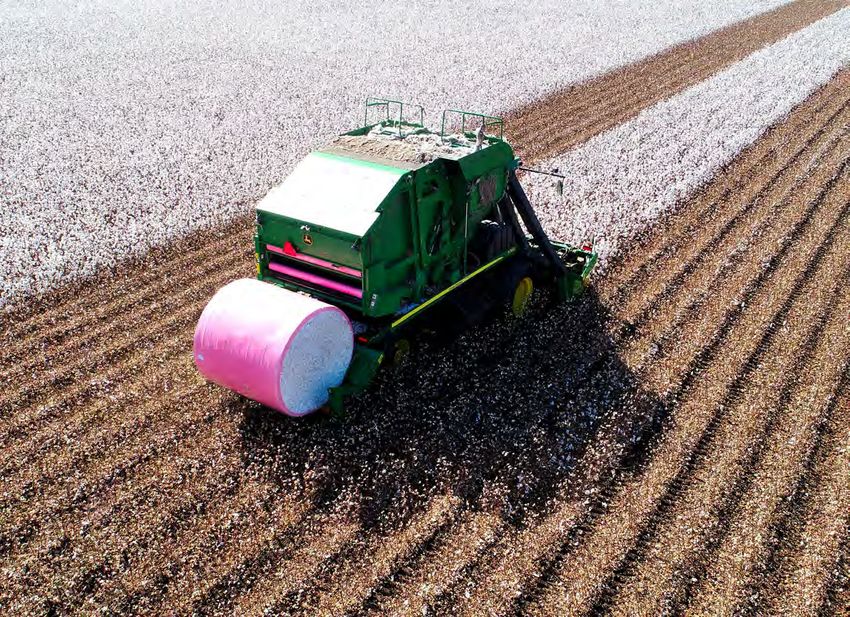
• Innovative extension methods for cotton growers such as family canoe
trips to spot wildlife and understand the importance of riparian - both SOIL HEALTH
land and water - environments.
Soil carbon and organic matter supply
This has led to practice changes including: nutrients for plant growth, and soil micro-
organisms stabilise soil structure and
• Whole farm plans which consider the management of natural resources improve soil water storage and infiltration.
on-farm and in the surrounding landscape as part of the overall Soil organic matter levels in many
management of the farm: in 2019, 38 per cent of growers excluded cropping fields, including cotton, have
grazing from areas previously grazed, and 31 per cent managed stock declined since the fields were developed
access through addition of fencing or offsite watering points for agriculture many years ago.
• Maintaining or creating new native vegetation using revegetation Common practices used by Australia’s
or natural regeneration that connect existing patches of vegetation: cotton growers such as minimising
in 2019, 50 per cent of growers had actively encouraged natural tillage, controlled traffic farming, using
regeneration in the past year, and 70 per cent undertook weed control rotational crops and optimising fertiliser
of natural areas application including the use of manures
and biosolids, are being used to address
• Maintaining or restoring natural wetlands and billabongs and enhancing
this decline in soil carbon.
artificial ones: in 2017, 70 per cent of growers reported using riparian
area best management practices in the past decade. The fundamental importance of soil is
reflected in the six standards and 32
checklist items devoted to soil health in
Mean per cent farm managed
for conservation
2014 – 2019 CHANGE 21ST CENTURY REVEGETATION
the industry’s myBMP program. myBMP
encourages growers to prevent erosion;
6.0
minimise soil structural problems like
Cotton grower survey data shows the mean area of cotton growing So here’s a problem. You want to enhance biodiversity by revegetating compaction, salinity and sodicity, and;
farmland actively managed for conservation decreased in the past more of your farm, but being in a semi-arid environment you can’t plant monitor and efficiently manage nutrient
4.0
five years. However, older grower survey data appears to have slightly when it’s dry, and being on heavy clay soil you can’t get onto your land requirements.
overstated the percentage of land managed for conservation*; the last after drenching rains without getting stuck in mud.
2.0 two years of surveys have recorded land being managed for conservation Soil health is of material importance to
as between 3 per cent and 4 per cent, and this proportion is likely to have What do you do? How about after heavy rain you bring in a drone fitted our industry, but we have not measured it
been steady for some time. with a modified air rifle using technology built at Oxford University to for this report because it is very difficult
0.0
2014 2017-19 shoot seeds into saturated soil? to accurately and meaningfully measure
In the next five years, more accurate measurement of native vegetation something as complex as soil health
and increasing the mean area of farmland managed for conservation will With the capacity to plant a hectare of native trees in less than 20 across the industry with one or two
Data source: mean of responses to 2017-2019 CRDC be sought. This may not be easy as recent drought conditions restrict minutes at the optimal time of year for germination, this method mimics indicators.
Cotton Grower Survey. Click here for the most recent
planting of new native vegetation. In addition, farmland is privately owned natural conditions where floodplain species naturally flower and seed
Cotton Grower Survey. Native vegetation refers to after a flood event. The Food and Agriculture Organization
naturally occurring local plant species from small and research has shown many farms have relatively little native vegetation
groundcovers such as grasses and forbs through to larger as a result of historical clearing. However, there is growing awareness of of the United Nations has developed a
Under the Cotton Landcare Tech-Innovations 2021 project, supported Visual Soil Assessment guide to assess
shrubs and trees. the benefits of farm biodiversity. The challenge is to turn this awareness
by the National Landcare Program’s Smart Farming Partnership initiative, soil health. Australian growers have
into more actions.
* When assessing the land use mix on cotton farms, this is just one of the new revegetation methods researchers from been conducting visual soil assessments
recent grower surveys measured ‘native vegetation
Measuring the area of land managed for biodiversity is important, but Australia and the UK are investigating to help us increase revegetation. for many years, and we are currently
not grazed’ and ‘other’ (water storages, channels etc).
Older grower surveys appear to have included ‘other’ measuring the richness and extent of biodiversity on that land provides a assessing the feasibility of using this as an
into ‘native vegetation not grazed’, thereby incorrectly fuller picture. This is difficult due to the time, cost and technical expertise indicator for soil health across Australian
estimating the proportion of land managed for needed, but the challenge is being met by investing in research to assess cotton farms.
conservation at 5 per cent to 6 per cent.
the proportion of bird and/or insectivorous bat guilds on farms to monitor
the impact of farm conservation activities. The new Cotton Landcare Tech- You can read more about the work we do
Innovations 2021 project to enhance natural resources and biodiversity is to improve soil health here.
expected to report on this in future.
16 AUSTRALIAN COT TON SUSTAINABILITY REPORT 2019 17
PLANET RESEARCH AND EXTENSION
PESTICIDES Efficient, responsible
pesticide use The industry has invested in research including:
• Annually updating the industry’s IPM and weed management
strategies
• Years of research showing on-farm native vegetation fills a critical
gap to support the life-cycle of many beneficial insects and birds
Pesticides (including insecticides and herbicides) that provide pest control services
are widely used in agriculture to control crop
• Workshops and communication to show IPM plays an essential role
losses from pests. Over-use of pesticides can
in helping growers avoid insecticide resistance and achieve high-
lead to resistance, secondary pest outbreaks,
yielding cotton.
destruction of natural predators and an increased
risk of off-farm movement and environmental
This has led to practice changes including:
contamination.
• IPM tactics to minimise weeds, diseases and pests
Australian cotton growers have reduced the
amount of insecticides used in cotton by • Pest control decisions based on industry thresholds for
95 per cent per hectare since 1993, or pest population and crop damage: 90 per cent of spray Research into more precise application of chemicals using
97 per cent per bale. This coincides with the recommendations are based on industry thresholds robotic sprayers that can selectively spot weeds can help
introduction of Bt transgenic cotton and strong reduce the volume and hazard of herbicides.
uptake by growers of Integrated Pest Management • Beneficial insects conserved on farm: 91 per cent of farm advisors
(IPM). IPM is a strategy to manage pests with a aim to conserve beneficial insects.
range of practices to promote natural control from
beneficial insects while suppressing pests. Tactics
include crop rotations, weed control, and native
vegetation and refuge crops to house ‘beneficial’
insects, birds, bats and other predators.
Independent insight HOW IS AUSTRALIA MANAGING PESTICIDES?
Weeds are controlled by herbicides and tillage.
Moving towards reduced tillage systems has increased soil carbon and moisture and reduced fuel use, but it has also increased
herbicide use by 20 per cent since 1994. In this period there has been an increase in the use of glyphosate, and a decrease in the Australia is notable for its success in delivering and maintaining
use of other types of herbicides. Consequently, industry has invested heavily in recommended spraying practices to avoid the significant reductions in insecticide use in cotton production. A key factor
emergence of weeds with resistance to glyphosate. The volumes of herbicides may reduce in future with the adoption of robotic in this was the early adoption of Integrated Pest Management (IPM) by
tractors and sprayers that selectively target individual weeds using physical control and more precise application of herbicide. Australian farmers which has only increased as growers have seen how
effective these techniques are at managing pests. The adoption of IPM
Reducing the quantity of pesticides is important, but the toxicity of each pesticide also needs to be considered. This is emphasised has helped prevent secondary pests from becoming a major problem in
by the choice of toxicity of pesticide use as an indicator. Australian cotton production – unlike in other cotton growing countries.
That said, it is deeply concerning that Australian cotton farmers continue to
use bee-toxic neonicotinoid insecticides. A key priority for the sector must be
to ditch these harmful chemicals and adopt less damaging pest management
ETL score for bees 2014 – 2019 CHANGE approaches. Further, cotton production in Australia is especially reliant on
glyphosate for weed control, with over 90 per cent of cotton planted each
2
year carrying a glyphosate-resistant trait. Much more can be done to reduce
1.5 The Australian cotton industry’s Environmental Toxic Load (ETL) for bees herbicide use which has remained stubbornly high.
decreased by 18.2 per cent from 11 to 9 in the four years to 2018. This
1 continues a long-term, but slowing, decline: the lower the ETL score, the This will not be easy, and farmers – who are at the sharp end in dealing with
lower the toxic pressure. environmental challenges from pest problems to climate change – will need
20
help and support from government, research institutes and Cotton Australia
0 ETL is an indicator to assess the average amount of toxic pressure on itself to meet these challenges.
human health and the environment from pesticides applied on one hectare.
17
18
20 4
05
20 6
20 7
09
10
11
12
13
14
15
16
0
0
0
20
20
20
20
20
I am sure that Australian cotton farmers want to do the right thing and the
20
20
20
20
20
20
ETL for bees has been chosen as the target indicator for pesticides applied
in the cotton industry, as bees are a critical provider of pollination services progress they have made in adopting IPM shows what they can achieve when
and a key indicator for terrestrial ecosystem health. they get the right incentives and support to help them on their way.
Data source: CRDC commissioned research.
Click here for published indicator data.
The ETL approach also allows us to monitor the hazard to three other Keith Tyrell
indicator species. For example, ETL for algae, an indicator of herbicide Director,
toxicity, decreased by 20 per cent in the four years to 2018, and by 75 Pesticide Action Network UK
per cent since 2004. This information can be used to further improve
management of pesticide use to avoid resistance and minimise potential
environmental impacts.
18 AUSTRALIAN COT TON SUSTAINABILITY REPORT 2019 19PADDOCK PADDOCK
EFFICIENCY More cotton
per hectare PROFITABILITY Growing
livelihoods
Farmers have sought to increase crop yields for thousands of years. The cotton industry takes the science of farming to a new Profitability is a fundamental sustainability indicator for growers. Profitable cotton growers can re-invest in their own
level by investing heavily in research to increase yields, and working with innovative cotton growers to adopt research and business, and contribute to local communities, economies and the environment.
new technologies.
Mean irrigated crop yield (bales/ha)
12
9
6
3
0
1995-99 2000-04 2005-09 2010-14 2015-19
Mean dryland crop yield (bales/ha)
2014 – 2019 CHANGE
3.5
3.0 Irrigated cotton yield increased by 9.9 per cent in the last five years,
2.5 which included a season of severe drought in 2018-19 that delivered
2.0 a yield 14 per cent below the five-year average. Average dryland cotton
1.5 yields decreased by 27 per cent when compared with the previous five
1.0 years. This period included the three hottest and three driest years
0.5 on record, both of which put stress on plants and significantly reduced
0.0 both dryland production area and yields.
2000-04 2005-09 2010-14 2015-19
A long-term trend of increasing irrigated yields is the result of significant Mean irrigated profit per ha
Data source: rolling five-year average of Australian effort by the industry. Better water and nutrient management, new cotton (operating profit $/ha) 2014 – 2019 CHANGE
Cotton Production Forecasts: Cotton Australia. varieties, appropriate tillage, and crop rotations are some of the factors 2000
that contribute to increasing yields over time. In the five years to 2018*, average profitability per irrigated hectare
1500
increased 76 per cent. Average profitability per year ranged from
1000 $986/ha to $2,513/ha – the highest average net profit per hectare in
the history of our benchmarking study. Many factors influence the
500 profitability of cotton production. In 2018, most of the key profitability
drivers – including high world cotton prices, favourable AUD-USD
0
2004-08 2009-13 2014-18
exchange rates, very high yields and low operating costs – were all in
growers’ favour. This unusual confluence of events combined to deliver
record profits in that year.
Irrigated profit per ha While exchange rates and cotton prices are outside the control of the
(operating profit $/ha) industry, key drivers of profitability in the top 20 per cent of growers
are higher yields and lower expenditure per hectare on costs such
3,000
as water pumping and labour. Industry investments in research and
2,500 innovation support higher yields, and lower expenditure per hectare.
2,000
Profits vary depending on seasonal conditions, so drier conditions in
1,500
2019 and 2020 are likely to see profitability decrease in these years.
1,000
Data source: rolling five-year average of Australian Cotton Comparative Analysis.
500
*Due to a one-year lag in profitability data being published, the 2019 indicator is for
0 the five years to the 2017-18 season. Click here for published indicator data.
2004
2005
2006
2007
2008
2009
2010
2011
2012
2013
2014
2015
2016
2017
2018
.
20 AUSTRALIAN COT TON SUSTAINABILITY REPORT 2019 21RESEARCH AND EXTENSION PEOPLE
The industry has invested in research including: QUALITY OF WORK LIFE Safe, inclusive,
skilled workplaces
• Crop physiology research giving growers options to increase yields in low
rainfall years, such as planting every second row to help plants make the most
of available moisture
• Breeding programs to create new cotton varieties to increase yield, improve
fibre properties and manage disease resistance. Cotton is grown on up to 1,500 farms depending on the season, mainly in New South Wales and Queensland. Some cotton
is grown in northern Victoria and areas for cotton production are being explored in northern Australia. In total, these farms
employ an average of 10,740 full-time, part-time and casual employees per year. This does not include extensive use of on-farm
Cotton growers invest directly in research: 35 per cent of growers hosted a
contractors. Post-farm gate, the industry directly employs a further estimated 1,700 people in marketing and export, cotton
research trial on their property from 2013 to 2018, contributing an average
classing and in the 41 regional gins. The industry also supports jobs for agronomists, rural suppliers and other input providers.
of 19 hours and $5,500 to these trials. In addition, Cotton Seed Distributor’s
Ambassador Network collects extensive data throughout the season from Attracting employees is a challenge throughout regional Australia. The cotton industry is working with other sectors to improve
fields on 76 farms to draw conclusions on best practices that produce the the diversity, training and safety of its people, helping to make agriculture an employer of choice. In the cotton industry, building
highest yields. Information is extended back to growers through regular crop adaptive capacity is a research goal. The industry invests in projects in the key focus areas of science and innovation capability
progress reports. and new knowledge, and futures thinking.
This has led to practice changes covering all aspects of cotton production, Data for “Diversity of workforce” and “Workforce qualifications and training” is sourced from Australian Bureau of Statistics (ABS)
including improving: Census data and is collected every five years. There are limitations to Census data – in particular, some people working in cotton
as well as other agricultural industries aren’t counted as part of the cotton industry, and the Census counts people in August when
• Resource efficiency by using less water and energy per bale of cotton seasonal employment in cotton is low – but it is the best currently available for these demographic indicators.
• Soil health and fertility, by improving soil carbon levels and soil structure, and
by managing soil nutrients, erosion risks, and soil salinity
• Fibre quality, by having appropriate variety selection and crop management
2014 – 2019 CHANGE: Diversity of workforce
practices to deliver clean white cotton to the gin.
Age of people in cotton growing and ginning (Census data 2011 and 2016)
In addition, cotton growers use a sophisticated range of risk management Per cent ageYou can also read