Fitz-Stirling 2007-2017 Ten-year Evaluation Review - Feb / 2018 - Bush ...
←
→
Page content transcription
If your browser does not render page correctly, please read the page content below
Fitz-Stirling
        2007-2017
Ten-year Evaluation Review
       Feb / 2018

                             Page |1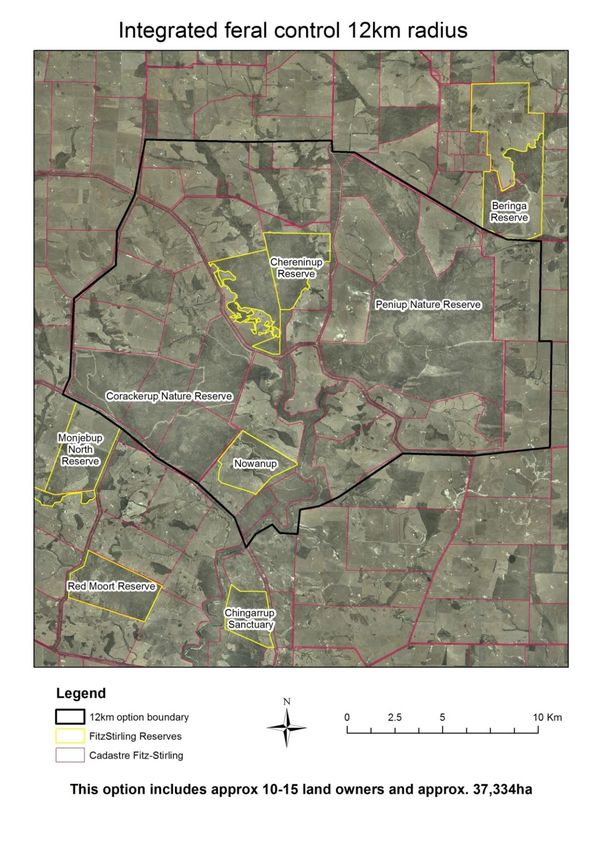
Acknowledgements: This report has benefited greatly from the discussion and guidance
on content, presentation and editing by Annette Stewart, Clair Dougherty and Simon
Smale. Their expert assistance is greatly appreciated. Volunteers have played a major
and vital role in the monitoring and survey program over the past 5 years and I thank all of
those involved. Special thanks go to Dr Sandra Gilfillan for her continuing dedication to
the wallaby monitoring and research program. Volunteers Aaron Gove, who provided the
bird data analysis and Richard Thomas, who provided the bat data analysis, have made a
large contribution to this report and I thank them. I sincerely thank Bill and Jane
Thompson who have regularly carried out all the pool monitoring for several years.
Thanks also to Barry Heydenrych, Greening Australia, who provided restoration data.
Funding to assist the monitoring program and UAV surveys during 2015 was gratefully
received from South Coast NRM as part of the Australian Government funded ‘Restoring
Gondwana’ program. Funding vital for wallaby monitoring and research was provided by
the Diversicon Foundation.

Citation: Sanders, A. (2018). Fitz-Stirling 2007-2017 ten-year evaluation review.
Unpublished report for Bush Heritage Australia.

                                                                                    Page |2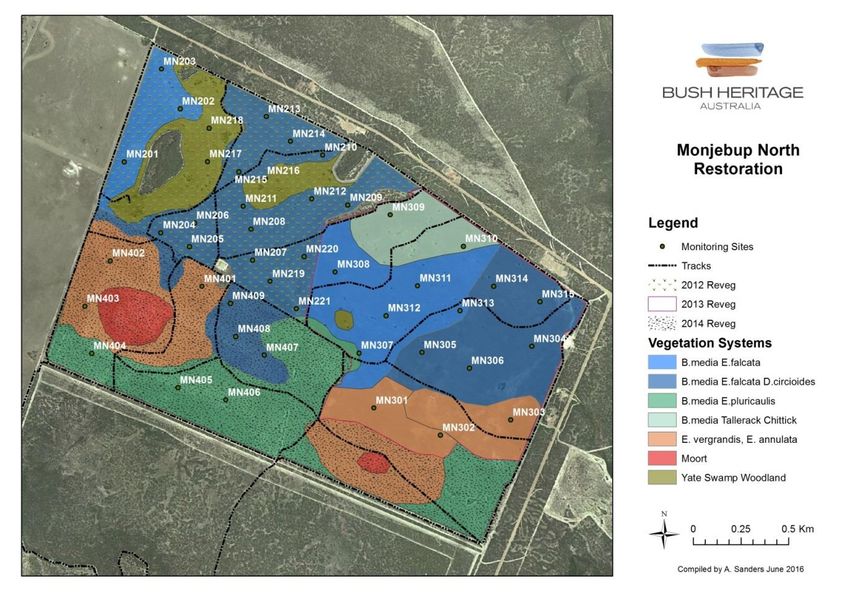
Contents
Overview of Fitz-Stirling Project ........................................................................................................ 6
This report evaluates our conservation impact .................................................................................. 7
   A wide range of indicators are monitored to assess progress towards our goals ........................... 8
   ...................................................................................................................................................... 9
   Climate change is influencing ecological processes in the Fitz-Stirling .......................................... 9
Four Conservation Targets are used to measure our progress ....................................................... 11
   Conservation Target 1: Mallee Heath and Black-gloved Wallaby ................................................ 11
      Goals for this target: ................................................................................................................ 12
   Progress towards the goals for Mallee heath and Black-gloved Wallaby: .................................... 14
      1.     Extent of restored mallee heath has increased from 60 to 2,624 hectares ........................ 14
      2.     Undisturbed mallee heath vegetation is in very good condition ......................................... 14
      3.     Vegetation that has been established on cleared farmland is developing well .................. 15
      4.     Fire remains a key area requiring focus ............................................................................ 17
      5. Bird monitoring shows that our restored areas are providing increasingly suitable bird
      habitat...................................................................................................................................... 18
      6.     Bird activity and species richness increased over time at revegetated sites ...................... 19
      7.     Bird activity increased at reference sites ........................................................................... 20
      8.     Bird activity increased at naturally regenerating sites........................................................ 21
      9. Nectivorous resource nomads and resident understorey birds increased more in restored
      sites than in reference sites ..................................................................................................... 21
      10. Bird assemblage similarity depends on the treatment and age of restoration. .................... 23
      11. Ground dwelling fauna species richness has increased in restored areas .......................... 24
      12. Seven bats species have been recorded in the restored areas .......................................... 25
      13. Black-gloved Wallaby distribution is increasing with restoration of their habitat .................. 27
   Conservation Target 2: Mallet, Moort and Tammar ..................................................................... 28
      Goals for this target: ................................................................................................................ 28
   Progress towards the goals for Mallet, Moort and Tammar Wallaby ............................................ 29
      1. The goal of increasing the extent of mallet and moort by 100ha has been exceeded. ......... 29
      2. Tammar occupancy has decreased from 50% in 2011 to 39% in 2015 ............................... 29
   Conservation Target 3: Creeks and Flat-topped Yate .................................................................. 30
   Conservation goals for this target ................................................................................................ 30
   Progress towards the goals for Creeks and Flat-topped Yate ...................................................... 31
      1. Further monitoring is required to establish the normal range of variation for Yate
      recruitment and crown condition .............................................................................................. 31

                                                                                                                                           Page |3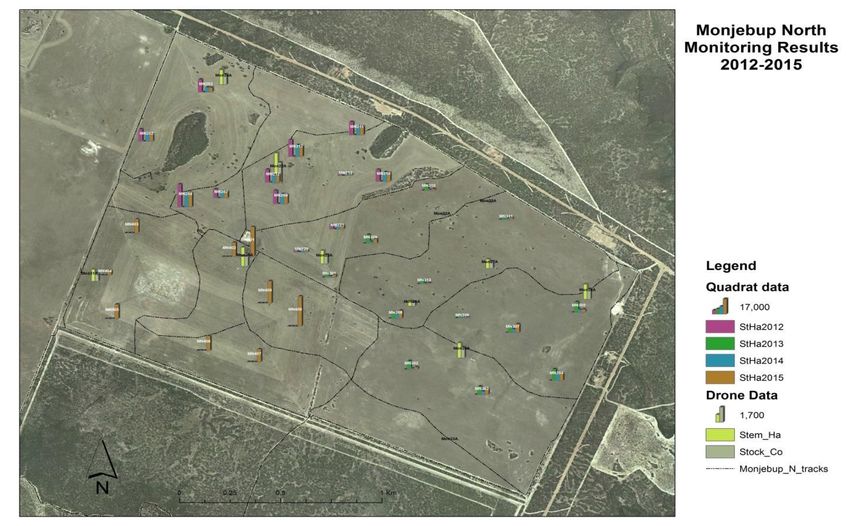
2. We are approaching our goal of restoring 2,000ha of yate by 2023 ..................................... 32
      3. Water quality in creek pools needs further monitoring to establish the normal variations in
      these systems.......................................................................................................................... 33
      4. We are approaching our goal of restoring perennial vegetation in the Monjebup and
      Corackerup catchments ........................................................................................................... 33
   Conservation Target 4: Fresh Water Systems ............................................................................. 34
      Conservation goal for this Target ............................................................................................. 34
      Progress towards the goals for Fresh Water Systems ............................................................. 34
Landscape scale flora and vegetation surveys have highlighted extraordinary diversity .................. 35
Conservation actions – managing threats to the Conservation Targets ........................................... 37
      Threats to Targets ................................................................................................................... 37
      Managing fragmentation: The key management strategy for the Fitz-Stirling is to restore cleared
      farmland .................................................................................................................................. 39
      Managing invasive herbivores: rabbits are controlled prior to restoration ................................. 39
      Managing invasive predators: feral predators pose a high threat to fauna in the Fitz-Stirling and
      they are not currently managed ............................................................................................... 39
      Managing weeds: weeds pose a minor threat on the BHA Fitz-Stirling properties .................... 40
      Managing fire: prescribed burning is required across BHA properties ...................................... 40
      Managing Phytophthora cinnamomi: Phytophthora cinnamomi occurs on Yarrabee and
      Monjebup North ....................................................................................................................... 41
      Managing Salinity: salinity poses a very low threat to Targets on BHA properties .................... 41
Recommendations for the next 5 years and beyond ....................................................................... 43
   Conservation Target recommendations ....................................................................................... 43
      Target 2: Mallet, Moort and Tammar ........................................................................................ 43
      Target 3: Creeks and Flat-topped Yate .................................................................................... 43
      Target 4: Fresh water systems................................................................................................. 43
   Conservation action recommendations........................................................................................ 43
      Restoration .............................................................................................................................. 43
      Managing invasive herbivores.................................................................................................. 44
      Managing invasive predators ................................................................................................... 44
      Managing weeds...................................................................................................................... 44
      Managing fire ........................................................................................................................... 44
      Managing Phytophthora cinnamomi ......................................................................................... 44
      Managing Salinity .................................................................................................................... 44
      Monitoring, evaluation and research ........................................................................................ 44
      Monitoring ................................................................................................................................ 44
Glossary of key terms ..................................................................................................................... 47
References ..................................................................................................................................... 47

                                                                                                                                     Page |4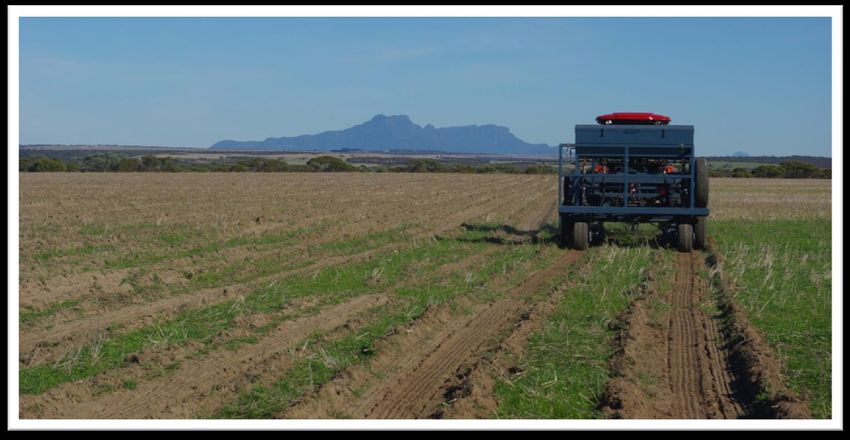
Appendix 1: Results chains ......................................................................................................... 48
Appendix 2: Monjebup North monitoring results for 2012, 2013 and 2014 restoration plots ......... 54
Appendix 3: Monjebup Nth monitoring results from UAV and quadrats for 2012-2015................. 67
Appendix 4: Recovery Wheel for Monjebup North restoration ..................................................... 68
Appendix 5: Bird functional groups .............................................................................................. 69
Appendix 6: Data analysis for bird functional groups ................................................................... 71
Appendix 7: Fauna species predicted to occur in restored mallee heath habitat and those
recorded to 2016 ......................................................................................................................... 94
Appendix 8: Outcomes of recommendations from 2012 report .................................................... 98

                                                                                                                              Page |5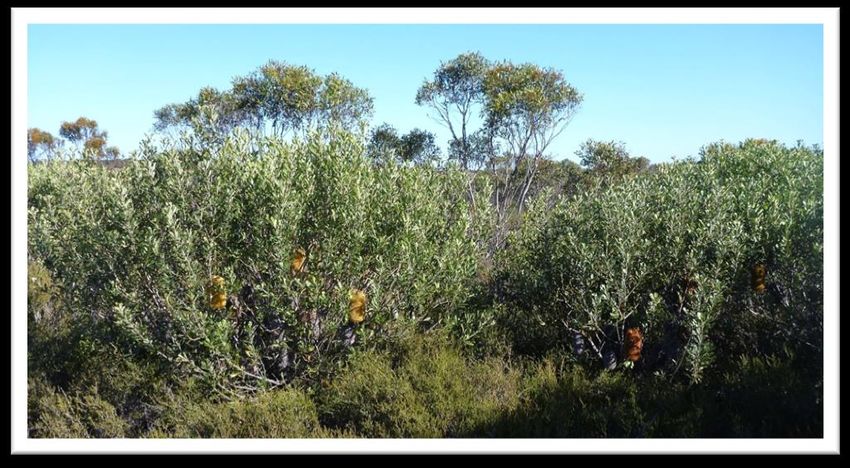
Overview of Fitz-Stirling Project
The Gondwana Link project aims to reconnect 1000 kilometres of country from the south west karri
forest through to the woodlands and mallee bordering the Nullarbor Plain. The overall project
operates at a range of scales across the link.
BHA's contribution to the Gondwana Link project currently focuses on the area between Fitzgerald
River and Stirling Range National Parks – ‘the Fitz-Stirling’ (Figure 2), which is where the most
significant fragmentation of natural landscape across Gondwana Link has occurred and is
consequently where the most concerted connectivity effort is required. In this area we have three
broad strategies:
        1. Protection and conservation management of existing bush.
        2. Ecological restoration to consolidate and restore connectivity in key
        locations.
        3. Supportive land management in the wider landscape, with particular focus on
        upper catchment management.
The second of these, landscape-scale ecological restoration, is the strategy most critical to
achieving the broad vision of reconnected country, is a core focus for BHA’s program on the South
Coast, and is thus also the core focus of this Evaluation Review
In July 2004, a Conservation Action Plan (CAP) for the Fitz-Stirling commenced with support from
The Nature Conservancy and input from BHA, Greening Australia and Gondwana Link Ltd and
many other interested individuals. Since 2004 the Fitz-Stirling CAP has evolved over several
versions with input from a wide variety of people, in particular Angela Sanders and Paula Deegan
as part of the Knowledge Connection Project 2007-2009 and Angela Sanders 2010-2017.

                                              The Fitz-Stirling CAP (as with all of Bush
                                              Heritage’s conservation projects) is planned,
                                              implemented and managed using an adaptive
                                              management process, based on the
                                              internationally-recognised Open Standards for the
                                              Practice of Conservation and its supporting
                                              software, Miradi.
                                              For more information on this process go to: cmp-
                                              openstandards.org

The plan originally identified six Key Conservation Targets (KCTs) and these were aggregated into
the following four Targets after the Evaluation Review in 2012:
   1.    Mallee Heath and Black-gloved Wallaby
   2.    Mallet, Moort and Tammar
   3.    Creeks and Flat-topped Yate Woodland
   4.    Fresh Water Systems

                                                                                         Page |6
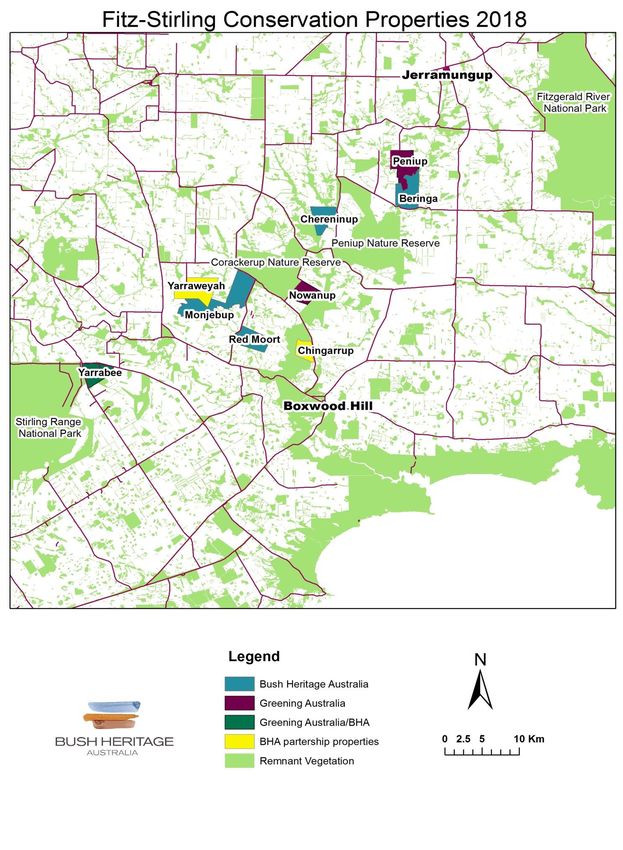
The reserves covered by this report are Beringa, Chereninup Creek, Chingarrup Sanctuary,
Monjebup, Monjebup North, Nowanup, Peniup, Red Moort, Yarrabee and Yarraweyah Falls.
Together these properties cover an area of just over 10,200 ha, which includes around 5,250 ha of
undisturbed bushland. They are owned outright by Bush Heritage Australia (BHA), jointly owned by
BHA and Greening Australia, owned outright by Greening Australia, or owned by private
conservation owners with whom BHA has formal partnership agreements, as shown in the map at
Figure 2. There are additional conservation properties in the Fitz-Stirling that are not included in this
report.
Prior to acquisition the properties were managed as grazing and cropping enterprises and all
contained varying amounts of undisturbed native vegetation that was mostly in good to very good
condition. Commencing in 2003 on Chereninup, restoration projects have been implemented on the
cleared portions of all the properties, either by BHA or by Greening Australia and others, to extend
the area of habitat and increase connectivity between two large nature reserves and Fitzgerald
River and Stirling Range national parks (Table 1). By 2017, large-scale restoration of cleared
country on all properties had been completed, with ongoing projects still in train to infill areas
previously direct seeded to increase the proteaceous component of the restoration on Beringa,
Monjebup North and Yarraweyah Falls.

This report evaluates our conservation impact
This is the second evaluation report for the Fitz-Stirling and it documents progress towards
achieving the goals and objectives articulated in the Fitz-Stirling Conservation Action Plan (CAP)
(September 2017). Specifically, it aims to determine the extent to which the viability, or health, of
our targets has improved since 2006; this is how we measure our conservation impact. The report
also assesses the extent to which our conservation actions are contributing to this improvement,
and recommends any adaptations required to the Fitz-Stirling CAP.
Qualitative and quantitative evidence to demonstrate progress towards expected ecological
outcomes is included. Management interventions implemented by BHA are expected to produce
specific ecological outcomes. The assumed causal relationships between interventions and
ecological outcomes have been explicitly and visually presented as a series of logic models, known
as ‘results chains’ (Appendix 1).
Due to resource constraints, not all attributes are addressed in this report, nor do we have data for
all indicators.
This document is structured to report on each of the four Targets in the Fitz-Stirling CAP.
The report also includes the results of flora and vegetation surveys that have been carried out on
Monjebup/Yarraweyah, Monjebup North, Red Moort and Chereninup reserves. A vegetation survey
of Beringa reserve will be completed over 2018-2020 and the results will be included in the next
evaluation report in 2023.

                                                                                               Page |7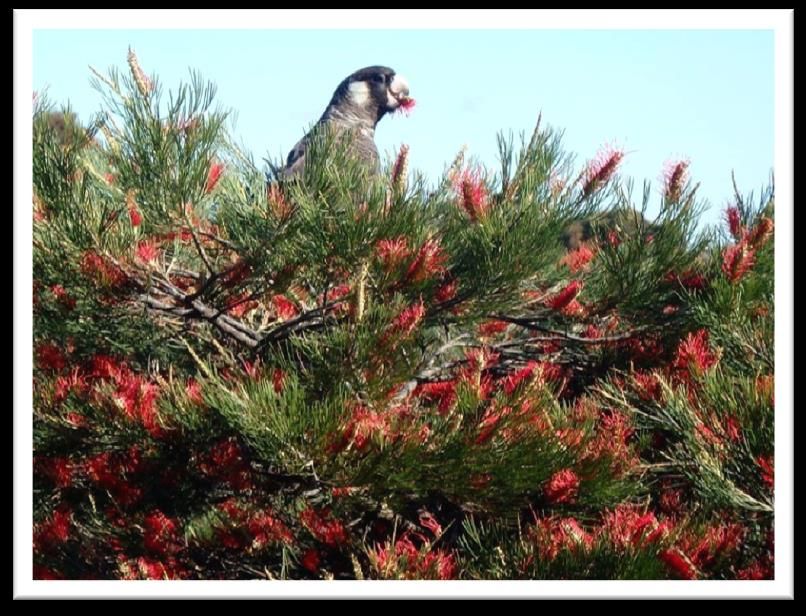
A wide range of indicators are monitored to assess progress
  towards our goals
Our impact is assessed by reviewing collected monitoring data for each Target; specifically the
measures for a set of Indicators chosen as representing the target’s key ecological attributes (see
Glossary of key terms for definitions). This evidence monitors the change in viability, or health, of
the targets, and is summarised into a Viability Table with associated commentary.
The Viability Tables for each Target outline our monitoring approach. They show the key ecological
attributes ( ) and associated indicators ( ) that we use to monitor the health of the conservation
target ( ). Each Indicator sets out 4 points on a scale ranging from a poor state of health through
to a very good state of health. Ratings of Poor or Fair are considered to be below the accepted
range of variability, and therefore warrant closer attention and should trigger management actions.
Our level of confidence in this evidence is also summarised in the table in the source column.
      Rough Guess – Low level of confidence
      Expert Knowledge – Medium level of confidence
      External Research – High level of confidence
      On-site Research – High level of confidence
Comparative viability tables for attributes are also included to summarise the ratings measured at
different points in time. They give an initial baseline condition (where known), current condition and
a desired future viability rating that we are aiming to achieve.

       Looking west over Red Moort Reserve towards Stirling Range National Park

                                                                                             Page |8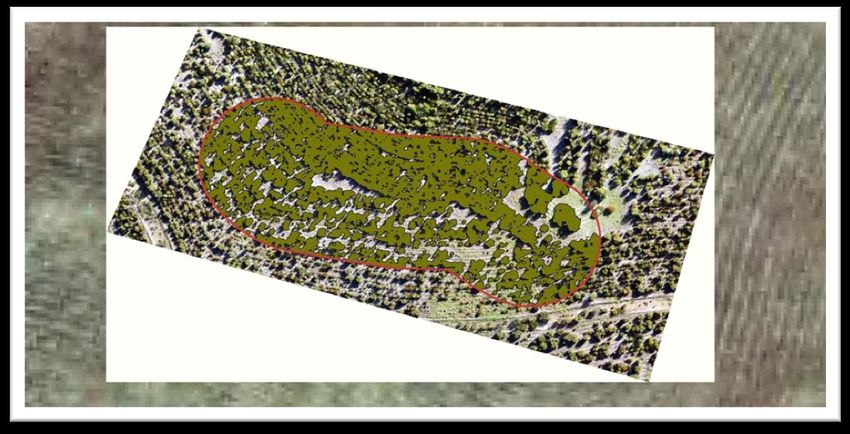
Climate change is influencing ecological processes in the
  Fitz-Stirling
Of the background variables influencing our restoration work in the Fitz-Stirling, the pre-
eminent one is climate change. For the south coast of Western Australia the predictions are
for mean annual temperatures to continue increasing and for the drying trend to continue.
Rainfall seasonality is also predicted to continue to change to higher summer rainfall and
lower winter and spring rainfall (www.agric.wa.gov.au).
Our monitoring program is not designed to assess the impacts of climate change and
therefore no interpretation of our results in relation to this variable has been made. Figure 1
below shows the mean monthly rainfall for the Fitz-Stirling (data from Jerramungup) from
1962 to 2017 and also for the period over which BHA has managed the properties – 2002-
2017.

                      60

                      50

                      40
      Rainfall (mm)

                      30

                      20

                      10

                       0
                           Jan   Feb   Mar     Apr   May      Jun     Jul   Aug   Sep   Oct   Nov   Dec

                                             Mean 1962-2017         Mean 2002-2017

   Figure 1: Mean monthly rainfall from Jerramungup recording station 1962-2017

                                                                                                          Page |9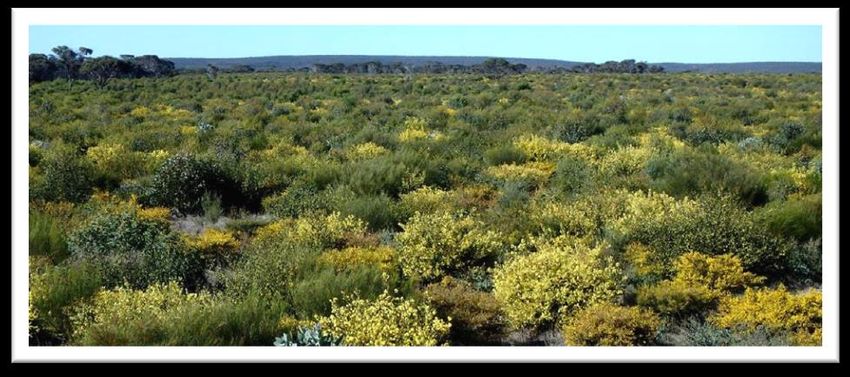
Figure 2: Properties included in this report

                                               P a g e | 10
Property Name Total Year Area Restoration Area of natural Sandalwood
Area Purchased/ revegetated date regeneration (ha)
(ha) partnered (ha) after clearing (ha)
Chingarrup 572 2002 40 2005 341 Nil
(partner property) 26 2007
Chereninup 898 2003 60 2003 12 Nil
Nowanup 754 2006 340 2006-2017 200 Nil
Yarrabee 923 2006 510 2006 190 90
Monjebup West 1021 2007 29 2014-2017 180 32
Beringa 1200 2007 100 2016 339 Nil
Peniup (GA) 1200 2007 946 2008-2015 Nil 203
Monjebup North 1107 2009 424 2012-2017 281 Nil
Yarraweyah Falls 1499 2012 100 2013 Nil 200
(partner property)
Red Moort 1037 2014 17 2015 303 Nil
Totals 10,211 2,592 1,846 525
Table 1: Details of properties managed or co-managed by BHA in the Fitz-Stirling
Four Conservation Targets are used to
measure our progress
Conservation Target 1: Mallee Heath and Black-gloved Wallaby
To aid operational planning and management and monitoring activities, this Target combines
targets that were previously listed separately in the CAP (2007). It incorporates the Proteaceous
Rich Community target and expands it to include the broader mallee heaths in which these
shrublands are located. It also includes the Black-gloved Wallaby, as they are dependent on the
mallee heath for habitat.
The original Proteaceous Rich Community target is now included as a nested target under the
mallee heath target and comprises the Threatened Ecological Community that was listed under the
EPBC Act (1999) in 2013 (Proteaceae dominated kwongkan shrublands of the southeast coastal
province of Western Australia).
Mallee heath is a generic term used to describe vegetation that has both a mallee and a heath
component. The mallee component in the Fitz-Stirling comprises shrub mallee (see Muir 1977), or
multiple stemmed mallee, usually with a canopy cover of 1-75% and includes many species of
eucalypt. The heath component in the Fitz-Stirling generally comprises woody vegetation to 2m in
height with a canopy cover of between 30-100%, this can also be termed ‘shrubland’ depending on
its structural components. The heath or shrub stratum is usually dominated by species from the
Proteaceae or Myrtaceae families. A large proportion of this vegetation type was cleared for
agriculture in the 1950s and 1960s. It is the plant community heterogeneity across the landscape
that makes the Fitz-Stirling mallee heath unique and rich in plant species. This plant community is
responsible for its designation as a biodiversity hotspot, mainly due to floristic diversity that is under
serious threat. The majority of restoration that has taken place across the cleared portions of each
property has been designed to recreate, as far as practicable, the mallee heath communities that
occurred there prior to clearing.
P a g e | 11The Black-gloved Wallaby is one of a number of the original mammal species that appear to have
declined in the Fitz-Stirling. Both fragmentation of habitat and introduced predator pressure are
likely to be responsible.
Nested targets include:
Small native mammals – the threatened Dibbler (Parantechinus apicalis) and Western Mouse
(Pseudomys occidentalis) and the Honey Possum (Tarsipes rostratus).
Threatened birds – Carnaby’s Cockatoo (Calyptorhynchus latirostris), Western Whipbird
(Psophodes nigrogularis).
Plants – Chittick (Lambertia inermis) and banksia species.
Threatened Ecological Community – ‘Proteaceous dominated kwongkan shrublands of southeast
coastal floristic province of Western Australia.’
Goals for this target:
Target Goal Progress to 2017
Mallee Heath By 2023, increase the extent of Mallee Heath by 2,624ha of mallee heath
and Black- 5,000ha and include at least 500 ha of established, including 21ha of
gloved Proteaceae dominated shrubland to a 3-4 star proteaceous rich component. A 3.8
Wallaby standard (SERA 2017)*. star standard achieved overall.
By 2023, increase the level of occupancy of Level of occupancy at 50% in 2015
Black-gloved Wallabies to greater than 50% in
restored sites.
By 2023, have a feral animal control plan Feral animal control plan has been
completed and implemented and monitored for initiated
at least 3 years
*Society for Ecological Restoration Australasia national standards for the practice of ecological restoration in Australia.
The table below shows how we assess the health of this target. Each Key Ecological Attribute
(green key) has one or more indicators (purple triangles), with metrics to show the range of
variability. Additional tables then show, for each indicator, the baseline viability measure, the latest
viability measure and a desired future viability measure. The desired future measure is the
conservation goal for the target.
Mallee heath on Red Moort Reserve
P a g e | 12Item Poor Fair Good Very Good Measure description Source
Mallee Heath and Black-gloved Wallaby
Mallee heath – community size
Extent - mallee heath 2003- 11 Number of species Onsite
species species species species detected Research
Restoration - bat activity
Bat activity - C. gouldii, C. 80% Bat activity at restored Onsite
morio, M. kitcheneri, T. australis, sites as a percentage Research
V. regulus of activity at reference
sites
Black-gloved Wallaby distribution and habitat restoration
Black-gloved Wallaby 0% 1-25% 26-75% 76-100% % of restored sites Onsite
presence/absence - restored sites where wallabies have Research
been detected
Area of Black-gloved 0-50ha 51- 2501-9 >10 000ha Hectares of restored Onsite
Wallaby habitat restored 2500ha 999ha wallaby habitat Research
Table 2: Mallee heath and Black-gloved Wallaby viability measures
P a g e | 13Progress towards the goals for Mallee heath and Black-gloved
Wallaby:
1. Extent of restored mallee heath has increased from 60 to 2,624 hectares
Baseline Viability Current Viability Future Viability Goal
Item Year Rating Year Rating Year Rating
Mallee Heath Community Size
Extent – Mallee heath 2003 Poor 2017 Good 2023 Very Good
Extent – Proteaceous rich 2013 Poor 2017 Poor 2023 Very Good
Symbol Key Key Ecological Attribute Indicator
This indicator has been calculated using data from Fitz-Stirling BHA and partner properties and includes
all mallee heath restoration and natural regeneration sites. A total of 2,624 hectares have been restored
since 2003. Restoration of mallee heath vegetation was the goal on Chingarrup, Chereninup, Beringa,
Peniup, Monjebup, Monjebup North, Red Moort and Yarraweyah.
To increase the extent of mallee heath by 5,000ha by 2023 means that we need to revegetate/regenerate
a further 3,833ha over the next 6 years. Given the current average of 187ha/year this is a stretch goal that
will require the purchase/partnership of at least three properties over the next 6 years. The restoration rate
will also need to increase to around 400ha/year. These restoration/regeneration projects would need to
include at least 480ha of Proteaceous rich vegetation (21ha have currently been completed at a cost of
$60,000).
Recommendation: Plan to acquire at least 2,376ha for restoration over the next 6 years.
Alternatively adjust the goal downwards based on the current restoration rate.
2. Undisturbed mallee heath vegetation is in very good condition
Baseline Viability Current Viability Future Viability Goal
Item Year Rating Year Rating Year Rating
Mallee Heath Community Condition
Vegetation cover 2009 Good 2015 Very Good 2023 Very Good
Symbol Key Key Ecological Attribute Indicator
Reference sites were first monitored in 2009 and they were chosen to provide a model for assessing the
development of restored sites. The reference sites chosen for assessing the restoration on Monjebup
North are the best we could find given that we are lacking accurate information on the plant communities
that were in place prior to clearing.
The condition of the reference, or undisturbed, mallee heath community is monitored using the standard
50m transect methods. The indicator chosen is the mean % intercept of all strata of all mallee heath sites.
From 2009 to 2015, at the 15 monitoring sites, the cover varied between good (14.5%) and very good
(25.9%). This fluctuation could be attributed to observer bias, changes to methods over the sampling
years and/or rainfall or to another unknown factor or factors. It is assumed from our monitoring that an
intercept value of between 20-30% is 'normal' or very good for these mallee heath communities. Longer
term monitoring will confirm this.
P a g e | 143. Vegetation that has been established on cleared farmland is developing
well
Baseline Viability Current Viability Future Viability Goal
Item Year Rating Year Rating Year Rating
Restoration success
Plant genera establishment - 2012 2012 Fair 2015 Good NA NA
restoration
Plant genera establishment - 2013 2013 Very Good 2015 Good NA NA
restoration
Plant genera establishment - 2014 2015 Good 2017 Good NA NA
restoration
Stem density - 2012 restoration 2012 Fair 2015 Good NA NA
Stem density - 2013 restoration 2013 Good 2015 Good NA NA
Stem density - 2014 restoration 2015 Poor 2017 Poor NA NA
Symbol Key Key Ecological Attribute Indicator
Measures for this indicator were all carried out on Monjebup North.
For restored mallee heath sites the method used for the first 3 years after seeding was quadrat based,
where plants were identified to genera and then counted. This resulted in genera richness counts and
stem densities per hectare. This initial method helped to identify which genera were successful in the
revegetated areas and how densely they had established. This has since been used to improve
restoration techniques. At the restoration monitoring sites 50m transects will be established in the future
and quadrats will be phased out. A comparison will then be able to be made between the intercept values
of each strata between restored and reference sites. Quadrat based monitoring will continue at newly
revegetated sites on new properties.
Plant genera establishment on Monjebup North fluctuated over the three years of restoration (Figure 3).
The sites revegetated in 2012 had a total of 34 genera in the seed mixes. The first monitoring period
recorded just 8 genera which increased slightly to 12 for the second monitoring and then decreased again
to 9 for the third survey. Twenty two genera were included in the 2013 restoration with just 9 being
recorded in the first survey, 8 in the second which prompted the hand planting of around 30,000 seedlings
to boost the number of genera and stems per hectare. The third survey saw a slight increase to 10
genera. Of the 34 genera included in the 2014 planting only 11 were present in the first survey, 17 in the
second and 14 in the third. The results from 2012 and 2014 tend to indicate that not all genera germinate
within the first few months after planting and can appear up to 2 years post seeding.
The genera having the highest germination and subsequent survival include Acacia, Allocasuarina,
Calothamnus, Eucalyptus, Gastrolobium, Hakea and Melaleuca (Appendix 2). Several species are
included within these genera with Eucalyptus and Melaleuca having the highest number of species
surviving. An analysis should be carried out to ascertain which genera/species did not germinate/survive
and, if possible, establish possible causes. This information should then be incorporated into future
projects.
Recommendation: Carry out a detailed analysis of plant germination and subsequent survival in
the restoration on Monjebup North and use the results of this to improve future projects.
Recommendation: Standardise the number of monitoring sites in restored areas to at least one
quadrat or transect per 10 ha per plant community.
P a g e | 1540
35
30
Number of genera
25
2012
20
2013
15
2014
10
5
0
Total genera Monit 1 Monit 2 Monit 3
planted
Figure 3: Plant genera establishment on Monjebup North for restoration completed
in 2012, 2013 and 2014
The indicator rating for stem density is not a simple linear relationship in that sites having a stem density
of less than 3,000 or greater than 15,000 stems per hectare are given a rating of ‘poor’. Using
observational data and experience we believe that a stem density of less than 3,000 results in a very
sparse plant community where weeds can thrive and fauna habitat is of lower value i.e. lower bird, reptile
and mammal activity and species richness. Stem densities greater than 15,000 stems per hectare result in
plants being crowded and therefore competition for water and nutrients is higher and plants don’t thrive
and often show signs of insect damage. These observations have not been confirmed with monitoring but
this should be incorporated into future monitoring of restoration.
This could possibly be achieved by using UAV (unmanned aerial vehicle or drone) based monitoring. In
2017 a pilot project was carried out to assess the use of UAV derived imagery to assess vegetation health
and temporal vegetation change in Monjebup North restoration. This was carried out by leveraging high
resolution data to isolate vegetation only pixels, and then use two vegetation indices to derive insights into
the variability of vegetation cover. The indices were normalised difference vegetation index (NDVI) and
red edge band. NDVI is a measure of healthy, green vegetation and red edge band is able to detect early
stages of plant stress, expressed as changes in chlorophyll content. The results of this trial showed that it
may be possible to pick up early stages of plant stress related to a drop in chlorophyll content using this
method of monitoring. However ground-truthing is required to confirm the results before this method can
be used with confidence.
Recommendation: Correlate monitoring data with plant health in future surveys of restoration.
Recommendation: Continue monitoring the impact of plant stocking rates on restoration.
Recommendation: Further trial the use of UAV monitoring to assess vegetation health and
temporal vegetation changes in restoration and reference vegetation.
In addition to on ground monitoring a UAV (unmanned aerial vehicle) monitoring survey was trialled on
Monjebup North in 2016. The scope of the project was to provide high resolution 3D aerial images of 12 x
100m transects on Monjebup North for the purpose of monitoring vegetation growth utilising UAV
technology in a repeatable and non-subjective process.
The UAV data generated is useful in that it gives alternative monitoring options to ground-based, manual
surveys. It enabled vegetation profiles, canopy height, extent of cover and stem density data to be
generated. However, large variations between manually monitored and UAV monitored sites were
identified, particularly with stems/ha (see Appendix 3). This needs further investigation prior to future UAV
surveys.
P a g e | 16Recommendation: Further investigate the variations in results between UAV and ground-based
monitoring on Monjebup North.
An additional evaluation of the restoration has been carried out on Monjebup North using the ‘star’ system
developed by the Society for Ecological Restoration Australasia (SERA 2017). This system has been
designed to evaluate the progression of an ecosystem along its recovery trajectory. The indicators used to
describe the recovery at Monjebup North have been evaluated using both formal and informal
assessments. The assessment and recovery wheel included in Appendix 4 gives the degree to which the
restoration has achieved its ecological goals since the property was acquired in 2009.
The assessment indicates a rating of between 3-5 stars for each attribute category or an average rating of
3.8 overall. It shows that we can improve what we do in the area of invasive species control and we are
planning an integrated feral cat, fox and rabbit control program over some of our properties.
Desirable plants in the revegetated areas are currently at a level of around 25% of the potential native
species in reference sites. In a flora diversity hotspot it is currently difficult to achieve a 5 star rating owing
to a lack of knowledge of or difficulty in seed collecting, propagation and seeding techniques. Given the
diverse flora of the area it is highly unlikely that advances in knowledge and technology will allow the
inclusion of greater than 80% of reference site species that is required for a 5 star rating in this category in
the near future. This then flows on to affect the potential for a 5 star rating for community structure and
ecosystem function.
Recommendation: Support research into the techniques for native plant establishment in the Fitz-
Stirling whenever possible, in particular the establishment of members of the Restionaceae and
Cyperaceae families.
4. Fire remains a key area requiring focus
Baseline Viability Current Viability Future Viability Goal
Item Year Rating Year Rating Year Rating
Time since fire
Fire age category 2012 Poor 2017 Poor 2032 Very Good
Symbol Key Key Ecological Attribute Indicator
This indicator has been developed using the results of the University of Queensland (UQ) project and
published paper Tulloch et al 2016 ‘Fire management strategies to maintain species population processes
in a fragmented landscape of fire-interval extremes’.
Many of the plant species within mallee heath communities have very specific fire requirements (e.g.
resprouters, transient seed bank and exclusive pyrogenic reproduction) and need a sufficient inter-fire
period to ensure continued populations. Species composition is therefore expected to vary depending on
fire history, and the "optimal" fire regime potentially differing between species within each community. It
has been observed on many of our properties that Banksia media plants are collapsing, most likely due to
senescence. Unfortunately this species was not included in the UQ research as life history data was
lacking. Flora and vegetation surveys on Monjebup, Monjebup North, Yarraweyah, Red Moort and
Chereninup have confirmed the presence of senescent vegetation.
Determining the specific fire regime that is optimal for maintenance of mallee heath communities across
the Fitz-Stirling area is complex and can be simplified by using keystone species like Banksia to guide
management.
Tulloch et. al. used matrix population models to predict population growth of seven different Banksia
species under different environmental conditions and patch connectivity, and to evaluate the sensitivity of
species survival to different fire management strategies and burning intervals. The management scenarios
P a g e | 17included no burning, periodic management burning, random wildfire only and current wildfire and periodic
management burning. These models predict that all strategies result in the local patch extinction of at
least one species. A strategy of no fire always leads to fewer species persisting than prescribed fire or
random wildfire, while too-frequent or too-rare burning regimes lead to the possible local extinction of all
species. Prescribed fire may reduce or increase extinction risk when applied in combination with wildfire
depending on patch connectivity.
The indicator that has been developed, % extent of mallee heath in each fire age category (years since
last fire), is intended to a) provide a baseline of the current condition and b) a measure of future
management actions (prescribed fire). This measure has been applied to BHA properties only and it is
acknowledged that broader scale fire management is required across the Fitz-Stirling but at 2017 this has
not been discussed with other stakeholders or landholders.
Although we don't yet have adequate knowledge of what the optimal distributions of fire ages are across
the mallee heath communities, our best guess given the UQ modelling results is to achieve between 27-
30% of mallee heath in the 0-15 years fire age category. The ‘future status’ result can now be
translated into a prescribed burning plan for future implementation on BHA properties. The total extent of
mallee heath on BHA properties has been calculated as approximately 3,600 ha (using vegetation maps
by Sandiford and Newbey). Currently only 2% of this falls within the 0-15year fire age category which
means approximately 900 ha (or 25%) should be burnt over the next 15 years.
Recommendation: Plan for prescribed burning to take place over a total of 900ha of mallee heath
on BHA properties by 2032.
5. Bird monitoring shows that our restored areas are providing
increasingly suitable bird habitat
Bird data analysis for this report has been carried out using bird functional groups rather than feeding
guilds, as was used in the last Ecological Outcomes Performance Report (Sanders 2012).
“The guild concept refers primarily to the mechanisms of resource sharing by species in a competitive
context whereas the functional groups concept is concerned with how a resource or any other ecological
component is processed by different species to provide a specific ecosystem service or function.”
(Blondell 2003)
As an example the functional group containing leaf gleaners, such as Striated Pardelote, Spotted
Pardelote and Weebill, provides an ecosystem service by feeding on insects that can damage tree shoots
and leaves. One such insect belonging to the Psyllid family constructs sweet waxy secretions called lerp
on eucalypt leaves to protect its sap-sucking larvae, these lerp are eaten by the leaf gleaning birds.
In the context of revegetated areas we are interested more in the ecosystem services provided by the
birds and how the functional groups differ in their activity and species richness in these areas compared
with their respective reference sites. The functional groups for the Fitz-Stirling were developed in liaison
with Nic Dunlop (Conservation Council WA) who is also using this partitioning to analyse data collected
through the Citizen Science bird banding and survey project on Chingarrup Sanctuary and other
conservation reserves in the Gondwana Link pathway.
The data included in this analysis covers the monitoring periods from October 2006 to October 2016.
A table showing the bird species within each functional group is given in Appendix 5. The data analysis
methods, sites analysed and tables and graphs showing the P values of data derived from Bird Minutes
surveys are given in Appendix 6.
P a g e | 186. Bird activity and species richness increased over time at revegetated
sites
Bird activity levels and species richness within the different restoration age classes varied depending upon
the functional group (Fig 3, see Appendix 6 for data).
Data for species richness was analysed both for the number of species and for that number expressed as
a proportion of the total species pool for that functional group. The results demonstrated similar
relationships to bird activity levels with restoration age (see Appendix 6 for data).
Property Nectivorous Resident Resident Resident Ground
Resource Understorey Ground Honeyeaters Foraging
Nomads Foragers Foragers Open
Mallee Heath, Mallee Heath, Woodland,
Thicket Thicket Grassland
Peniup NSS NSS NSS NSS
Carbon
Beringa NSS NSS NSS NSS
Chereninup NSS NSS NSS NSS
Chingarrup NSS NSS NSS
Monjebup Nth
Yarrabee NSS NSS NSS
Key : Activity Species Richness NSS – Results not statistically significant
Figure 4: Restoration - functional group increases with increasing vegetation age
Resident Honeyeaters (RHE), which included 7 species, had the clearest increases in activity and species
richness associated with restoration age (Figure 3). Prior to restoration there were none of these species
present and our results show that they have been gradually increasing in activity and species richness as
the restoration develops.
Nectivorous Resource Nomads (NRN), which included 8 species, increased in activity and species
richness at Monjebup North and activity at Yarrabee.
Resident Ground Mallee Heath (RGF) birds, which included 6 species, increased significantly in activity
and species richness at Chereninup and Chingarrup. The restoration on these properties is 14 years and
12 years old respectively and the areas are in close proximity to remnant vegetation.
Yarrabee had the most significant results with Nectivorous Resource Nomads NRN) and Resident
Understorey (RUF) bird activity increasing significantly with restoration age. Yarrabee adjoins the Stirling
Range National Park and sits within a different vegetation association to the other Fitz-Stirling properties,
which may account for these results.
P a g e | 197. Bird activity increased at reference sites
Bird activity levels in the reference sites showed some similarity to the revegetated sites and also some
differences (Figure 4).
Property NRN RUF RGF RHE
Beringa NSS NSS
Chereninup NSS NSS
Chingarrup NSS NSS NSS NSS
Monjebup NSS NSS
Nth
Yarrabee NSS NSS NSS
Key : Activity Species Richness NSS - Results not statistically significant
Figure 5: Reference sites - functional group changes with increasing vegetation age
Resident Honeyeaters (RHE) exhibited the most consistent increases over time at three sites. Nectivorous
Resource Nomads (NRN) increased in activity at Monjebup and Beringa. Resident Understorey (RUF)
birds increased at Chereninup and Resident Ground Mallee Heath (RGF) birds also increased significantly
in activity at Monjebup Reserve.
Few significant increases were observed for species richness in reference plots, and no particular
functional group or property experienced uniform increases in species richness. Note that no reference
site exists for the Peniup carbon planting site.
Carnaby’s Cockatoo feeding on restored Grevillea tetragonoloba at Beringa
P a g e | 208. Bird activity increased at naturally regenerating sites
The naturally regenerating sites comprised a range of vegetation associations and varying ages since
previous clearing. These sites were included to track how bird activity and species richness changed with
the age of the regenerating habitat.
Property NRN RUF RGF RHE GFG
Beringa NSS NSS NSS
Yarrabee NSS NSS
Key : Activity Species Richness NSS – Results not statistically significant
Figure 6: Regenerating sites – functional group changes with increasing vegetation age
Five naturally regenerating sites exhibited changes in activity within particular functional groups (Table
Figure 5). At Yarrabee Ground Foraging Grassland (GFG) birds, which included 15 species, decreased in
activity, which was expected as these species are less suited to the habitat that is regenerating on
Yarrabee.
Resident Honeyeaters (RHE) and Resident Understorey (RUF) birds both increased in activity at
Yarrabee.
At Beringa, activity of Nectivorous Resource Nomads (NRN) and Resident Ground Mallee Heath (RGF)
birds both increased dramatically over ten years. The regenerating vegetation at these sites is developing
well as it was not grazed or cropped after the initial clearing.
No particular functional group responded uniformly well to regeneration across sites. This may be
explained by the very different vegetation structure and composition between sites.
At Yarrabee Ground Foraging Open Woodland (GFG) birds decreased and Resident Honeyeaters (RHE)
increased in species richness, both disproportionately in relation to the total species pool.
9. Nectivorous resource nomads and resident understorey birds
increased more in restored sites than in reference sites
A mixed model analysis was carried out using further assessments of revegetated sites, pairing the sites
with appropriate reference vegetation sites. Mixed models were then used to compare the trajectories of
restoration sites with those of the reference sites over the same period. The analysis looked at reference,
natural regeneration and restored sites as ‘treatments’ and considered each with respect to age class (see
Appendix 6).
Restored mallee heath provides bird habitat
P a g e | 21Functional Group Restoration Reference
Nectivorous Resource Monjebup Peniup Chingarrup Monjebup Beringa Chingarrup
Nomads Nth Carbon Nth Carbon
Resident Understorey Monjebup Peniup Monjebup Beringa
Foragers Nth Carbon Nth Carbon
Resident Old Growth Chereninup Chereninup
Resident Ground Mallee Chereninup Chingarrup Chereninup Chingarrup
Heath
Resident Honeyeaters Beringa Chingarrup Beringa Chingarrup
Carbon Carbon
Leaf Gleaners Beringa Chingarrup Beringa Chingarrup
Carbon Carbon
Key : Activity Species Richness
Figure 7: Mixed model analyses of revegetated and reference sites
At Monjebup, there were very few significant Year x Treatment interactions which would indicate different
response for restoration and reference vegetation from year to year (Figure 6). Most increases in activity
or species richness were matched by similar increases in the reference sites (See Appendix 6). The
exceptions were Nectivorous Resource Nomad (NRN) activity and the proportion of Resident Understory
species (RUF), which increased more in restoration than in reference sites.
Chereninup Creek Reserve was characterised by a relative increase in Resident Old Growth (ROG) and
Resident Ground Mallee Heath (RGF) activity, compared with reference sites. Resident Ground Mallee
Heath (RGF) species richness was increasing in the restoration, while declining in the reference site. As a
proportion of the total species pool, Resident Ground Mallee Heath (RGF) species richness was
increasing in the restoration while declining in the associated reference site.
P a g e | 22The Peniup carbon planting was characterised by increasing activity in Resident Honeyeaters (RHE),
Nectivorous Resource Nomads (NRN) and Resident Understory (RUF) birds, which was matched in the
adjacent reference site. Leaf Gleaners (LG) and Resident Honeyeaters (RHE) were increasing in species
richness over time toward that found in the associated reference site. As a proportion of the total species
pool, Resident Honeyeaters (RHE) increased from a baseline of zero.
Chingarrup was characterised by a general decline in Leaf Gleaners (LG) activity at restoration and
reference sites, an increase in Resident Ground Mallee Heath (RGF) activity at the restoration site, and
general increase in Resident Honeyeaters (RHE) activity at the restored and reference sites. Nectivorous
Resource Nomads (NRN) species activity increased at restoration and reference sites while and Resident
Ground Mallee Heath (RGF) species richness increased at the restoration sites. As a proportion of the
total species pool, species richness of Leaf Gleaners (LG) declined at reference and restoration sites,
while that of Nectivorous Resource Nomads (NRN) and Resident Ground Mallee Heath (RGF) increased
in proportion at both site types.
10. Bird assemblage similarity depends on the treatment and age of
restoration.
An analysis of bird assemblage dissimilarity (or cluster analysis), using 2016 data, between remnant,
restored and naturally regenerating sites shows that it depends on the treatment and age of restoration
(Figure 8).
Figure 8: Dendrogram illustrating the compositional similarity of bird assemblages between
properties and management types in 2016. (Different colours indicate significant differences amongst samples.
Distance on the y-axis is 1-Bray Curtis index, based on the bird activity index. Dendrogram is produced using Average Linkage).
The vertical axis of the dendrogram above represents the distance or dissimilarity between clusters. The
horizontal axis represents the objects and clusters and our main interest is in similarity and clustering.
The remnant vegetation sites on Chingarrup, Monjebup, Beringa and Chereninup, together with the
restored sites on Chingarrup and Monjebup North, form a cluster. The regenerating Bering site,
Yarraweyah remnant site, restored Monjebup Nth and Yarraweyah sites form a second cluster. The
regenerating Chereninup site is on outlier and this is expected and is due to its woodland plant community
having a different bird assemblage to all the other sites.
P a g e | 23Recommendation: Continue bird surveys at restoration, reference and naturally
regenerating sites using bird minutes if possible and carry out bird activity, mixed model
and cluster analysis.
11. Ground dwelling fauna species richness has increased in restored
areas
Baseline Viability Current Viability Future Viability Goal
Item Year Rating Year Rating Year Rating
Restoration - presence of ground dwelling fauna
Native mammal species richness 2012 Fair 2016 Good 2023 Very Good
Reptile species richness 2012 Poor 2016 Good 2030 Very Good
Symbol Key Key Ecological Attribute Indicator
This analysis incorporates results from pitfall, Elliott and cage trapping that is carried out at 11 restoration
sites at Monjebup Nth, one at Chereninup, two at Chingarrup, three at Beringa and two at Yarraweyah to
record the vertebrate fauna at the sites. Pygmy Possum nest boxes were installed at Yarraweyah in 2016
and at Monjebup North in 2017. The results of these surveys are combined to generate the results used in
this indicator. Insufficient data precludes statistical analysis, so these results document the
presence/absence of species recorded during systematic trapping, scat and track surveys, net box
monitoring and camera trapping. During 2017 a further 3 traplines were installed in the Chereninup
revegetated area to provide a wider coverage of this property.
In 2012 just two species of native ground dwelling mammals were recorded using the revegetated areas,
the Western Grey Kangaroo (Macropus fuliginosus) and the Western Pygmy Possum (Cercartetus
conncinus). In 2016 four species were recorded, the Western Grey Kangaroo, Black-gloved Wallaby
(Notamacropus irma), Honey Possum (Tarsipes rostratus) and Echidna (Tachyglossus aculeatus). In
2017 Pygmy Possums were recorded using the artificial nest boxes on Monjebup North bringing the
ground dwelling native mammal species count to 5. The introduced Fox, Feral Cat, Rabbit and House
Mouse were also recorded in the restored areas.
Reptile species richness is relatively low in the restored areas with just two species recorded in 2012,
Menetia greyii and Hemiergis peronii. By 2016 nine species were recorded, Acritoscincus
trilineatus,Tiliqua rugosa, T. occipitalis, Notechis scutatus, Menetia greyii, Morethia obscura, Hemiergis
peronii, Pseudonaja affinis and Pogona minor.
A total of five frog species has been recorded in the restored sites; Western Banjo Frog (Limnodynastes
dorsalis), Turtle Frog (Myobatrachus gouldii), Spotted-thighed Frog (Litoria cychlorynchus), White-footed
Frog (Neobratrachus albipes), Granite Froglet (Crinea pseudinsignifera) and White-spotted Frog
(Heleioporus albopunctatus).
We expect that by 2023, if the vegetation and subsequent habitat continues on its current trajectory, a
total of 20 mammal and 31 reptile species will be recorded at the revegetated sites (see Appendix 7).
Recommendation: Continue vertebrate fauna surveys at revegetated sites on Beringa,
Chereninup, Monjebup and Yarraweyah and reference sites on Corackerup Nature
Reserve.
P a g e | 2412. Seven bats species have been recorded in the restored areas
Baseline Viability Current Viability Future Viability Goal
Item Year Rating Year Rating Year Rating
Restoration - presence of bat species
Bat activity - C. gouldii NA NA 2016 Fair 2023 Very Good
Bat Activity - C. morio NA NA 2016 Fair 2023 Very Good
Bat activity - M. kitcheneri NA NA 2016 Very Good 2023 Very Good
Bat activity - T. australis NA NA 2016 Very Good 2023 Very Good
Bat Activity - V. regulus NA NA 2016 Good 2023 Very Good
Symbol Key Key Ecological Attribute Indicator
Comparisons of bat species richness and activity between reference sites (2011-2016) and restored sites
(2013-2016) have given us an indication of how the restored plant community is supporting bat
populations.
The indicator for bats is a comparison between bat activity at restored sites against that at reference sites.
Recordings of their calls were used to calculate their activity at each site. As so little is known about bats
in restored areas the data we are collecting is baseline and therefore it is difficult to set viability ratings at
this stage. Data analysis at Oct 2017 suggests that each species has responded to the restoration in a
different way, so they have been analysed separately.
Seven species were recorded and all are using the reference, restored and paddock sites to different
degrees. With species richness thus the same at all sites, activity is the key indicator of habitat value for
these species. The species are Gould’s Wattled Bat (Chalinolobus gouldii), Chocolate Wattled Bat
(Chalinolobus morio), South-west Free-tail Bat (Mormopterus kitcheneri), Southern Forest Bat
(Vespadelus regulus), White-striped Free-tail Bat (Austronomus australis),Lesser Long-eared Bat
(Nyctophilus geofroyii) and Long-eared Bat (Nyctophilus major, subspecies unknown). Activity of both
long-eared bat species was very low across all sites, so neither species was included in the analysis.
White-striped Free-tail Bat (Austronomus australis)
P a g e | 25Species Restoration Reference
Gould’s wattled bat
Chocolate wattled bat
South-west free-tail bat
Southern forest bat
White-striped free-tail bat
Key: Relative activity
Figure 9: Relative activity of bat species in restoration and reference sites
Gould’s Wattled Bat and South-west Free-tail Bat activity is higher at the restored sites than at the
reference sites. Chocolate Wattled Bat and Southern Forest Bat activity is lower at the restored sites. The
White-striped Free-tail Bat activity is much the same at the restored and reference sites (Figure 9). It is
expected that as the vegetation at the restored sites develops, the similarity of bat activity between
restored and reference sites will increase.
It appears that very little research has been carried out on bat activity in revegetated areas to date. The
literature that exists suggests that most bats do not like clutter (dense vegetation).
Dr Brad Law (NSW Dept. Primary Industries) said “What the bats dislike is dense understorey cover that
is typical of young fast growing plantings. Trees and bushes impede their echolocation, although bats are
attracted to vegetation edges".
Craig Grabham (Charles Sturt Uni) investigated bat activity in six habitat types - cleared paddocks, linear
restoration, patch restoration, linear remnants, patch remnants and continuous remnants – and found bats
use restoration more than cleared paddocks but less than remnant vegetation.
Volunteer, Richard Thomas, with the assistance of University of Western Australia students, is currently
developing machine learning to automate bat call identification. This will ensure that a more accurate and
consistent method of call identification is used to provide the data for analysis of bat activity in the future.
Our ongoing monitoring of bat activity will contribute to the sparse body of knowledge that exists.
Recommendation: Continue bat call detection monitoring at revegetated and reference
sites.
Recommendation: Continue to support Richard Thomas in automated bat call
development.
P a g e | 26You can also read