SEAFOOD RISK ASSESSMENT - NEW ZEALAND INSHORE TRAWL FISHERY - OPENSEAS
←
→
Page content transcription
If your browser does not render page correctly, please read the page content below
Seafood Risk Assessment
        New Zealand Inshore Trawl Fishery

Prepared for the OpenSeas Programme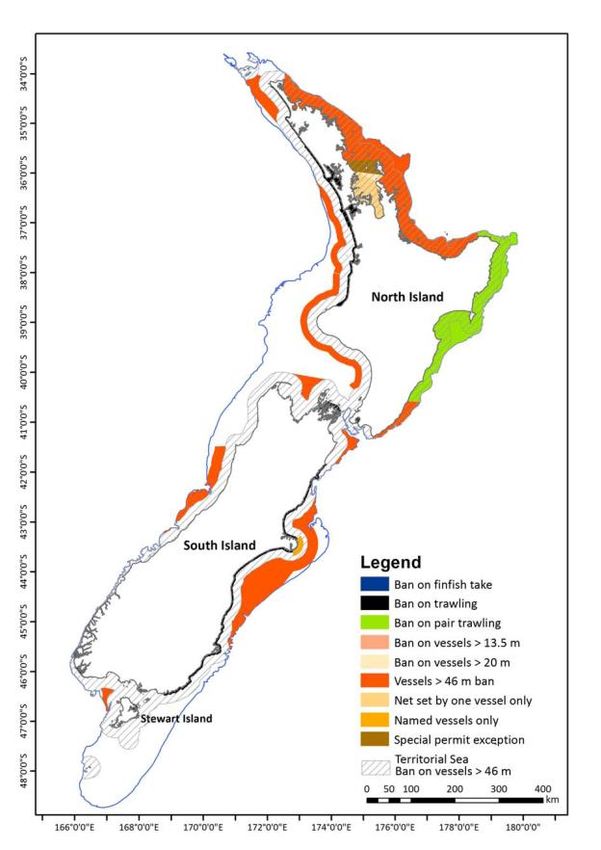
Assessment Summary
Unit/s of Assessment:
Product Name/s: Barracouta, Flatfish, Trevally, Red gurnard, Tarakihi
Species: Thyrsites atun
Colistium nudipinnis, Peltorhamphus novaezelandiae, Colistium guntheri,
Rhombosolea retiaria, Rhombosolea plebeia, Rhombosolea leporina,
Rhombosolea tapirina, Pelotretis flavilatus
New Zealand Pseudocaranx dentex
Chelidonichthys kumu
Inshore Trawl Nemadactylus macropterus
Fishery Stock: BAR1, BAR5, BAR7
FLA3, FLA7
GUR1, GUR2, GUR3, GUR7
TAR1, TAR2, TAR3, TAR7
TRE1, TRE7
Gear type: Demersal Trawl, Purse seine (TRE1)
Year of Assessment: 2017
Fishery Overview
This summary is adapted from MPI (2017):
(a) (b) (c)
(d) (e)
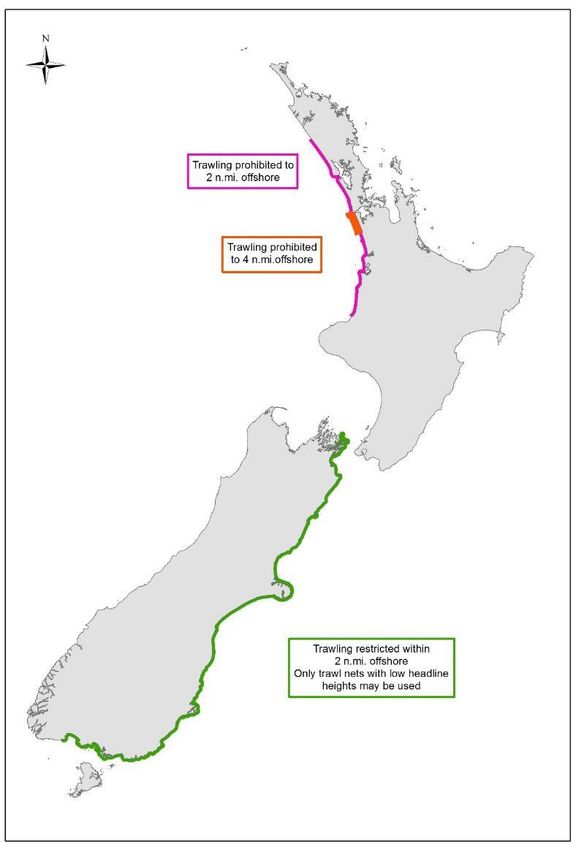
Figure 1: Management areas for the New Zealand inshore trawl species: (a) barracouta1, (b) flatfish, (c) trevally, (d) red gurnard and (e)
tarakihi (MPI, 2017).
1 BAR5 is primarily a deepwater fishery.
Page 2 New Zealand Inshore Trawl Fishery Report 2017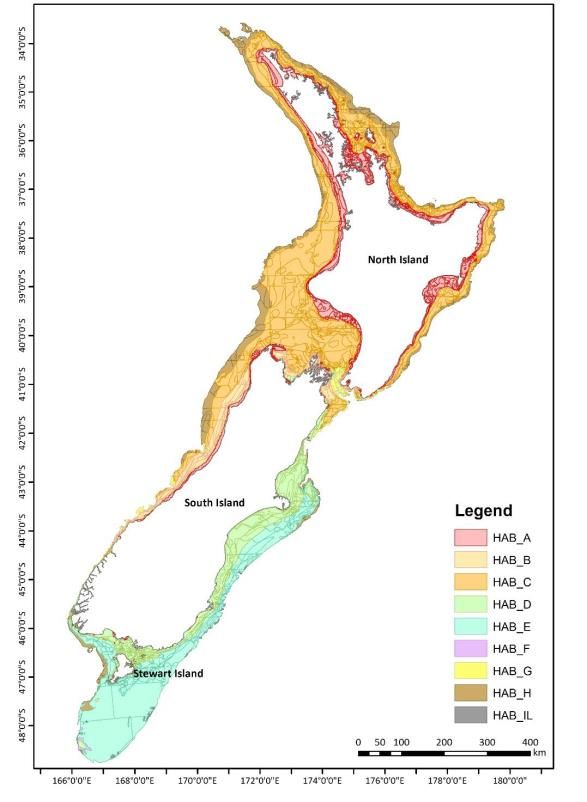
Barracouta
Barracouta are caught in coastal waters around mainland New Zealand, The Snares and Chatham Islands, down to about 400 m and have
been managed under the Quota Management System since 1 October 1986. Over 99% of the recorded catch is taken by trawlers. Major
target fisheries have been developed on spring spawning aggregations (Chatham Islands, Stewart Island, west coast South Island and
northern and central east coast South Island) as well as on summer feeding aggregations, particularly around The Snares and on the east
coast of the South Island. Barracouta also comprise a significant proportion of the bycatch in the west coast North Island jack mackerel
fishery, The Snares squid fishery, and the east coast South Island red cod and tarakihi fisheries.
Barracouta are commonly encountered by recreational fishers in New Zealand, more frequently in the southern half of BAR 7 and BAR 1.
Barracouta are typically harvested as bait for other fishing rather than for consumption.
Flatfish
Flatfish are shallow water species, taken mainly by target inshore trawl and Danish seine fleets around the South Island. Flatfish
Individual Transferable Quota (ITQ) provides for the landing of eight species of flatfish. These are: the yellow-belly flounder, Rhombosolea
leporine (YBF); sand flounder, Rhombosolea plebeian (SFL); black flounder, Rhombosolea retiaria (BFL); greenback flounder, Rhombosolea
tapirina (GFL); lemon sole, Pelotretis flavilatus (LSO); New Zealand sole, Peltorhamphus novaezeelandiae (ESO); brill, Colistium guntheri
(BRI); and turbot, Colistium nudipinnis (TUR). For management purposes landings of these species are combined.
Notwithstanding that, typically only a few are dominant in any one QMA and some are not found in all areas. In FLA 3, ESO, LSO, SFL, BFL
and BRI are the main species taken. In FLA 7, the catch mainly comprises GFL, SFL and TUR. The proportion that each species contributes
to the catch is expected to vary annually. Because the adult populations of most species generally consist of only one or two year classes
at any time, the size of the populations depends heavily on the strength of the recruiting year class and is therefore thought to be highly
variable.
Flatfish TACCs were originally set at high levels so as to provide fishers with the flexibility to take advantage of the perceived variability
associated with annual flatfish abundance. This approach has been modified with an in-season increase procedure for FLA 3.
There are important recreational fisheries, mainly for the four flounder species, in most harbours, estuaries, coastal lakes and coastal
inlets throughout New Zealand. The main methods are setnetting, drag netting (62.8% combined) and spearing (36.1%) (Wynne-Jones et
al 2014).
Trevally
Trevally is caught around the North Island and the north of the South Island, with the main catches from the northern coasts of the North
Island. Trevally is taken in the northern coastal mixed trawl fishery, mostly in conjunction with snapper. Since the mid-1970s trevally has
been taken by purse seine, mainly in the Bay of Plenty (BoP), in variable but often substantial quantities.
Trevally was introduced into the QMS in 1986 with five QMAs.
Recreational fishers catch trevally by setnet and line methods. Although highly regarded as a table fish, some trevally may be used as bait.
Red gurnard
Red gurnard are a major bycatch of inshore trawl fisheries in most areas of New Zealand, including fisheries for red cod in the southern
regions and flatfish on the west coast of the South Island (WCSI) and in Tasman Bay. They are also directly targeted in some areas e.g.
GUR 2. Red gurnard is also a minor bycatch in the jack mackerel trawl fishery in the South Taranaki Bight.
Red gurnard was introduced into the Quota Management System (QMS) in 1986, and is managed according to six QMAs. GUR 1, 3, 5 and
7 accounted for over 96% of the reported landings in 2015-16.
Red gurnard is, by virtue of its wide distribution in harbours and shallow coastal waters, an important recreational species. It is often
taken by fishers targeting snapper and tarakihi, particularly around the North Island.
Tarakihi
Tarakihi are caught by commercial vessels in all areas of New Zealand from the Three Kings Islands in the north to Stewart Island in the
south. The main fishing method is trawling. The major target trawl fisheries occur at depths of 100–200 m and tarakihi are taken as a
bycatch at other depths as well. The major fishing grounds are west and east Northland (QMA 1), the western Bay of Plenty to Cape
Turnagain (QMAs 1 and 2), Cook Strait to the Canterbury Bight (mainly QMA 3), and Jackson Head to Cape Foulwind (QMA 7). Around the
North Islands 70–80% of the tarakihi catch is targeted. Around the South Island only about 30% of the tarakihi catch is targeted; with
much of the remainder reported as bycatch in target barracouta and red cod bottom trawl fisheries. In addition, there is a small target
tarakihi setnet fishery off Kaikoura. The commercial minimum legal size (MLS) for all TAR stocks is 25 cm.
Since the introduction of the QMS in 1986, the total landings have fluctuated between 4,090t and 6,205t.
Units of assessment
Sixteen separate ‘units of assessment’ are assessed in this report:
                                  Species                        Stock                               Gear type
                       Barracouta                BAR 1, BAR 5, BAR 7                      Trawl
                       Flatfish                  FLA 3, FLA 7                             Trawl
                       Gurnard                   GUR 1, GUR 2, GUR 3, GUR 7               Trawl
                       Tarakihi                  TAR 1, TAR 2, TAR 3, TAR 7               Trawl
                       Trevally                  TRE 1, TRE 7                             Trawl, Purse seine (TRE 1)

Page 3                                                                                         New Zealand Inshore Trawl Fishery Report 2017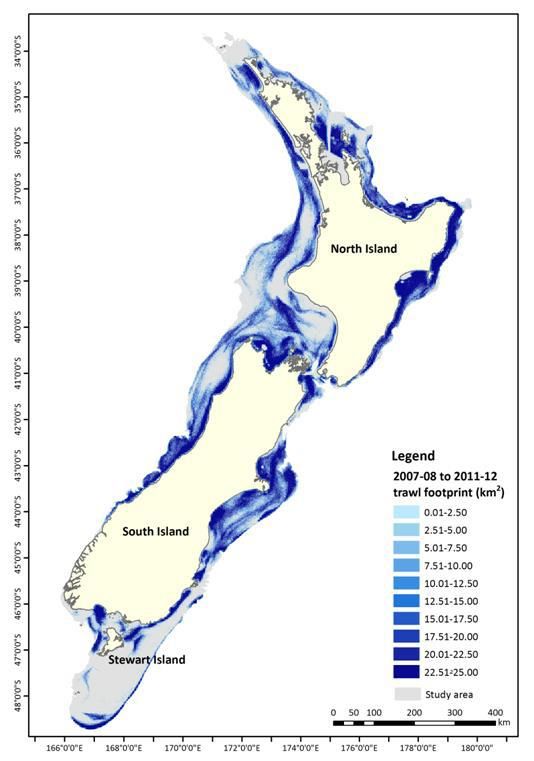
Scoring

Performance              BAR1     BAR5     BAR7     FLA3     FLA7        GUR1         GUR2         GUR3
Indicator
COMPONENT 1
1A: Stock Status          LOW     MEDIUM   MEDIUM   MEDIUM    PHR          LOW          LOW          LOW
1B: Harvest Strategy     MEDIUM    LOW      LOW     MEDIUM    PHR        MEDIUM       MEDIUM         LOW
1C: Information and       LOW      LOW      LOW      LOW      PHR          LOW          LOW          LOW
Assessment
OVERALL                   LOW      LOW      LOW     MEDIUM    HIGH         LOW          LOW          LOW
COMPONENT 2
2A: Non-target Species    PHR      PHR      PHR      PHR      PHR          PHR          PHR           PHR
2B: ETP Species           PHR      PHR      PHR      PHR      PHR          PHR          PHR           PHR
2C: Habitats             MEDIUM   MEDIUM   MEDIUM   MEDIUM   MEDIUM      MEDIUM       MEDIUM       MEDIUM
2D: Ecosystems            LOW      LOW      LOW      LOW      LOW          LOW          LOW          LOW
OVERALL                   HIGH     HIGH     HIGH     HIGH     HIGH        HIGH          HIGH         HIGH
COMPONENT 3
3A: Governance and        LOW      LOW      LOW      LOW      LOW          LOW          LOW          LOW
Policy
3B: Fishery-specific      LOW      LOW      LOW      LOW      LOW          LOW          LOW          LOW
Management System
OVERALL                   LOW      LOW      LOW      LOW      LOW          LOW          LOW          LOW

Performance              GUR7     TAR1     TAR2     TAR3     TAR7        TRE1        TRE1 -        TRE7
Indicator                                                                              PS
COMPONENT 1
1A: Stock Status          LOW      PHR      PHR      PHR      LOW         PHR           PHR          LOW
1B: Harvest Strategy     MEDIUM    PHR      PHR      PHR     MEDIUM     MEDIUM       MEDIUM          LOW
1C: Information and       LOW      LOW      LOW      LOW      LOW         PHR           PHR          LOW
Assessment
OVERALL                   LOW      HIGH     HIGH     HIGH     LOW         HIGH         HIGH          LOW
COMPONENT 2
2A: Non-target Species    PHR      PHR      PHR      PHR      PHR         PHR           PHR          PHR
2B: ETP Species           PHR      PHR      PHR      PHR      PHR         PHR          LOW           PHR
2C: Habitats             MEDIUM   MEDIUM   MEDIUM   MEDIUM   MEDIUM     MEDIUM         LOW         MEDIUM
2D: Ecosystems            LOW      LOW      LOW      LOW      LOW         LOW          LOW           LOW
OVERALL                   HIGH     HIGH     HIGH     HIGH     HIGH        HIGH       MEDIUM          HIGH
COMPONENT 3
3A: Governance and        LOW      LOW      LOW      LOW      LOW         LOW          LOW           LOW
Policy
3B: Fishery-specific      LOW      LOW      LOW      LOW      LOW         LOW          LOW           LOW
Management System
OVERALL                   LOW      LOW      LOW      LOW      LOW         LOW          LOW           LOW

Page 4                                                          New Zealand Inshore Trawl Fishery Report 2017
Summary of main issues
    •    The position of several target stocks against reference points is not known, as is the probability that current catch or TACC will
         result in a decline in biomass below soft and hard limits
    •    Observer coverage in inshore fisheries has been very low historically, and very limited information is available on composition
         and volume of discards.
    •    The inshore trawl fisheries interact with a range of ETP species. Although recent risk assessments indicate the extent of
         estimated captures of seabird species should not hinder recovery, there is uncertainty over the impact of the fishery on
         common dolphins. Preliminary results from the New Zealand Marine Mammal Risk Assessment identified common dolphin as
         the marine mammal species most at risk from commercial fishing.
    •    The widespread nature of bottom trawling suggests that fishing is the main anthropogenic disturbance agent to the seabed
         throughout most of New Zealand’s EEZ. Recent research suggests moderate and high levels of trawling intensity occur in a
         relatively small proportion of areas shallower than 200m. The capacity of seabed communities to recover from trawling
         disturbance is not well known.
    •    There have been concerns about compliance with quota species retention provisions amongst inshore fisheries.

Outlook
Inshore trawl units of assessment
 Component                Stock           Outlook         Comments
 Target species           BAR1, BAR5,     Stable          All stocks appear to be well above the point of recruitment impairment. BAR
                          BAR7                            5 and BAR 7 may improve scoring is additional evidence is presented that
                                                          stocks are fluctuating at or around levels consistent with MSY.

                          FLA3            Stable          Likely outlook appears to differ by stock. Sand flounder and lemon sole
                                                          appear to be in good health and responding well to the Management
                                                          Procedure. It is possible New Zealand sole are being overfished.
                          FLA7            Uncertain       No stock status information or stock projections

                          GUR1            Uncertain       Red gurnard is taken mainly as a bycatch in GUR 1. Abundance appears to be
                                                          somewhat cyclical, based on recruitment variation. Without information on
                                                          recruitment it is not possible to predict future stock trends. The TACC is set
                                                          substantially above current catches.
                          GUR2            Stable          The stock is very likely to be at or above target levels, and it is unlikely that
                                                          the current catch or TACC will result in the stock falling below the soft limit.
                                                          Standardised CPUE in 2015–16 was well above the target.
                          GUR3            Stable          Current abundance is at historically high levels and is unlikely to decline below
                                                          the soft limit in 3–5 years.
                          GUR7            Stable          The West Coast South Island trawl survey relative biomass indices from 2015
                                                          and (preliminary) 2017 were by far the highest of the entire time series. It is
                                                          unlikely the stock will decline below soft limits in the next 3-5 years.
                          TAR1            Uncertain       The current position of the stock against reference points is unknown. It is
                                                          not known whether the current catch or TACC will cause the stock to fall
                                                          below reference points. The next assessment of the stock is scheduled for
                                                          2018.
                          TAR2, TAR3      Stable          The current position of the stocks against target and soft limit reference
                                                          points is unknown, although it is unlikely to be below the hard limit. It is
                                                          unlikely that the current catch or TACC will cause the stock to fall below the
                                                          hard limit. The next assessment of the stock is scheduled for 2018.

                          TAR7            Stable          The WCSI trawl survey biomass index is higher than in 2007, when it was likely
                                                          the stock was at or above B40%. Biomass (WCSI) is expected to stay steady
                                                          over the next 3–5 years assuming current (2012/13) catch levels.
                          TRE1            Improving       Relative abundance series were increasing for both BoP and EN/HG. New
                                                          stock assessments are expected to be completed once new catch-at-age data
                                                          become available.
                          TRE7            Stable          The stock is above the target reference point and fishing mortality is lower
                                                          than FMSY.

Page 5                                                                                       New Zealand Inshore Trawl Fishery Report 2017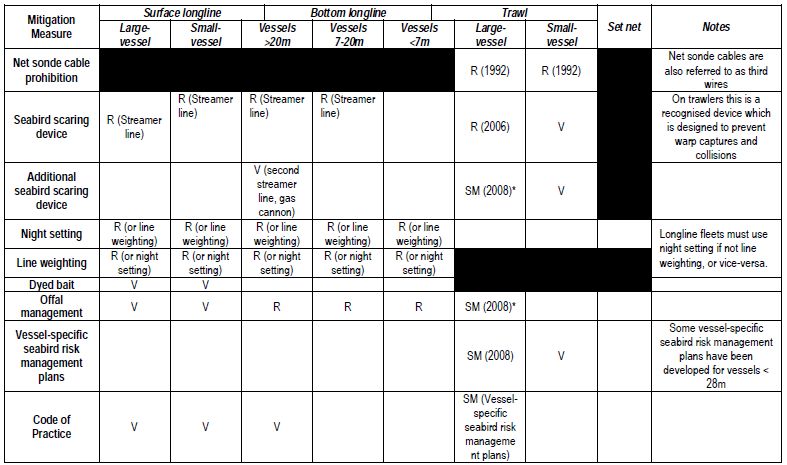
Environmental impact                Improving       The information base to examine the ecosystem impacts of inshore trawling is
 of fishing                                          growing. The introduction of the Integrated Electronic Monitoring and
                                                     Reporting System (IEMRS) should improve understanding of catch
                                                     composition and allow more sophisticated assessments of the impact of the
                                                     fishery on non-target species. ETP species risk assessments have been
                                                     continuously refined over recent years, generally resulting in reductions in
                                                     estimated risks from inshore trawling. Habitat research is ongoing with new
                                                     studies planned to better understand the dynamics around impact and
                                                     recovery. Ecosystem modelling is also underway to better understand the
                                                     trophic impacts of inshore fishing.
 Management system                   Stable          No major changes are expected to P3 risk scoring.

TRE1 – Purse seine
 Component                 Outlook               Comments
 Target species            Stable                Although variable, recent levels of fishing intensity have been at or around FMSY.

 Environmental impact of   Stable                The introduction of the Integrated Electronic Monitoring and Reporting System
 fishing                                         (IEMRS) may reduce the other species risk score.
 Management system         Stable                No major changes are expected to P3 risk scoring.

Page 6                                                                                New Zealand Inshore Trawl Fishery Report 2017
Contents
Assessment Summary ....................................................................................................................................................... 2
    Fishery Overview .................................................................................................................................................................. 2
    Scoring ................................................................................................................................................................................. 4
    Summary of main issues ...................................................................................................................................................... 5
    Outlook ................................................................................................................................................................................ 5
Contents ........................................................................................................................................................................... 7
    Disclaimer ............................................................................................................................................................................ 7
Background....................................................................................................................................................................... 8
Methods ........................................................................................................................................................................... 8
    Risk Assessment ................................................................................................................................................................... 8
    Outlook ................................................................................................................................................................................ 8
    Information sources ............................................................................................................................................................. 8
Assessment Results........................................................................................................................................................... 9
COMPONENT 1: Target fish stocks .................................................................................................................................... 9
    1A: Stock Status ................................................................................................................................................................... 9
    1B: Harvest Strategy .......................................................................................................................................................... 11
    1C: Information and Assessment ....................................................................................................................................... 14
COMPONENT 2: Environmental impact of fishing ........................................................................................................... 17
    2A: Other Species ............................................................................................................................................................... 17
    2B: Endangered Threatened and/or Protected (ETP) Species ............................................................................................ 22
    2C: Habitats ....................................................................................................................................................................... 27
    2D: Ecosystems .................................................................................................................................................................. 31
COMPONENT 3: Management system ............................................................................................................................ 32
    3A: Governance and Policy ................................................................................................................................................ 32
    3B: Fishery Specific Management System.......................................................................................................................... 34
References ...................................................................................................................................................................... 36

Disclaimer
This assessment has been undertaken in a limited timeframe based on publicly available information. Although all reasonable efforts
have been made to ensure the quality of the report, neither this company nor the assessment' s authors warrant that the information
contained in this assessment is free from errors or omissions. To the maximum extent permitted by law, equity or statute, neither this
company nor the authors accept any form of liability, it contractual, tortious or otherwise, for the contents of this report or for any
consequences arising from misuse or any reliance placed on it.

Page 7                                                                                                                         New Zealand Inshore Trawl Fishery Report 2017
Background
This report sets out the results of an assessment against a seafood risk assessment procedure, originally developed for Coles
Supermarkets Australia by MRAG Asia Pacific. The aim of the procedure is to allow for the rapid screening of uncertified source fisheries
to identify major sustainability problems, and to assist seafood buyers in procuring seafood from fisheries that are relatively well-
managed and have lower relative risk to the aquatic environment. While it uses elements from the GSSI benchmarked MSC Fishery
Standard version 2.0, the framework is not a duplicate of it nor a substitute for it. The methodology used to apply the framework differs
substantially from an MSC Certification. Consequently, any claim made about the rating of the fishery based on this assessment should
not make any reference to the MSC or any other third party scheme.
This report is a “live” document that will be reviewed and updated on an annual basis.

Methods
Risk Assessment
Detailed methodology for the risk assessment procedure is found in MRAG AP (2015). The following provides a brief summary of the
method as it relates to the information provided in this report.
Assessments are undertaken according to a ‘unit of assessment’ (UoA). The UoA is a combination of three main components: (i) the
target species and stock; (ii) the gear type used by the fishery; and (iii) the management system under which the UoA operates.
Each UoA is assessed against three components:
     1.   Target fish stocks;
     2.   Environmental impact of fishing; and
     3.   Management system.
Each component has a number of performance indicators (PIs). In turn, each PI has associated criteria, scoring issues (SIs) and scoring
guideposts (SGs). For each UoA, each PI is assigned one of the following scores, according to how well the fishery performs against the
SGs:
     •    Low risk;
     •    Medium risk;
     •    Precautionary high risk; or
     •    High risk
Scores at the PI level are determined by the aggregate of the SI scores. For example, if there are five SIs in a PI and three of them are
scored low risk with two medium risk, the overall PI score is low risk. If three are medium risk and two are low risk, the overall PI score is
medium risk. If there are an equal number of low risk and medium risk SI scores, the PI is scored medium risk. If any SI scores
precautionary high risk, the PI scores precautionary high risk. If any SI scores high risk, the PI scores high risk.
For this assessment, each component has also been given an overall risk score based on the scores of the PIs. Overall risk scores are
either low, medium or high. The overall component risk score is low where the majority of PI risk scores are low. The overall risk score is
high where any one PI is scored high risk, or two or more PIs score precautionary high risk. The overall risk score is medium for all other
combinations (e.g. equal number of medium/low risk PI scores; majority medium PI scores; one PHR score, others low/medium).

Outlook
For each UoA, an assessment of the future ‘outlook’ is provided against each component. Assessments are essentially a qualitative
judgement of the assessor based on the likely future performance of the fishery against the relevant risk assessment criteria over the
short to medium term (0-3 years). Assessments are based on the available information for the UoA and take into account any known
management changes. Outlook scores are provided for information only and do not influence current or future risk scoring.
Table 1: Outlook scoring categories.

             Outlook score                                                           Guidance
 Improving                              The performance of the UoA is expected to improve against the relevant risk assessment criteria.

 Stable                                 The performance of the UoA is expected to remain generally stable against the relevant risk
                                        assessment criteria.
 Uncertain                              The likely performance of the UoA against the relevant risk assessment criteria is uncertain.

 Declining                              The performance of the UoA is expected to decline against the relevant risk assessment criteria.

Information sources
Information to support scoring is obtained from publicly available sources, unless otherwise specified. Scores will be assigned on the basis
of the objective evidence available to the assessor. A brief justification is provided to accompany the score for each PI.
Assessors will gather publicly available information as necessary to complete or update a PI. Information sources may include information
gathered from the internet, fishery management agencies, scientific organisations or other sources.

Page 8                                                                                       New Zealand Inshore Trawl Fishery Report 2017
Assessment Results COMPONENT 1: Target fish stocks 1A: Stock Status CRITERIA: (i)The stock is at a level which maintains high productivity and has a low probability of recruitment overfishing. (a) Stock Status BAR1 LOW RISK There are thought to be at least four main stocks of barracouta, based on known spawning locations and movements (MPI, 2017). Stock boundaries are not well understood, but the Chatham Islands stock is probably separate. There may be overlap between Southland fish and other areas, but information is not sufficient to alter existing stock boundaries. There are no integrated stock assessments available for any barracouta stocks (MPI, 2017). The most recent assessment of BAR 1 was undertaken in 2016, using standardised CPUE as well as East Coast South Island (ECSI) trawl survey results. Assessments of status are made against a BMSY-compatible proxy based on CPUE (average from 1989–90 to 2013–14 of the BAR 1 ECSI CELR/TCER model as defined by Baird (2016) in MPI, 2017). The BAR 1 CPUE series increased steeply from 2002–03 to a peak in 2012–13. The 2013–14 value was lower than the peak, but well above the series mean. The winter ECSI trawl survey series for recruited fish has a trend that is similar to the BAR 1 CPUE index, with a peak in 2014. MPI (2017) conclude that the stock is very likely (>90%) to be at or above the target reference point. Accordingly, we have scored this SI low risk. BAR5 MEDIUM RISK The most recent assessment of BAR 1 was undertaken in 2017, using standardised CPUE (MPI, 2017). The WG agreed that the CPUE from the SQU target fishery in Statistical Area 028 was the best series of abundance indices for BAR 5. CPUE has remained at a high level since 2008 despite catches at or above the TACC. MPI (2017) conclude that the stock is very unlikely (< 10%) to be below both the soft and hard limits. While the stock clearly meets the first part of the low risk SG (that the stock is highly likely to be above the point of recruitment impairment), the status in relation to the target reference point is unknown. Accordingly, there is less evidence that the stock is fluctuating around a level consistent with MSY. On that basis, we have scored this SI medium risk. BAR7 MEDIUM RISK The most recent assessment of BAR 7 was undertaken in 2016, using standardised CPUE (MPI, 2017). The WG considered that the tow level CPUE was the best data to use to monitor this stock. The CPUE shows an increasing trend from 2000 to 2004 and is then generally flat. Similar trends were observed in West Coast North Island (WCNI) and West Coast South Island (WCSI) trawl surveys. MPI (2017) conclude that the stock is very unlikely (< 10%) to be below both the soft and hard limits. While the stock clearly meets the first part of the low risk SG (that the stock is highly likely to be above the point of recruitment impairment), the status in relation to the target reference point is unknown. Accordingly, there is less evidence that the stock is fluctuating around a level consistent with MSY. On that basis, we have scored this SI medium risk. FLA3 MEDIUM RISK MPI (2017) report that there is evidence of many fairly localised stocks of flatfish, although there is no new data which would alter the existing stock boundaries used for assessment purposes. The most recent assessment of stocks in FLA 3 was undertaken in 2015. Assessments were made of all three main stocks (ESO, SFL and LSO) combined, as well as for each stock individually (MPI, 2017). For the combined species assessment standardised lognormal bottom trawl CPUE for all flatfish combined in FLA 3 was used. Assessments were made against a BMSY proxy based on the mean standardised lognormal CPUE from 1989–90 to 2006–07 (the final year of unconstrained catches). MPI (2017) conclude that it is about as likely as not that the stock is at or above the target, unlikely (
MPI (2017) reports that GUR 1 is considered to be a single stock with three sub-stocks (GUR 1W, GUR 1E, GUR 1 Bay of Plenty).
The most recent stock assessments for each stock were undertaken in 2013 (MPI, 2017), using standardised CPUE. Each stock was
assessed against stock-specific BMSY-compatible reference points consistent with the HSS. MPI (2017) concluded that each stock was
as likely as not to be above the BMSY proxy target reference point, unlikely (90%) to be above the B MSY proxy target reference point, and very
unlikely (60%) to be above the BMSY proxy target reference point, and very unlikely (90%) to be above the BMSY proxy target reference point, and very unlikely
(
TAR7                                                                                                                          LOW RISK
MPI (2017) note that TAR 7 is assumed to be a discrete stock for assessment purposes.
The TAR 7 stock was most recently assessed in 2014 using WCSI trawl survey biomass and standardised CPUE indices (MPI, 2017). The
stock was previously assessed in 2008 using an integrated statistical catch-at-age stock assessment incorporating data up to the end of
the 2006–07 fishing year (Manning 2008; in MPI, 2017). MPI (2017) note that the range of model results for 2008 assessment
estimated that the stock was likely (> 60%) to be at or above BMSY (40% B0). They also report that trawl survey recruited biomass index
for WCSI in 2013 was 17% higher than in 2007, suggesting the stock is at a similar level and that the evaluation of stock status relative
to BMSY remains similar to that in 2007. WCSI CPUE index is marginally lower in 2013 than in 2007. They conclude the stock is unlikely
(
The TAC in BAR 5 was increased from 7,475t to 8,370t in 2016 in response to 2016 CPUE analysis indicating that abundance remained
high after a significant increase in 2007-09. This provides evidence that the harvest strategy is responsive to the state of the stock,
while standardised CPUE trends indicate that the stock is a level that maintains high productivity with low probability of recruitment
overfishing. All of the elements of the harvest strategy (monitoring of catch/effort, analysis of standardised CPUE, TAC decision making
in the context of reference points) appears to work together to achieve the stock management objectives reflected in criteria 1A(i).
Allowances for estimated recreational and customary catches, as well as other sources of mortality, are included in the TAC.
Accordingly, we have scored this SI low risk.

BAR7                                                                                                                            LOW RISK
Although there is limited evidence that the harvest strategy is responsive to the state of the stock from TAC adjustments over time,
the position of the stock against reference points is regularly monitored using fishery CPUE and independent trawl surveys (MPI,
2017). The available evidence suggests that overfishing is unlikely to be occurring. Accordingly, there is good evidence that all of the
elements of the harvest strategy work together towards achieving the stock management objectives reflected in criteria 1A(i). There
is also strong evidence from other NZ stocks that adjustments to TACCs are made in response to evidence of changing stock status
(e.g. BAR 5). Allowances for estimated recreational and customary catches, as well as other sources of mortality, are included in the
TAC. Accordingly, we have scored this SI low risk.

FLA3                                                                                                                       MEDIUM RISK
In addition to the generic harvest strategy measures outlined for all inshore species above, all FLA fisheries have been put on to
Schedule 2 of the Fisheries Act 1996. Schedule 2 allows that for certain “highly variable” stocks, the Total Annual Catch (TAC) can be
increased within a fishing season (MPI, 2017). The base TAC is not changed by this process and the “in season” TAC reverts to the
original level at the end of each season. The FLA 3 management procedure (Section 4.3) is an implementation of this form of
management. In addition, a commercial minimum legal size is set for sand flounder (23 cm), and for all other flatfish species (25 cm).
FLA 3 operates under a Management Procedure (MP) used to inform in-season adjustments to the FLA 3 TACC. The MP was most
recently updated in 2015 (Starr & Kendrick in prep; in MPI, 2017). and uses the relationship between annual standardised CPUE for all
FLA 3 species and the total annual FLA 3 landings to estimate an average exploitation rate which is then used to recommend a level of
catch based on an early estimate of standardised CPUE (MPI, 2017) (Figure 2).

Figure 2: Operation of the 2015 FLA 3 MP, showing the relationship of the fitted catch estimates to the observed MHR/QMR landings
and the annual recommended catches from 2008 onward based on the estimated standardised CPUE up to the end of November and
only using the data available in the indicated year. (From MPI, 2017)

Across the three main species combined, MPI (2017) conclude that it is unlikely (60%) that overfishing is occurring at current catch levels. We have these stocks medium
risk overall, however we note that if scored individually sand flounder and lemon sole would likely score low risk, while New Zealand
sole would score either precautionary high risk or high risk.

FLA7                                                                                                       PRECAUTIONARY HIGH RISK
No specific information is available on the extent to which the harvest strategy in FLA 7 is expected to meet the stock management
objectives reflected in criteria 1A(i).

GUR1                                                                                                                       MEDIUM RISK
MPI (2017) note that red gurnard is a short-lived species with variable recruitment and it is difficult to predict how the stock is going to
respond in the next few years. They note that “the abundance of all three sub-stocks appears to be cyclical, probably in response to
recruitment variation, and in two sub-stocks trends are currently downward. This makes it difficult to predict future trends without
recruitment information. Given that the catch levels observed from 1986–87 to 2011–12 has been relatively consistent (averaging

Page 12                                                                                     New Zealand Inshore Trawl Fishery Report 2017
1129 t for all of GUR 1) and that red gurnard are mainly taken as bycatch, current catch levels are unlikely to compromise the long-
term viability of this stock.” Together with periodic monitoring of the stock against reference points using agreed indices of
abundance and in the context of legislative requirements for sustainability under the Fisheries Act and HSS, this provides some
evidence that the harvest strategy could be expected to achieve the stock management objectives reflected in criteria 1A(i).
Nevertheless, the main uncertainty is the position of the TACC (2,288t), which has been maintained at more than twice the reported
catch since the early 1990s (presumably to allow for variable abundance in this mainly bycatch species). MPI (2017) note that “as the
TACC is substantially higher than the current catch, it is not possible to evaluate potential impacts if catches increased to the level of
the TACC”. Given there is limited evidence the harvest strategy is responsive to the state of the stock and the scope to substantial
increase catch under the current TACC, we have scored this SI medium risk.

GUR2                                                                                                                        MEDIUM RISK
MPI (2017) report that GUR 2 stock abundance indices generally trended downwards between 1990 and 2007, then flattened to 2012,
with a strong increase to 2016. Standardised CPUE in 2015–16 was well above the target. Relative exploitation rate increased
gradually from 1989–90 to 2009–10 and then dropped to below the long-term average from 2013–14. MPI (2017) conclude that the
current catch is unlikely (
we note the stock would be better positioned against this SI with additional evidence that the current TAC will maintain the stock at
BMSY.

TRE7                                                                                                                            LOW RISK
 Stock projections were undertaken during the 2015 stock assessment using two catch scenarios: the current TACC or a constant catch
equivalent to the 2013 catch level. The analysis projected a slight decline in spawning biomass (3%) to 2019, but only a low probability
that the biomass will decline below the target biomass level. Overall, there was an 86% probability that the stock would remain above
B40% in 2019 under the TACC catch scenario and a 92% probability under the 2013 catch scenario. Accordingly, notwithstanding no
changes in the TAC since the early 1990s, there is good evidence that the harvest strategy is responsive to the state of the stock and all
of the elements of the harvest strategy work together towards achieving the stock management objectives reflected in criteria 1A(i).

(b) Shark-finning
NA

CRITERIA: (ii) There are well defined and effective harvest control rules (HCRs) and tools in place.

(a) HCR Design and application
BAR1, BAR5, BAR7, GUR1, GUR2, GUR3, GUR7, FLA3, TRE7                                                                            LOW RISK
FLA7, TAR1, TAR2, TAR3, TAR7, TRE1                                                                                         MEDIUM RISK
The inshore trawl UoAs are covered by the requirements of the Fisheries Act 1996 to maintain stocks at levels capable of producing
MSY or higher [e.g. sub-section 13(2A) states that “if the Minister considers that the current level of the stock or the level of the stock
that can produce the maximum sustainable yield is not able to be estimated reliably using best available information, the Minister
must … (c) set a total allowable catch … (ii) that is not inconsistent with the objective of maintaining the stock at or above, or moving
the stock towards or above, a level that can produce the maximum sustainable yield”], and the NZ Harvest Strategy Standard (HSS)
which requires QMS stocks to be maintained at or above a target equivalent to BMSY, and above a soft limit equating to ½ BMSY (MFish,
2008). The HSS requires that target and limit biological reference points be set for all QMS fishstocks but is flexible about the means
by which this is achieved. The intention is to make best use of available information for each individual stock.
For those stocks which have a sound and measurable index of relative biomass and stock specific reference points, the harvest
strategy has the key elements needed to ensure that exploitation is reduced as PRI is approached: a robust index of abundance, a suite
of performance measures based on these estimates of relative biomass, and a TAC adjustable annually. While there is no formal
mathematical harvest control rule (HCR) for these stocks (except for FLA 3), there is clearly a process in place to identify, examine and
respond to issues of stock decline, and a suite of available tools to implement reductions in exploitation if needed. Action taken to
reduce the TACs in response to stock declines in several NZ fisheries provides evidence that the management system is willing to
reduce exploitation as PRI is approached. Similar measures have been sufficient to meet at least the SG80 mark in full MSC
assessments for other NZ deepwater fisheries (e.g. hoki, southern blue whiting).
The remaining stocks without a robust measure of abundance and/or stock specific reference points are subject to requirements of
the Act and HSS which provide generally understood HCRs. These stocks are scored medium risk.

PI SCORE              LOW RISK – BAR1, BAR5, BAR7, GUR3, GUR7, TRE7
                      MEDIUM RISK – FLA3, GUR1, GUR2, TRE1, TAR7
                      PRECAUTIONARY HIGH RISK – FLA7, TAR1, TAR2, TAR3

1C: Information and Assessment
CRITERIA: (i) Relevant information is collected to support the harvest strategy.
(a) Range of information
BAR1, BAR5, BAR7                                                                                                                LOW RISK
Notwithstanding some uncertainties around stock mixing (e.g. MPI, 2017), sufficient information is available on stock structure and
productivity and fleet composition to support the harvest strategy. There is very good monitoring of catch and effort through the
QMS system with VMS and some validation from independent observers. The available data are sufficient to support standardised
CPUE analyses against reference points for all stocks. Trawl surveys also provide an independent index of abundance.

FLA3                                                                                                                            LOW RISK
Notwithstanding some uncertainties around stock structure and reporting of multiple species within the one generic species code,
sufficient information is available on stock structure and productivity and fleet composition to support the harvest strategy. There is
very good monitoring of catch and effort through the QMS system, MPI (2017) indicates that reporting by flatfish species has
substantially improved in FLA 3 in 2012–13 and 2013–14. The available data are sufficient to support standardised CPUE analyses
against reference points for all stocks, as well as the operation of a quantitative Management Procedure (MP).

FLA7                                                                                                       PRECAUTIONARY HIGH RISK

Page 14                                                                                     New Zealand Inshore Trawl Fishery Report 2017
Limited information has been found on FLA 7. This fishery is subject to the same reporting arrangements as other FLA stocks under the QMS, and information on catch, effort and fleet composition is likely to be very good. Nevertheless, given the limited information available on the harvest strategy it is difficult to gauge whether the existing fishery information is sufficient. Accordingly, we have scored this SI precautionary high risk. GUR1, GUR2, GUR3, GUR7 LOW RISK Although some uncertainty around stock structure remains, sufficient relevant information on stock structure, stock productivity and fleet composition are available to support the harvest strategy. There is very good monitoring of catch and effort through the QMS system, while recreational catches are estimated periodically which inform recreational allowances in the TAC. The basic biology of red gurnard has been relatively well studied (see summary in MPI, 2017). TAR1, TAR2, TAR3, TAR7 LOW RISK Although some uncertainty around stock structure remains (e.g. the inter-relationship between TAR 2 and TAR3), sufficient relevant information on stock structure, stock productivity and fleet composition are available to support the harvest strategy. There is very good monitoring of catch and effort through the QMS system, while recreational catches are estimated periodically which inform recreational allowances in the TAC. The basic biology of tarakihi has been relatively well studied (see summary in MPI, 2017). TRE1, TRE7 LOW RISK Sufficient information is known about the stock boundaries of trevally and stock productivity to support the harvest strategy. In addition, there is very good monitoring of catch and effort through the QMS system, and good information on fleet composition. (b) Monitoring and comprehensiveness BAR1, BAR5, BAR7 LOW RISK Commercial removals from the UoA are closely monitored through the QMS reporting arrangements, with some level of validation from observers. Recreational catches are minor compared to commercial catch and are estimated periodically (MPI, 2017). Most recently, catches were estimated across all BAR stocks using a ‘panel survey’ method. No quantitative information customary catch is available, though anecdotal information suggests that catch is small. Standardised CPUE provides an index of abundance for each stock, while trawl surveys also provide an independent measure of abundance. This information is sufficient to support the HCRs. FLA3 LOW RISK Commercial removals from the UoA are closely monitored through the QMS reporting arrangements, with some level of validation from observers. Recreational catches are minor compared to commercial catch and are estimated periodically. Most recently, catches were estimated in 2012 using a ‘panel survey’ method. No quantitative information customary catch is available. Standardised CPUE provides an index of abundance for each stock, while trawl surveys also provide an independent measure of abundance for lemon sole. This information is sufficient to support the MP. FLA7 PRECAUTIONARY HIGH RISK While it is likely that removals from the UoA are closely monitored through the QMS, no information on FLA7 is presented in the Plenary reports (MPI, 2017) so it is not known whether a robust index of abundance exists. GUR1, GUR2, GUR3, GUR7 LOW RISK Stock abundance for each stock and sub-stock is regularly monitored, with stock-specific indices of abundance discussed and agreed at the relevant working group. Commercial removals from the UoA are closely monitored through the QMS reporting arrangements, with a low level of validation from observers. Recreational catches are small compared to commercial catch and are estimated periodically (MPI, 2017). Most recently, catches were estimated in 2012 using a ‘panel survey’ method. Red gurnard is an important species for customary non-commercial fishing interests, however no quantitative information on customary catch is available. TAR1, TAR2, TAR3, TAR7 LOW RISK Stock abundance for each stock and sub-stock is regularly monitored, with stock-specific indices of abundance (e.g. commercial trawl CPUE, independent trawl survey CPUE) discussed and agreed at the relevant working group. Commercial removals from the UoA are closely monitored through the QMS reporting arrangements, with a low level of validation from observers. Recreational catches are small compared to commercial catch and are estimated periodically (MPI, 2017). Most recently, catches were estimated in 2012 using a ‘panel survey’ method. Red gurnard is an important species for customary non-commercial fishing interests, however no quantitative information on customary catch is available. TRE1 MEDIUM RISK Commercial removals from the UoA are closely monitored through the QMS reporting arrangements, with a low level of validation from observers. Recreational catches are minor compared to commercial catch and are estimated periodically. Most recently, catches were estimated in 2012 using a ‘panel survey’ method. No quantitative information customary catch is available. Standardised bottom trawl CPUE index was accepted by the Working Group as an index of abundance. TRE7 LOW RISK Removals from the UoA are monitored similar to TRE 1. Stock abundance is monitored through multiple indices of abundance and periodic stock assessments. These are sufficient to support the harvest control framework established by the HSS. Page 15 New Zealand Inshore Trawl Fishery Report 2017
CRITERIA: (ii) There is an adequate assessment of the stock status.
(a) Stock assessment
BAR1                                                                                                                         LOW RISK
BAR5, BAR7                                                                                                              MEDIUM RISK
Assessments of each stock are undertaken using standardised CPUE, based on the most appropriate sector of the fishery agreed by
the working group. Although no estimate of biomass is available, analysis of CPUE trends allows for a probabilistic judgement about
the position of the stock against the generic default reference points in the HSS in the case of BAR 5 and BAR 7, and B MSY proxy
reference points in the case of BAR 1. Both the quality of the assessments and main data inputs were rated ‘high’ by the working
group. On the basis that the BAR 1 assessment is appropriate for the stock and estimates status relative to reference points that are
appropriate to the stock and can be estimated we have scored it low risk. On the basis that BAR 5 and BAR 7 are assessed against the
generic reference points in the HSS only, we have scored them medium risk.

FLA3                                                                                                                         LOW RISK
Assessments of each stock are undertaken using standardised CPUE, with the approach agreed by the working group. Although no
estimate of biomass is available, analysis of CPUE trends allows for a probabilistic judgement about the position of the stock against
default BMSY-based proxy reference points. Both the quality of the assessments and main data inputs for each species were rated
‘high’ by the working group. On that basis, the available assessments are appropriate for the stocks and estimates status relative to
reference points that are appropriate to the stock and can be estimated.

FLA7                                                                                                    PRECAUTIONARY HIGH RISK
No stock assessment information was available.

GUR1, GUR2, GUR3, GUR7                                                                                                       LOW RISK
Although the indices of abundance differ, the overall approach to assessment of each of the GUR stock is similar with standardised
commercial trawl or trawl survey CPUE (and survey length frequency in the case of GUR 7) assessed against stock-specific BMSY proxies
agreed by the working group (MPI, 2017). Both the assessments themselves and data inputs were rated ‘high quality’ by each of the
relevant working groups. Accordingly, there is evidence that the assessments are appropriate for the stock and estimate status
relative to reference points which are appropriate to the stock and can be estimated.

TAR1                                                                                                                    MEDIUM RISK
The TAR 1 stock is assessed using standardised indices of abundance for each of the three sub-stocks. Indices of abundance are
agreed by the relevant working group. At present, assessment outputs are assessed relative to generic reference points in the HSS.
While the overall assessment quality and data inputs were rated ‘high quality’ in the 2012 assessment, conflicting trends across the
different stocks meant a conclusion on the position of the stock against reference points was not possible.
In 2012, an assessment of the east coast mainland New Zealand tarakihi stocks was attempted (Langley & Starr 2013; in MPI, 2017),
however the Northern Inshore Working Group concluded that uncertainties in key model assumptions (e.g. fishery selectivity and
stock structure) meant the range of models investigated was not adequate for the formulation of management advice.

TAR2, TAR3                                                                                                              MEDIUM RISK
Both TAR 2 and TAR 3 are assessed using standardised CPUE indices agreed by the working group. Species-specific target reference
points have not been established, but BMSY is assumed (MPI, 2017). Assessment outcomes are currently assessed against the default
reference points in the HSS. The 2012 assessment results were sufficient to make a probabilistic judgement about the position of the
stock against the hard limit, but not the target or soft limit.

TAR7                                                                                                                         LOW RISK
TAR 7 was assessed in 2014 using a time series of WCSI trawl survey biomass, as well as updated standardised CPUE indices from two
sub-stock areas within TAR 7 (West Coast South Island and Tasman Bay/Cook Strait) (MPI, 2017). In 2008, the stock was assessed
using an integrated statistical catch-at-age stock assessment incorporating data up to the end of the 2006–07 fishing year (Manning
2008; in MPI, 2017). The 2008 assessment estimated biomass in 2007 against biomass in the absence of fishing (B0) and created an
implicit benchmark against which more recent standardised CPUE results could be compared. Although B MSY has not yet been
analytically determined, B40% has been assumed. Accordingly, there is evidence that the assessment estimates status relative to
reference points which are appropriate to the stock and can be estimated.

TRE1                                                                                                    PRECAUTIONARY HIGH RISK
Stock assessments for the two TRE 1 QMA stocks (East Northland to Hauraki Gulf, and Bay of Plenty) were rejected by the Northern
Inshore Working Group in 2015 and 2016 as a result of conflicts in the data (MPI, 2017). The Working Group recommended that
assessments should be undertaken after the next catch-at-age study for TRE 1 had been completed. In the meantime, standardised
trawl CPUE has been used to assess trends in catch rates. This is yet to estimate status against generic reference points.

TRE7                                                                                                                         LOW RISK
The 2015 assessment used an age structured Stock Synthesis population model fitted to various indices of abundance described
above. The working group rated both the assessment and data inputs high quality. The assessment is appropriate for the stock and
estimates stock status relative to reference points which are appropriate and can be estimated.

Page 16                                                                                   New Zealand Inshore Trawl Fishery Report 2017
(b) Uncertainty and Peer review
BAR1, BAR5, BAR7                                                                                                              LOW RISK
The process of CPUE standardisation accounts for some uncertainties, while trawl survey results provide an independent measure of
abundance against which the CPUE analysis can be compared. Methods of standardisation and outputs are reviewed through the MPI
working group process, which includes independent scientists and stakeholders. Any major sources of uncertainty are reported
through the Fisheries Plenary reports.

FLA3                                                                                                                          LOW RISK
The process of CPUE standardisation accounts for some uncertainties, while trawl survey results for lemon sole provide an
independent measure of abundance against which the CPUE analysis can be compared. Methods of standardisation and outputs are
reviewed through the MPI working group process, which includes independent scientists and stakeholders. Any major sources of
uncertainty are reported through the Fisheries Plenary reports.

FLA7                                                                                                     PRECAUTIONARY HIGH RISK
No stock assessment information was available.

GUR1, GUR2, GUR3, GUR7                                                                                                        LOW RISK
The process of CPUE standardisation accounts for some uncertainties, while alternative indices of abundance are used where available
(e.g. trawl survey CPUE for GUR 3 and GUR 7). Outcomes of assessments are reviewed through the MPI working group process which
involves independent scientists and stakeholders.

TAR1, TAR2, TAR3, TAR7                                                                                                        LOW RISK
The process of CPUE standardisation accounts for some uncertainties, while alternative indices of abundance are used where available
(e.g. TRA 3, TRA 7). The major uncertainties are set out in the Fisheries Plenary reports (stock structure, relationship between CPUE
and biomass). Outcomes of assessments are reviewed through the MPI working group process which involves independent scientists
and stakeholders.

TRE1                                                                                                     PRECAUTIONARY HIGH RISK
The 2015 and 2016 preliminary assessments of TRE 1 sub-stocks were rejected by the working group (MPI, 2017).

TRE7                                                                                                                          LOW RISK
 The 2015 assessment takes uncertainty into account using Bayesian techniques, as well as undertaking multiple model runs to test
sensitivities to alternative parameters settings (MPI, 2017). The assessment is reviewed through the MPI working group process which
involves independent scientists and stakeholders.

PI SCORE             LOW RISK – BAR1, BAR5, BAR7, FLA3, GUR1, GUR2, GUR3, GUR7, TAR1, TAR2, TAR3, TAR7
                     PRECAUTIONARY HIGH RISK – FLA7, TRE1

COMPONENT 2: Environmental impact of fishing

2A: Other Species
CRITERIA: (i) The UoA aims to maintain other species above the point where recruitment would be impaired (PRI) and
does not hinder recovery of other species if they are below the PRI.
(a) Main other species stock status
Trawl UoAs                                                                                               PRECAUTIONARY HIGH RISK
The intent of this scoring issue is to examine the impact of the UoA on ‘main’ other species taken while harvesting the target species.
‘Main’ is defined as any species which comprises >5% of the total catch (retained species + discards) by weight in the UoA, or >2% if it
is a ‘less resilient’ species. The aim is to maintain other species above the point where recruitment would be impaired and ensure
that, for species below PRI, there are effective measures in place to ensure the UoA does not hinder recovery and rebuilding.
New Zealand’s inshore trawl fisheries are complex, multi-species fisheries, harvesting a wide range of inshore finfish species. The
composition of the catch can vary considerably in space and time based on variations in recruitment, changes in market demand and
the like. Information on the retained portion of the catch is very strong, reported and verified through the QMS reporting
arrangements. Information on the discarded portion of the catch is considerably more limited. Observer coverage in inshore fisheries
has historically been very low (or absent from some sectors), and the main information on overall catch composition comes from
independent trawl surveys, which may not be an accurate reflection of commercial catch composition (for example different gear may
be used). There is also limited reporting of discards in commercial catch returns. The assessment of each UoA is further complicated
because many of the species being assessed are in practice taken as bycatch species across a number of inshore trawl sectors.

Page 17                                                                                   New Zealand Inshore Trawl Fishery Report 2017
Because no information is available on total catch composition (retained + discarded) for each UoA assessed here, for the purposes of
this assessment we have examined information on retained and discarded species separately. Information on retained species
composition was drawn from Bentley et al (2013) which summarises reported landings from 1989-90 to 2013 across different inshore
trawl sectors. Based on this information, the stocks likely to comprise >5% of the retained catch for each UoA are outlined in Table 2.
It is possible that a number of stocks below which comprise ~5-10% of the retained species catch may not comprise >5% of the total
catch if discard information was available, and therefore would not ordinarily be considered. To that extent, the number of species
considered below is likely to err on the side of being precautionary (at least for the retained species). Information on discards is
considered separately below.
Table 2: Stocks likely to comprise >5% of the retained catch in the assessed UoAs, according to catch compositions reported by Bentley
et al (2013).
Stock/UoA Stocks likely to comprise >5% of retained catch
Barracouta
BAR 1 TAR 1, TAR 2, SNA 1
BAR 5 RCO 3, STA 5, TAR 5, WAR 3,
BAR 7 TAR 1, TAR 8, SNA 8
Flatfish
FLA 3 RCO 3, RSK 3, ELE 3, ELE 5, GUR 3
FLA 7 RCO 7, GUR 7
Gurnard
GUR 1 SNA 1, SNA 8, JDO 1, LEA 1, TAR 1
GUR 2 TAR 2, SNA 2, TRE 2, BAR 1, FLA 2
GUR 3 RCO 3, BAR 4, BAR 5, FLA 3
GUR 7 FLA 7, BAR 7, STA 7, RCO 7, TAR 7
Tarakihi
TAR 1 SNA 1, SNA 8, BAR 1, BAR 7, TRE 1, TRE 7
TAR 2 BAR 1, SNA 2, GUR 2
TAR 3 RCO 3, SPD 3, RSK 3, BAR 4, STA 3
TAR 7 BAR 7, RCO 7, STA 7, WAR 7
Trevally
TRE 1 - trawl SNA 1, TAR 1, BAR 1, JDO 1
TRE 1 – purse seine JMA 1, KAH 1, EMA 1
TRE 7 SNA 7, SNA 8, GUR 7, BAR 7, TAR7
The likely position of each main other species stock against the scoring guidelines is summarised in Table 3. Information for
summaries was drawn from the 2017 Fisheries Plenary MPI (2017).
Table 3: Status of main other species stocks in relation to the point of recruitment impairment, and extent to which measures are in
place to ensure UoAs do not hinder recovery if below PRI.
Above PRI?
Measures to
Stock Comments
ensure
recovery?*
Snapper
SNA 1 Two main stocks as likely as not to be below soft limit. Model five year projections using recent
catches for the commercial fleet and recent exploitation rates for the recreational fishery predict
increasing SSBs in East Northland and in the Hauraki Gulf-Bay of Plenty combined, however
overfishing likely to be occurring at current catch levels. New management plan for SNA 1 under
development.
SNA 2 The stock is unlikely to be below the soft limit; catches are below MSY; stock biomass expected to
have increased slowly over the last decade if recruitment has been maintained at or above long-
term average levels.
SNA 7 Stock unlikely to be below soft limit; catches below MSY; demonstrable evidence of recovery
SNA 8 Stock likely to be below PRI, however TACC was reduced to 1300 t from 1 October 2005 the to
ensure a faster rebuild of the stock. At this TACC level the predicted rebuild to BMSY (20% B0)
occurred after 2018. These measures would ordinary comprise a strategy, however there has
been no stock assessment since 2005 so the extent to which the strategy has been successful is
not clear.
Tarakihi
TAR 1 See details above. Stock position against reference points unknown. Unknown if current catch
limits will result in overfishing.
Page 18 New Zealand Inshore Trawl Fishery Report 2017You can also read