Mangroves are an overlooked hotspot of insect diversity despite low plant diversity
←
→
Page content transcription
If your browser does not render page correctly, please read the page content below
Yeo et al. BMC Biology     (2021) 19:202
https://doi.org/10.1186/s12915-021-01088-z

 RESEARCH ARTICLE                                                                                                                                      Open Access

Mangroves are an overlooked hotspot of
insect diversity despite low plant diversity
Darren Yeo2*, Amrita Srivathsan2, Jayanthi Puniamoorthy2, Foo Maosheng3, Patrick Grootaert4, Lena Chan5,
Benoit Guénard6, Claas Damken7, Rodzay A. Wahab7, Ang Yuchen3 and Rudolf Meier1,2*

  Abstract
  Background: The world’s fast disappearing mangrove forests have low plant diversity and are often assumed to
  also have a species-poor insect fauna. We here compare the tropical arthropod fauna across a freshwater swamp
  and six different forest types (rain-, swamp, dry-coastal, urban, freshwater swamp, mangroves) based on 140,000
  barcoded specimens belonging to ca. 8500 species.
  Results: We find that the globally imperiled habitat “mangroves” is an overlooked hotspot for insect diversity. Our
  study reveals a species-rich mangrove insect fauna (>3000 species in Singapore alone) that is distinct (>50% of
  species are mangrove-specific) and has high species turnover across Southeast and East Asia. For most habitats,
  plant diversity is a good predictor of insect diversity, but mangroves are an exception and compensate for a
  comparatively low number of phytophagous and fungivorous insect species by supporting an unusually rich
  community of predators whose larvae feed in the productive mudflats. For the remaining tropical habitats, the
  insect communities have diversity patterns that are largely congruent across guilds.
  Conclusions: The discovery of such a sizeable and distinct insect fauna in a globally threatened habitat underlines
  how little is known about global insect biodiversity. We here show how such knowledge gaps can be closed
  quickly with new cost-effective NGS barcoding techniques.
  Keywords: Insect biodiversity, Mangroves, NGS barcoding, Species discovery, Beta-diversity, Global insect decline,
  Southeast Asia

Background                                                                                understanding of geographic and temporal species turn-
Insects are currently experiencing anthropogenic bio-                                     overs for invertebrates [13–15]. These knowledge gaps
diversity meltdowns with declines having attracted much                                   are likely to threaten the health of whole ecosystems
attention [1–4] and controversy [5–10]. The controversy                                   given that arthropods provide important ecosystem ser-
is largely due to the paucity of high-quality, quantitative                               vices [3, 16–19], contribute much of the terrestrial ani-
arthropod data with sufficient taxonomic resolution. The                                  mal biomass (~10%) [20], and are yet frequently ignored
same paucity is also responsible for imprecise estimates                                  in habitat assessments. The lack of baseline data is par-
of global animal species richness [11, 12] and our poor                                   ticularly worrisome at a time when tropical ecosystems
                                                                                          are heavily impacted by habitat conversion and global
                                                                                          change [21].
* Correspondence: dbsdy@nus.edu.sg; Rudolf.Meier@mfn.berlin
1
 Center for Integrative Biodiversity Discovery, Leibniz Institute for Evolution
                                                                                             The situation is particularly dire for the species-rich
and Biodiversity Science, Museum für Naturkunde, Invalidenstr. 43, Berlin                 tropics, for which few comprehensive surveys have been
10115, Germany                                                                            conducted [22–24]. For example, only three of 73 stud-
2
 Department of Biological Sciences, National University of Singapore, 14
Science 8 Drive 4, Singapore 117543, Singapore
                                                                                          ies in a recent review of insect declines involved tropical
Full list of author information is available at the end of the article                    sites [8]. Furthermore, tropical insect surveys have
                                           © The Author(s). 2021 Open Access This article is licensed under a Creative Commons Attribution 4.0 International License,
                                           which permits use, sharing, adaptation, distribution and reproduction in any medium or format, as long as you give
                                           appropriate credit to the original author(s) and the source, provide a link to the Creative Commons licence, and indicate if
                                           changes were made. The images or other third party material in this article are included in the article's Creative Commons
                                           licence, unless indicated otherwise in a credit line to the material. If material is not included in the article's Creative Commons
                                           licence and your intended use is not permitted by statutory regulation or exceeds the permitted use, you will need to obtain
                                           permission directly from the copyright holder. To view a copy of this licence, visit http://creativecommons.org/licenses/by/4.0/.
                                           The Creative Commons Public Domain Dedication waiver (http://creativecommons.org/publicdomain/zero/1.0/) applies to the
                                           data made available in this article, unless otherwise stated in a credit line to the data.
Yeo et al. BMC Biology   (2021) 19:202                                                                           Page 2 of 17

traditionally focused on rainforests [24], with other habi-    insect diversity, (2) evaluates the distinctness in refer-
tats being largely neglected. Mangrove forests are a           ence to five different forest habitats, (3) analyzes the bio-
prime example of a tropical habitat for which the insect       diversity patterns by ecological guild, and (4) determines
fauna is poorly characterized. Mangroves used to cover         species turnover across Southeast and East Asia. Most of
more than 200,000 km2 of the global coastline [25], but        the work was carried out in Singapore because it has a
have been experiencing an annual area loss of 1–2% [25,        large variety of different habitats that occur within 40
26]. Indeed, the losses of mangroves far exceed those of       km on a small island (724 km2) that lacks major physical
more high-profile ecosystems such as rainforests and           barriers. In addition, all habitats have experienced simi-
coral reefs [26]. Unfortunately, these losses are further      lar levels of habitat degradation or loss (>95% overall
exacerbated by climate change [27], with some simula-          loss of original vegetation cover [48], ca. 90% loss of
tions predicting a further reduction by 46–59% for all         rainforest [49], ca. 93% loss of swamp forest [50], 91%
global coastal wetlands by the year 2100 [28]. This is         loss for mangroves [51]).
particularly worrying as mangrove ecosystems seques-             A thorough assessment of insect biodiversity requires
trate a particularly large amount of carbon per hectare        dense sampling over an extended period of time [52–
[29]. These changes will not only endanger entire eco-         54]. We sampled 107 sites in Singapore using Malaise
systems that provide essential ecosystem services [30–         traps. All samples were subsequently sorted to 13
32], but also threaten the survival of numerous man-           arthropod orders (Additional file 1: Table S1) with Dip-
grove species with unique adaptations. Mangrove spe-           tera and Hymenoptera contributing the largest propor-
cialists with such adaptations are well known for              tions of specimens (>75%: Additional file 1: Table S1,
vertebrates and vascular plants [33, 34], but the inverte-     see Additional file 2: Figure S2 for species composition).
brate diversity is poorly known.                               We here analyze the diversity patterns for a subset of
   One reason why the mangrove insect fauna may have           taxa that represent different ecological guilds (see the
received little attention is low plant diversity. Tropical     “Materials and Methods” section; Additional file 1: Table
arthropod diversity is usually strongly positively corre-      S2). The NGS-barcoded 140,000 specimens [55] were
lated with plant diversity [23, 24, 35] which suggested        grouped into putative species. This allowed for estimat-
that mangroves would not be species-rich for insects           ing species richness and abundance [56–58]. Contrary to
and would thus provide few insights into one of the key        expectations, we find that mangrove forests have a very
questions in insect biodiversity, viz. understanding           distinct and rich insect fauna. In addition, the species
whether insect herbivores drive high plant diversity in        turnover for all habitats in Singapore and the different
the tropics [36–38] or vice versa [22, 39]. Arguably, the      mangrove sites in Asia is high.
traditional focus on this question may have had the un-
desirable side-effect that the insect fauna of habitats with   Results
low plant diversity have received little attention. For ex-    Species delimitation based on NGS barcodes
ample, the few existing studies of mangrove insects fo-        We initially obtained 144,865 313-bp cox1 barcodes but
cused on specific taxa [40–42], only identified specimens      then excluded from analysis those Malaise trap samples
to higher taxonomic levels [43–45], and/or lacked quan-        that contained 140,000 barcoded specimens obtained over >4 years             cies boundaries were stable, with species numbers only
from mangroves, rainforests, swamp forests, disturbed          varying by
Yeo et al. BMC Biology   (2021) 19:202                                                                         Page 3 of 17

Thereafter, we broadened the analysis to the full dataset     and (3) remaining arthropods (Fig. 2b). This habitat-
(144,356, see the Methods section for sampling de-            driven structure was verified with a multivariate analysis
tails) including data for all orders and sites. We found      of variance (MANOVA) test on the NMDS1 & NMDS2
that the conclusions for mangrove insect diversity            coordinates, with habitat being a highly significant vari-
were consistent across the datasets. Therefore, subse-        able (p < 0.001) in explaining the variance in the com-
quent analyses were based on the full dataset, but the        bined NMDS coordinate distributions and each
corresponding results for the core dataset are pre-           coordinate separately. These results are also robust to
sented in Additional file 2: Figures S4 and S5.               the removal of rare species (Fig. 2a; applies to NMDS
                                                              plots and MANOVA). Only 48 (0.6%) of the 8572 puta-
                                                              tive species in the species turnover analysis are found in
Alpha-diversity across habitats
                                                              all habitat types while 5989 (69.9%) are only found in a
We rarefied the species richness curves by sample cover-
                                                              single one (Additional file 1: Table S4); 3557 species are
age [61] (Fig. 1) for each habitat, as well as by the num-
                                                              only known from mangroves which shared the largest
ber of barcoded specimens (Additional file 2: Figure S3).
                                                              number of species with coastal forests (873 of 3557 spe-
Alpha-diversity comparisons were made at the rarefac-
                                                              cies). When rare species are removed (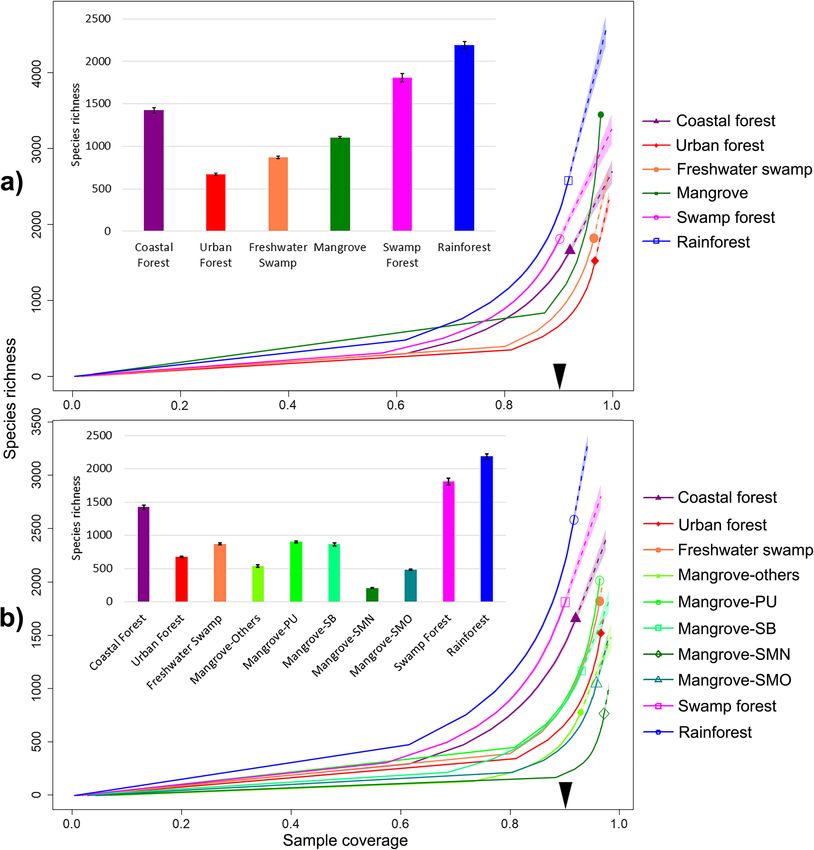
Yeo et al. BMC Biology      (2021) 19:202                                                                                                 Page 4 of 17

 Fig. 1 Insect alpha-diversity across tropical forest habitats. a Mangroves treated as one habitat; b Comparison of mangrove sites: Pulau Ubin (PU),
 Sungei Buloh (SB), Pulau Semakau old-growth (SMO), Pulau Semakau new-growth (SMN), other smaller mangrove fragments (see Additional File
 1: Table S13); solid lines = rarefaction; dotted = extrapolations. The arrow on the x-axis indicates the point of rarefaction where species richness
 comparisons were made (see bar charts for absolute numbers with 95% confidence intervals)

Relationship between insect and plant richness                               [69] (839 species in 52 plots of 100m2) and swamp forest
Compared to mangroves (ca. 250 plant species), the                           [70] (671 species in 40 plots of 400m2). However, the in-
rainforest and swamp forest sites have 4.6 or 7.6 times                      sect biodiversity of the rainforest and swamp forest sites
the number of recorded species based on checklists for                       is only 1.64–1.98 times higher than in the mangroves
the sites (Additional file 1: Table S8). This higher species                 after rarefaction (1.99–2.52 times higher in the core
richness is also confirmed by plot data for the rainforest                   dataset).
Yeo et al. BMC Biology (2021) 19:202 Page 5 of 17
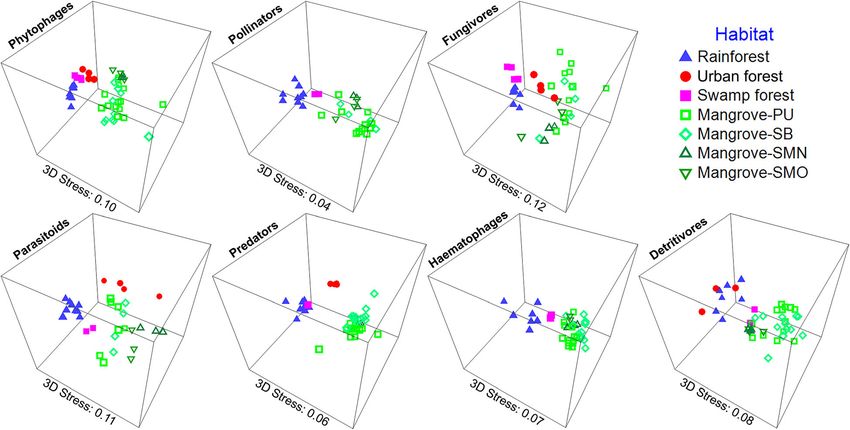
Fig. 2 Insect communities across tropical forest habitats are distinct based on Bray-Curtis distances illustrated on 3D NMDS plots. Results are
stable even when rare species are removed (a) or the data are split into different taxonomic groups (b)
Table 1 Species turnover across habitats. Distinctness of communities in each habitat type as assessed with ANOSIM (pairwise p
value below and R-statistics above diagonal)
Overall P: 0.001 Overall R: 0.784
Rainforest Urban forest Swamp forest Mangrove Freshwater swamp Coastal forest
Rainforest 0.817 0.983 0.953 0.973 0.955
Urban forest 0.001 0.759 0.815 0.575 0.172
Swamp forest 0.001 0.001 0.934 0.769 0.893
Mangrove 0.001 0.001 0.001 0.856 0.546
Freshwater swamp 0.001 0.001 0.008 0.001 0.341
Coastal forest 0.001 0.079 0.005 0.001 0.017Yeo et al. BMC Biology (2021) 19:202 Page 6 of 17
Table 2 Species turnover across habitats. Distinctness of communities in each habitat type as assessed with SIMPER
Within Between habitats (%)
habitat
Rainforest Urban forest Swamp forest Mangrove Fresh-water swamp Coastal forest
(%)
Rainforest 29.59
Urban forest 12.91 3.20
Swamp forest 31.10 13.88 2.94
Mangrove 12.25 1.62 3.09 1.98
Freshwater swamp 17.29 2.13 4.69 4.10 2.74
Coastal forest 12.09 3.82 9.41 4.00 6.08 9.05
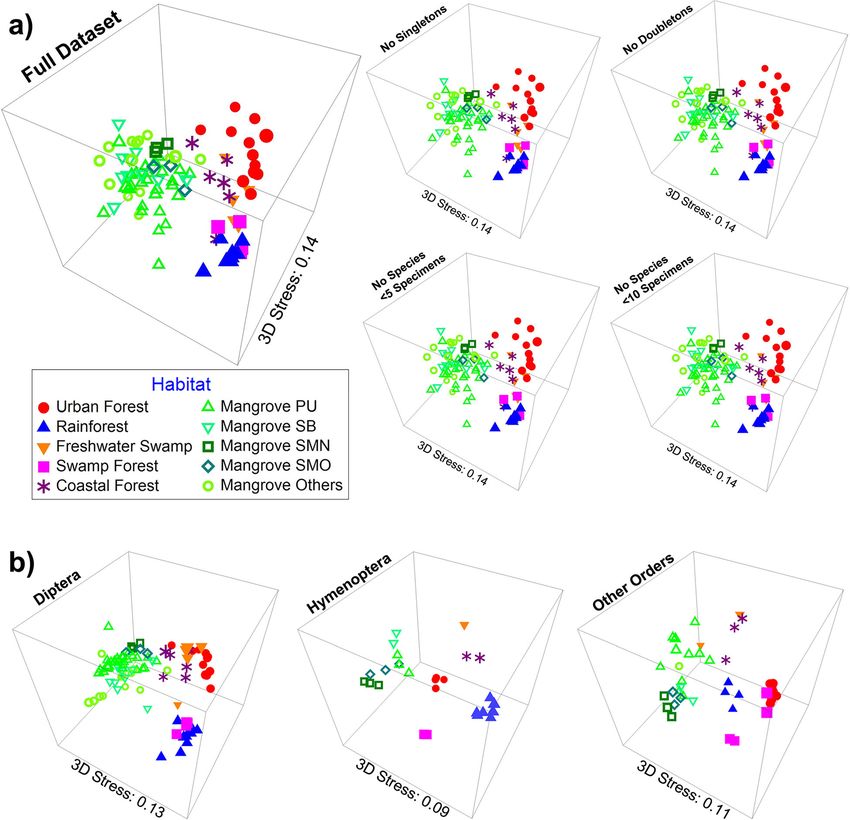
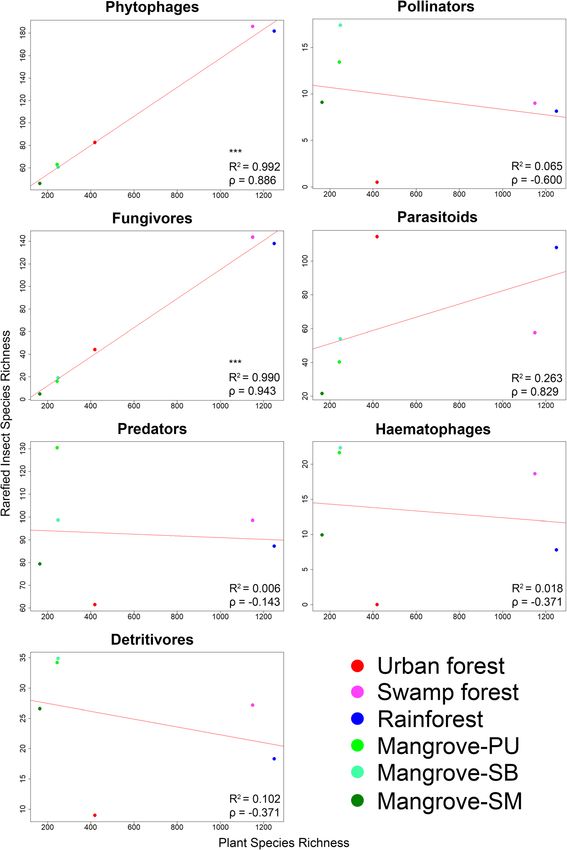
Analysis of ecological guilds and correlation between plant diversity was found to be highly significantly and
insect and plant diversity positively correlated with the alpha-diversity of phyt-
For this analysis, we used the core dataset which was ob- ophagous and fungivorous insects (p < 0.001, R2 = 0.992
tained from traps with at least 6 months continuous and 0.990, p = 0.886 and 0.943, respectively).
sampling covering a dry- and wet season (April–Septem- The different habitat types vary in composition (Fig. 4
ber). We only analyzed some Diptera and Hymenoptera & Additional file 1: Table S9). Rainforest and freshwater
taxa that were sufficiently abundant and could be swamp forest sites have higher numbers and proportions
assigned to a broad range of ecological guilds. Note that of phytophagous and fungivorous insect species (see also
these orders were chosen because they dominate Malaise Additional file 2: Figures S7 & S8). The insect communi-
trap samples (see Brown 2005 [71] & Hebert et al. 2016 ties of mangroves, however, are characterized by an ele-
[72]). To understand how different habitats maintain in- vated proportion of predatory species. With regard to
sect diversity, we assigned insect species with known species turnover, insect communities are separated by
family/genus identities to ecological guilds (42,092 speci- habitat for most guilds and in most pairwise compari-
mens belonging to 2230 putative species; no guild infor- sons (Fig. 5, Additional file 1: Tables S10 & S11).
mation is available for the remaining 19,974 specimens).
After stepwise refinement of an analysis of covariance Species turnover across Asian mangroves
(ANCOVA) model, the final model was defined as: The specimens from Hong Kong belonged to 109 doli-
insectdiv ~ habitat + guild + plantdiv + guild:plantdiv chopodid, 129 phorid, and 25 mycetophilid species. The
(insectdiv: insect species richness, plantdiv: plant species corresponding number for Brunei were 96 and 76 spe-
richness). The type-II sum of squares test reveals that cies for dolichopodids and phorids, with too few myceto-
guild and the interaction term between guild and plant philids being available for evaluation (Additional file 1:
diversity are highly significant (p < 0.001), while plant di- Table S12). The southern Thai dolichopodids belonged
versity (p = 0.063) and habitat (p = 0.468) are not. This to 74 species. We find high species turnover between
suggests guild and plant diversity together play an im- Hong Kong, Brunei, and Singapore, even after rarefying
portant role in determining insect diversity but the pre- the specimen sample sizes (Additional file 2: Figure S9).
cise relationship warranted further testing. Single Approximately 90% of all dolichopodid and phorid spe-
variable linear regressions (insectdiv ~ plantdiv) were cies are unique to each region withYeo et al. BMC Biology (2021) 19:202 Page 7 of 17 Fig. 3 Only the diversity of phytophagous and fungivorous insects is correlated with plant diversity based on a linear regression model using rarefied insect species richness (*≤0.05, **≤0.01, ***≤0.001). Color coding of points as in Fig. 2
Yeo et al. BMC Biology    (2021) 19:202                                                                                           Page 8 of 17

 Fig. 4 Voronoi treemap of insect guilds across four habitats. Mangroves are represented by four sites (PU=Pulau Ubin, SB=Sungei Buloh, SMO:
 Semakau old mangrove, SMN: Semakau restored mangrove). Phytophages and fungivores dominate the rain and swamp forests while predators
 are overrepresented in mangroves

mycetophilids of Hong Kong and Singapore (>95%). Spe-                    fauna is also very unique. More than half of its species
cies turnover for the dolichopodids of Southern                          are not found in other habitats, even though coastal for-
Thailand and Singapore is again high with only 11.5% of                  ests are directly adjacent to mangroves. Indeed, after
all species shared between both countries.                               adjusting for sampling effort, the species diversity in Sin-
                                                                         gapore’s premier rainforest reserve (Bukit Timah Nature
Discussion                                                               Reserve: 1.64 km2) and largest swamp forest remnant
Discovery of a largely overlooked, predator-enriched                     (Nee Soon: 5 km2) is only 50% higher than the diversity
insect community in mangroves                                            of major mangrove sites (PU: 0.904 km2, SB: 1.168 km2,
It is often assumed that the insect diversity in mangroves               SM: 0.174 km2). The high diversity encountered in the
is low because high salinity and low plant diversity are                 mangrove sites was particularly unexpected because the
thought to be unfavourable to insect diversification [23,                rainforests of Bukit Timah Nature Reserve have been
73, 74]. However, we here show that mangroves are                        protected for more than 50 years [78, 79] and have very
species-rich for insects despite low plant diversity (
Yeo et al. BMC Biology (2021) 19:202 Page 9 of 17 Fig. 5 Habitat differentiation by insect guilds (3D NMDS plot of Bray-Curtis distances for habitats with >2 sites) we expected the insect diversity of Singapore’s largest mangroves and coastal forests which is presumably due swamp forest (Nee Soon) to greatly exceed the number to the close proximity of the habitats on Pulau Ubin of species found in the mangrove sites because this where back mangroves and coastal forests are contigu- swamp forest site is known for its high species richness ous (Additional file 2: Figure S1). The uniqueness of the (e.g., 1150 species of vascular plant species [81]). mangrove insect community is probably due to the un- A guild-level analysis reveals that rainforests and usual environmental conditions characterized by ex- swamp forests have overall the highest species diversity treme daily fluctuations in salinity, temperature, and for most guilds (Additional file 2: Figure S7). Mangroves inundation. These extreme conditions are likely to re- maintain high species diversity although they are impo- quire physiological and behavioral adaptations that sup- verished for phytophagous and fungivorous species. port an evolutionarily distinct fauna. What is surprising, Mangroves are, however, home to a disproportionally however, is that we find no evidence for an adaptive ra- large proportion of predatory species (Fig. 4) whose lar- diation of particular clades. Instead, a large number of vae develop in sediments (Empidoidea and Tabanidae). independent colonization events seems more likely given This suggests that the high insect diversity in tropical that the mangrove species usually belong to genera that habitats may be achieved by having large proportions of are also known from other habitats (e.g., Dolichopodi- species developing in the biologically most productive dae). This challenges the view that high salinity is a po- microhabitats—plants and fungi for many forest habitats tent colonization barrier for invertebrates [73, 74] over and the highly productive mud flats for mangroves. evolutionary time scales. In addition to finding high alpha-diversity in man- Mangrove regeneration is pursued in many countries, groves, we also document that the mangrove insect com- with mixed successes in restoring the original plant di- munities are very distinct. This conclusion is supported versity [82, 83], but it remains poorly understood by a multitude of analyses (mvabund, ANOSIM, SIM- whether regenerated mangroves harbour the original PER, NMDS). It is furthermore insensitive to the re- arthropod biodiversity. Our preliminary data based on moval of rare species (Fig. 2) and driven by high species 311 Malaise trap samples from one regenerated site sug- turnover rather than nestedness (see Table 3). This gests that this is not the case. The regenerated mangrove stratification by habitats is still evident even when the (SMN) was replanted with a monoculture of Rhizophora two dominant insect orders in Malaise trap samples stylosa [77] which replaced old-growth mangroves that (Diptera and Hymenoptera) are removed (Fig. 2). Com- had been cleared during reclamation (1994–1999 [51]). paratively high overlap is only observed between The restored site (SMN) has markedly lower insect
Yeo et al. BMC Biology   (2021) 19:202                                                                      Page 10 of 17

species richness than all other mangrove sites, including    the ~140,000 specimens in our study could today be ob-
a neighbouring old-growth mangrove (SMO; Fig. 1).            tained for 150 manpower years [92]; i.e., some of the trad-
vertebrate data [84].                                        itional obstacles to understanding arthropod biodiversity
  Mangrove insect communities are not only rich and          caused by the taxonomic impediments may be finally
distinct in Singapore. Within Asia, we reveal a 92% spe-     disappearing. However, it is important to remember that
cies turnover between Singapore and Hong Kong (2,500         barcode-derived units are only proxies for formal species
km north; Additional file 2: Figure S1) for taxa repre-      and should only be used for broad analyses of diversity
senting different guilds (Dolichopodidae–predators: 483      patterns. Additional taxonomic work may uncover, for
species, Mycetophilidae–fungivores: 67 species, Phori-       example, rapid radiations in particular habitats or guilds
dae–mostly saprophagous: 591 species). While climatic        that would be overlooked by studies that rely on cluster-
differences could be advanced as a potential explanation,    ing barcodes based on similarity only [93]. This is why
comparisons with the mangroves in the geographically         the rich dolichopodid fauna is currently being revised
close and tropical Borneo (Brunei) confirm a high spe-       using the “reverse workflow” approach where morpho-
cies turnover of 85% (see also Grootaert 2019 [85]). Fur-    logical validation follows pre-sorting with barcodes [56,
ther evidence for high regional species turnover in          85, 94].
mangroves emerges when the dolichopodid fauna of Sin-
gapore’s and Brunei’s mangroves are compared with the        Conclusions
fauna of Southern Thailand (coasts of South China and        We here document that the insect fauna inhabiting
Andaman seas). Only 34 and 10 of the 74 known Thai           mangroves is not only rich, but also distinct. The discov-
species are shared with Singapore and Brunei, respect-       ery of such an unexpectedly rich and distinct insect
ively. These data suggest that a significant proportion of   community highlights how little we know about global
the global insect diversity may reside in mangroves.         arthropod diversity. Accelerating species discovery for
Based on the data from Singapore, it appears that much       arthropods is a pressing task given that many under-
of the diversity may be resilient to disturbance, given      sampled habitats are disappearing at a much faster rate
that we find no evidence that the insect diversity in Sin-   than tropical rainforests and coral reefs. Fortunately, ad-
gapore’s mangrove fragments is depressed relative to         vances in sequencing technology will facilitate this work
what is found in the much more pristine sites in Brunei.     and we predict that mangroves will be only one of many
This also suggests that the loss of species diversity for    additions to the fast growing list of habitats that have
small, flying insects in Singapore may not have been as      only recently been recognized as biodiversity hotspots
dramatic as what has been observed for Singapore’s ver-      (e.g., dry forests [95, 96], forest savannahs [97, 98]).
tebrate and large invertebrate species [48, 86, 87].
                                                             Methods
Discovering a new insect hotspot with NGS barcoding          Sampling site, sample collection, and processing
Global insect declines have recently received much at-       Singapore has a large number of tropical habitat types
tention by the scientific community [2] and public [88].     that are all within 40 km of each other without being
Obtaining relevant data is very slow and expensive when      separated by major physical barriers. This allowed us to
conventional techniques are used. This is so because too     sample rainforests (from early secondary to mature sec-
many specimens have to be sorted into too many species       ondary forest), urban-edge forests, mangroves, swamp
before a holistic habitat assessment can be carried out      forests, freshwater swamps, and dry coastal forests. Note
[89]. In our study, this problem is overcome by specimen     that these habitats have in Singapore experienced similar
sorting using NGS barcodes, which differ from trad-          levels of habitat degradation or loss due to urbanization
itional barcodes by costing only a fraction of those ob-     (>95% loss of original vegetation cover [48], ca. 90% loss
tained with Sanger sequencing. Yet, species richness         for rainforests [49], ca. 93% loss of swamp forest [50],
estimates based on 313-bp NGS barcodes have a 90%            91% loss for mangroves [51]). The freshwater swamp dif-
congruence with estimates based on morphological data        fers from the swamp forest by lacking mature trees,
[56, 57, 90, 91]. This suggests that large-scale species     while the dry coastal forests are distinct from the man-
discovery with NGS barcodes can yield sufficiently ac-       groves by lacking typical mangrove tree species. We
curate information on species abundance and distribu-        sampled these habitat types using 107 trapping sites
tion for habitat assessments [55, 56]. This also means       (Additional file 2: Figure S1). The mangrove sites were
that NGS barcodes could be used for quickly revealing        located primarily along the North-western and Southern
hidden hotspots of insect diversity in countries with high   coasts of the mainland, as well as on offshore islands in
diversity and limited science funding. We estimate that      the south and northeast. The major mangrove sites were
Yeo et al. BMC Biology (2021) 19:202 Page 11 of 17 on Pulau Ubin (PU), Sungei Buloh (SB), and Pulau Staphylinidae, Elateridae, Cantharidae, Buprestidae, Cur- Semakau (SM), and the last of which is represented by culionoidea, other Coleoptera, Diptera: Tipuloidea, an old-growth (SMO) and a newly regenerated man- Mycetophilidae, Keroplatidae, Culicidae, Chironomidae, grove fragment (SMN). Other smaller mangrove frag- Sciaridae, other Nematocera, Dolichopodidae, other ments across the island were also sampled (Mandai Empidoidea, Stratiomyidae, Syrphidae, Asilidae, Tabani- Nature Park, Pulau Tekong, Sarimbun, Labrador Park, dae, Phoridae, other acalyptrates, Calyptrates, Dermap- Lim Chu Kang, Coney Island—see Additional file 1: tera, Hemiptera: Reduviidae, Dipsocoromorpha, other Table S13) and were labeled “Mangrove—others” in the Heteroptera, Auchenorrhyncha, Sternorrhyncha, other diversity analyses. The swamp forest site (Nee Soon) was Homoptera, Hymenoptera: Apoidea, Formicidae, Lepi- Singapore’s largest remaining freshwater swamp doptera, Mantodea, Neuroptera, Orthoptera, Psocodea, remnant which is known for a rich insect fauna [99], and Trichoptera. In some cases, we used broader cat- overall high species richness, and level of endemism egories that could be communicated to the parataxono- [100, 101]. Bukit Timah Nature Reserve was selected as mists but did not represent formal taxa (“other the tropical rainforest site given its high species diversity acalyptrates”). All subsequent barcoding used these sub- and protected status [78]. This reserve consists of forests samples as sampling units. Overall, the samples were in various stages of succession, and hence, we sampled typical for Malaise traps in that they were dominated by different forest types with three sites each being in pri- Diptera and Hymenoptera (>75% of specimens: Add- mary forest, old secondary forest, and maturing second- itional file 1: Table S1, see Additional file 2: Figure S2 ary forest. The “urban secondary forest” sites were for species composition). We therefore first developed a located along a disturbance gradient ranging from the core dataset for these orders given that the specimen campus of the National University of Singapore (NUS) numbers were sufficiently high (62,066 specimens, 4002 through several urban parks and forest edges in Central species at 3% p-distance). This core dataset consisted of and South Singapore. The freshwater swamp site is lo- 12 Diptera families, “other Brachycera”, ants (Formici- cated primarily in Kranji, a freshwater marsh at the dae), and Apoidea (see Additional file 1: Table S1). This flooded edge of a reservoir. The “coastal forest” sites dataset also only included specimens from sites that were dry secondary forests adjacent to the coast at Lab- were sampled from 2012 to 2015 and overlapped with rador Park and Pulau Ubin. regard to the April to September period which covers a All specimens were collected between 2012 and 2019 dry and wet season. We subsequently added the avail- (Additional file 1: Table S13) using Malaise traps. These able data for other sites and orders. For most of these, traps are widely used for insect surveys because they are we barcoded all available specimens (Araneae, Blattodea, effective sampling tools for flying insects and allow for Dermaptera, Mantodea, Neuroptera, Orthoptera, Trich- standardized, long-term sampling. Note that the use of optera). Three insect orders had intermediate abun- Malaise traps in our study was appropriate because the dances (Coleoptera, Lepidoptera, Hemiptera, Psocodea). canopy height was comparable for most habitats given For Coleoptera, we processed easily recognized families that we compared mature mangroves (PU, SB, and by barcoding all specimens collected before 2019 (Sta- SMO) with a wet swamp forest site, and different kinds phylinidae, Cleridae, Cerambycidae, Scirtidae, Carabidae, of secondary forests. Only the canopy height of some Elateridae). For Lepidoptera, we processed all large spec- sites in Bukit Timah Nature Reserve (BTNR) was higher imens and only subsampled micromoths. For Hemiptera (pers. obs.), but for BTNR, we also included secondary and Psocodea, we sequenced all Heteroptera, but only forests and several traps were placed on steep slopes that subsampled the psocodean and homopteran planthop- would be able to sample canopy-active fauna from a pers because the abundances were too high (planthop- lower elevation. With regard to the habitat patches, the pers: 6987 specimens across 6 habitats; Psocodea: 539 fragments were larger for the rainforest and swamp for- specimens across 4 habitats). Here, the subsampling was est than for any of the mangrove sites (tropical rainfor- similar to what had been done for the core data set in est: 1.64 km2; swamp forest: 5 km2, mangrove forest that we barcoded all specimens for the samples of par- fragments: 0.904 km2 [PU], 1.168 km2 [SB], and 0.174 ticular time periods. km2 [SM] [51]). Malaise traps in the mangroves were set After obtaining barcodes, the taxa in the core dataset up in the intertidal zone. Each Malaise trap sample con- were re-identified to genus or family based on DNA bar- sisted of 1-week’s worth of insects preserved in molecu- codes that were submitted to the Global Biodiversity In- lar grade ethanol. formation Facility (GBIF: www.gbif.org) or the Barcode After an ethanol change, the specimens were sorted by of Life Data (BOLD: www.boldsystems.org) databases or para-taxonomists (Additional file 1: Table S1) into through morphological re-examination if the identifica- mostly orders or families: Arachnida, Blattodea: cock- tions were ambiguous. For the former, we only used roaches, termites, Coleoptera: Cicindelinae, Mordellidae, matches above 95% and 97% similarity for family- and
Yeo et al. BMC Biology   (2021) 19:202                                                                        Page 12 of 17

genus-level matches, respectively. In some cases, these       gels. The pooled samples were cleaned with Bioline Sur-
identifications revealed sorting errors by the parataxono-    eClean Plus and/or via gel cuts before outsourcing li-
mists. The barcodes were nevertheless kept for the di-        brary preparation to AITbiotech using TruSeq Nano
versity analyses because such sorting errors are random       DNA Library Preparation Kits (Illumina) or the Genome
across samples.                                               Institute of Singapore (GIS) using NEBNext DNA Li-
  The mangrove specimens from Hong Kong were col-             brary Preparation Kits (NEB). Paired-end sequencing
lected by 24 Malaise traps installed between October          was performed on Illumina Miseq (2×300-bp or 2×250-
2017 to October 2018, while those from Brunei were            bp) or Hiseq 2500 platforms (2×250-bp) over multiple
collected by six Malaise traps from July to November          runs, thereby allowing troubleshooting and re-
2014. Dolichopodidae, Phoridae, and Mycetophilidae            sequencing for specimens which initially failed to yield a
were pre-sorted and send for barcoding to Singapore.          sufficiently large numbers of reads. Some of the speci-
Note that the mangrove forests in Brunei are less af-         mens were also sequenced on the MinION (Oxford
fected by urbanization than those in Singapore. The           Nanopore) platform using primers with a slightly longer
dolichopodid specimens from Thailand were obtained by         tags (13-bp) and following the protocol described in Sri-
different techniques including sweep-netting from 42          vathsan et al. [57, 106]. Raw Illumina reads were proc-
mangrove sites over a period of 15 months from Mar            essed with the bioinformatics pipeline and quality-
2014 to Dec 2015.                                             control filters described in Meier et al. [55]. A BLAST
                                                              search to GenBank’s nucleotide (nt) database was also
Putative species sorting with NGS barcoding                   conducted to identify and discard contaminants by pars-
NGS barcoding combines the advantages of cost-                ing the BLAST output through readsidentifier [107] and
effective sequencing via Illumina with the approximate        removing barcodes with incorrect matches at >97%
species-level resolution provided by DNA barcodes. The        identity.
molecular procedures can be learned in hours, and sev-          To obtain putative species units, the cox1 barcodes
eral hundred specimens can be processed per person            were clustered over a range of uncorrected p-distance
and day. The overall barcode costs are now
Yeo et al. BMC Biology (2021) 19:202 Page 13 of 17 to_commatrix.py: see Appendix). To assess the species indicating greater distinctness. We also used the beta- richness of the six major habitat types, samples were rar- part [112] R package to examine if the observed dissimi- efied with the iNEXT [109] R package (R Development larity (Bray-Curtis) was due to species turnover or Core Team) using 1,000 bootstrap replicates in order to nestedness. The beta.multi.abund and beta.pair.abund account for unequal sampling completeness. The rar- functions were used to split the global and pairwise dis- efaction was performed by coverage [61] in the main similarity scores into turnover and nestedness compo- analysis (Fig. 1) and by specimen count in the supple- nents. Lastly, the robustness of the results was tested by mentary (Additional file 2: Figure S3). Site comparisons removing singleton, doubleton, and rare species (
Yeo et al. BMC Biology    (2021) 19:202                                                                                           Page 14 of 17

immatures with different natural histories (i.e., belong to             Availability of data and materials (Continued)
two distinct ecological guilds), the species counts were
                                                                                                    et al. [107]    asrivathsan/readsidentifier;
halved and placed into both guilds when calculating rar-                                                            github commit 3bf39b9
efied species abundance and richness. Guild distribution                Objective clustering        Meier et al.    https://github.com/
for each habitat was visualized with Voronoi treemaps                                               [59]            asrivathsan/obj_cluster;
via Proteomaps [113]. Species turnover for the guild-                                                               github commit 1d08240
specific subsets were analyzed with PRIMER to generate                  USEARCH 11.0.667            Edgar [60]      https://www.drive5.com/
NMDS plots, as well as ANOSIM and SIMPER values.                                                                    usearch
The rarefied species richness values were also used for a               Primer v7                   Clarke &        https://www.primer-e.com
multivariate model analysis. An ANCOVA model was                                                    Gorley [110]
constructed in R [114] with the lm function: insectdiv ~                Proteomaps 2.0              Liebermeister   https://bionic-vis.biologie.
                                                                                                    et al. [113]    uni-greifswald.de
site * habitat * guild * plantdiv, with insectdiv represent-
ing rarefied insect alpha-diversity and plantdiv repre-                 clusterlist_to_commatrix.py This paper      https://doi.org/10.6084/m9.
                                                                                                    [117]           figshare.14706090.v1
senting plant species counts. The “site” factor was
excluded due to collinearity, and the model was refined                 Rstudio 1.0.153             R               https://www.rstudio.com
                                                                                                    Development
via stepwise removal of factors starting with the most                                              Core Team
complex (interaction terms) and least significant ones.                                             [114]
At each stage, the anova function was used to assess loss               R 3.4.1                     R               https://cran.r-project.org/
of informational content and the final model was derived                                            Development     bin/windows/base
                                                                                                    Core Team
when the reported p value was significant (p < 0.05).                                               [114]
The model’s residuals were examined to ensure the data
                                                                        R 4.0.3                     R               https://cran.r-project.org/
were normal. Subsequently, the anova function from the                                              Development     bin/windows/base
car package [115] was used to obtain type-II test statis-                                           Core Team
tics. Finally, single-variable linear regression was per-                                           [114]
formed in R with the lm function: insectdiv ~ plantdiv                  R function CNE              Ronquist et al. https://github.com/
for each guild separately to obtain significance, multiple                                          [63]            ronquistlab/swedish-insect-
                                                                                                                    fauna
R-squared, and Spearman’s rho values.
                                                                        R package iNEXT 2.0.20      Chao et al.     https://cran.r-project.org/
                                                                                                    [109]           web/packages/iNEXT/index.
Appendix                                                                                                            html
Availability of data and materials                                      R package ggplot2 3.3.3     Hadley [118]    https://cran.r-project.org/
                                                                                                                    web/packages/ggplot2/
Reagent or resource       Source          Identifier                                                                index.html

Chemicals and reagents                                                  R package vegan 2.5-7       Oksanen et al. https://cran.r-project.org/
                                                                                                    [111]          web/packages/vegan/
QuickExtract              Lucigen         QE09050 and QE0905T                                                      index.html
Tris-HCL                  Promega         H5123                         R package car 3.0-10        Fox &           https://cran.r-project.org/
EDTA                      J.T.Baker       8993-01                                                   Weisberg        web/packages/car/index.
                                                                                                    [115]           html
Sodium Hydroxide          Merck           S5158-1-100.01.04.07
                                                                        R package breakaway 3.0     Willis & Bunge https://cran.r-project.org/
PCR Master Mix            CWBio           CW0682L                                                   [62]           web/packages/breakaway/
                                                                                                                   index.html
Bovine Serum Albumin      HyClone         SH40015.01
                                                                        R package betapart 1.5.2    Baselga &       https://cran.r-project.org/
SureClean Plus            Bioline         BIO-37048
                                                                                                    Orme [112]      web/packages/betapart/
Tagged primers            IDTDNA          See Srivathsan et al. [57]                                                index.html
Agarose A                 Biobasic        DD0012                        R package mvabund 4.1.9     Wang et al.     https://cran.r-project.org/
                                                                                                    [67]            web/packages/mvabund/
Gel-Red                   Biotium         41003-1                                                                   index.html
Software and algorithms                                                 Others
PEAR                      Zhang et al.    https://cme.h-its.org/        DNA barcode sequences       This paper      https://doi.org/10.6084/m9.
                          [116]           exelixis/web/software/pear                                [117]           figshare.14706090.v1
miniBarcoder              Srivathsan       https://github.com/          R commands                  This paper      https://doi.org/10.6084/m9.
                          et al. [57, 106] asrivathsan/miniBarcoder;                                [117]           figshare.14706090.v1
                                           github commit 1536d02
                                                                        2003Community matrices      This paper      https://doi.org/10.6084/m9.
BLAST 2.10.0              NCBI            https://blast.ncbi.nlm.nih.                               [117]           figshare.14706090.v1
                                          gov/Blast.cgi
Readsidentifier           Srivathsan      https://github.com/
Yeo et al. BMC Biology (2021) 19:202 Page 15 of 17
Supplementary Information Funding
The online version contains supplementary material available at https://doi. Financial support was provided by a Ministry of Education grant on
org/10.1186/s12915-021-01088-z. biodiversity discovery (R-154-000-A22-112), the Hong Kong Environment and
Conservation Fund (ECF Project 69/2016), and general research funding.
Additional file 1: Table S1. Specimen counts from full and core Open Access funding enabled and organized by Projekt DEAL.
datasets. Table S2. Diptera and Hymenoptera taxa and their guild
assignments. Table S3. Number and distribution of mOTUs. Table S4. Declarations
Common and rare species found in 1 – 6 habitats. Table S5. Species
turnover ANOSIM analysis with rare species removed. Table S6. Species Ethics approval and consent to participate
turnover SIMPER analysis with rare species removed. Table S7. Species Not applicable.
turnover and nestedness analysis with rare species removed. Table S8.
Number of species of vascular plants in Singapore’s habitats. Table S9. Consent for publication
Number of species from each guild, site and habitat type. Table S10. Not applicable.
Species turnover ANOSIM analysis for each ecological guild. Table S11.
Species turnover SIMPER analysis for each ecological guild. Table S12. Competing interests
Number of specimens from Singapore, Hong Kong and Brunei. Table The authors declare that they have no competing interests.
S13. Collection periods and trap localities.
Additional file 2: Figure S1. Sampling locations in the Oriental realm Author details
1
and in Singapore. Figure S2. Arthropod orders sampled in this study Center for Integrative Biodiversity Discovery, Leibniz Institute for Evolution
and their species proportions. Figure S3. Insect alpha-diversity across and Biodiversity Science, Museum für Naturkunde, Invalidenstr. 43, Berlin
tropical forest habitats. Figure S4. Breakaway and CNE species estimates 10115, Germany. 2Department of Biological Sciences, National University of
for each habitat. Figure S5. Insect alpha-diversity across tropical forest Singapore, 14 Science 8 Drive 4, Singapore 117543, Singapore. 3Lee Kong
habitats for the core dataset. Figure S6. Insect species turnover from the Chian Natural History Museum, National University of Singapore, 2
core dataset. Figure S7. Species diversity across habitats split by eco- Conservatory Drive, Singapore 117377, Singapore. 4National Biodiversity
logical guild. Figure S8. Species diversity across habitats (mangroves Centre, Royal Belgian Institute of Natural Sciences, Brussels, Belgium.
5
split) split by ecological guild. Figure S9. Species diversity and turnover International Biodiversity Conservation Division, National Parks Board, 1
from Singapore, Brunei, and Hong Kong datasets. Cluny Road, Singapore 259569, Singapore. 6School of Biological Sciences, The
University of Hong Kong, Kadoorie Biological Sciences Building, Pok Fu Lam
Road, Hong Kong, SAR, China. 7Institute for Biodiversity and Environmental
Research, Universiti Brunei Darussalam, Jalan Universiti, BE1410 Gadong,
Brunei Darussalam.
Acknowledgements
All work described here was carried out as part of a comprehensive insect Received: 19 January 2021 Accepted: 8 July 2021
survey of Singapore which was carried out in collaboration and with support
from the National Parks Board of Singapore (NParks). Special thanks go to
the team from the National Biodiversity Centre of NParks for their assistance References
in fieldwork (Permits: NP/RP12-022-4, NP/RP12-022-5, NP/RP12-022-6). We 1. Dirzo R, Young HS, Galetti M, Ceballos G, Isaac NJB, Collen B. Defaunation in
would also like to thank the research staff, lab technicians, undergraduate the Anthropocene. Science. 2014;345:401–6.
students, and interns of the Evolutionary Biology Laboratory for their help 2. Hallmann CA, Sorg M, Jongejans E, Siepel H, Hofland N, Schwan H, et al.
and assistance. This project would have been impossible without their hard More than 75 percent decline over 27 years in total flying insect biomass in
work and help from Dr. Chong Kwek Yan with regard to the plant diversity protected areas. PLoS One. 2017;12:e0185809.
data. Special thanks go to Lee Wan Ting, Yuen Huei Khee, and Arina Adom. 3. Lister BC, Garcia A. Climate-driven declines in arthropod abundance
The Hong Kong Mangroves project is supported by the Environment and restructure a rainforest food web. Proc Natl Acad Sci USA. 2018;115:E10397–
Conservation Fund (ECF Project 69/2016), and we thank Dr. Christopher 406.
Taylor, Mr. Roy Shun-Chi Leung, and Ms. Ukyoung Chang, for their help in 4. Díaz S, Settele J, Brondízio E, Ngo HT, Guèze M, Agard J, et al. Summary for
taking and sorting the samples and Dr Stefano Cannicci for his lead in the policymakers of the global assessment report on biodiversity and
mangrove project. Mangrove insects in Brunei were sampled with permission ecosystem services of the Intergovernmental Science-Policy Platform on
from the Brunei Forestry Department and Ministry of Primary Resources and Biodiversity and Ecosystem Services, vol. 45. Bonn: IPBES; 2019.
Tourism during an UBD postdoctoral fellowship awarded to Claas Damken 5. Basset Y, Lamarre GPA. Toward a world that values insects. Science. 2019;
(Research and collecting permit file numbers: UBD/CAN–387(b)(SAA); UBD/ 364:1230–1.
ADM/R3(z)Pt.; UBD/PNC2/2/RG/1(293)). We thank Dr. Roman Carrasco for 6. Cardoso P, Branco VV, Chichorro F, Fukushima CS, Macías-Hernández N. Can
commenting on the manuscript. we really predict a catastrophic worldwide decline of entomofauna and its
drivers? Glob Ecol Conserv. 2019;20:e00621.
7. Komonen A, Halme P, Kotiaho JS. Alarmist by bad design: strongly
Authors’ contributions popularized unsubstantiated claims undermine credibility of conservation
Darren Yeo: design of the work, acquisition, analysis, and interpretation of science. ReEco. 2019;4:17–9.
the data, and drafting and revising manuscript. Amrita Srivathsan: creation of 8. Sánchez-Bayo F, Wyckhuys KAG. Worldwide decline of the entomofauna: a
new software used in the work, analysis and interpretation of data, and review of its drivers. Biol Conserv. 2019;232:8–27.
revision of the manuscript. Jayanthi Puniamoorthy: design of the work, 9. Simmons BI, Balmford A, Bladon AJ, Christie AP, De Palma A, Dicks LV, et al.
acquisition of data, and revision of the manuscript. Foo Maosheng: design of Worldwide insect declines: an important message, but interpret with
the work, acquisition of the data, and revision of the manuscript. Patrick caution. Ecol Evol. 2019;9:3678–80.
Grootaert: conception and design of the work, acquisition of the data, and 10. Thomas CD, Jones TH, Hartley SE. “Insectageddon”: a call for more robust
revision of the manuscript. Lena Chan: conception and design of the work, data and rigorous analyses. Glob Change Biol. 2019;25:1891–2.
and revision of the manuscript. Benoit Guénard: conception (Hong Kong) 11. Coddington JA, Agnarsson I, Miller JA, Kuntner M, Hormiga G.
and revision of the manuscript. Claas Damken: conception (Brunei), Undersampling bias: the null hypothesis for singleton species in tropical
acquisition of the data, and revision of the manuscript. Rodzay A. Wahab: arthropod surveys. J Anim Ecol. 2009;78:573–84.
conception (Brunei) and reading of the manuscript. Ang Yuchen: 12. Stork NE. How many species of insects and other terrestrial arthropods are
identification of Diptera taxa and revision of the manuscript. Rudolf Meier: there on Earth? Annu Rev Entomol. 2018;63:31–45.
conception and design of the work, data analysis and interpretation, and 13. Basset Y, Cizek L, Cuénoud P, Didham RK, Novotny V, Ødegaard F, et al.
drafted and revised manuscript. The authors read and approved the final Arthropod distribution in a tropical rainforest: tackling a four dimensional
manuscript. puzzle. PLoS One. 2015;10:e0144110.Yeo et al. BMC Biology (2021) 19:202 Page 16 of 17
14. Kishimoto-Yamada K, Itioka T. How much have we learned about seasonality in 42. Rohde C, Silva DMIO, Oliveira GF, Monteiro LS, Montes MA, Garcia ACL.
tropical insect abundance since Wolda (1988)? Entomol Sci. 2015;18:407–19. Richness and abundance of the cardini group of Drosophila (Diptera,
15. van Klink R, Bowler DE, Gongalsky KB, Swengel AB, Gentile A, Chase JM. Drosophilidae) in the Caatinga and Atlantic Forest biomes in northeastern
Meta-analysis reveals declines in terrestrial but increases in freshwater insect Brazil. An Acad Bras Ciênc. 2014;86:1711–8.
abundances. Science. 2020;368:417–20. 43. Hazra AK, Dey MK, Mandal GP. Diversity and distribution of arthropod fauna
16. Seastedt TR, Crossley DA. The influence of arthropods on ecosystems. in relation to mangrove vegetation on a newly emerged island on the river
Bioscience. 1984;34:157–61. Hooghly, West Bengal. Rec Zool Surv India. 2005;104:99–102.
17. Perfecto I, Vandermeer J, Hanson P, Cartiân V. Arthropod biodiversity loss 44. Adeduntan SA, Olusola JA. Diversity and abundance of arthropods and tree
and the trans- formation of a tropical agro-ecosystem. Biodivers Conserv. species as influenced by different forest vegetation types in Ondo State,
1997;6:935–45. Nigeria. Int J Ecosystem. 2013;3:19–23.
18. Whiles MR, Charlton RE. The ecological significance of tallgrass prairie 45. García-Gómez A, Castaño-Meneses G, Vázquez-González MM, Palacios-
arthropods. Annu Rev Entomol. 2006;51:387–412. Vargas JG. Mesofaunal arthropod diversity in shrub mangrove litter of
19. Ewers RM, Boyle MJW, Gleave RA, Plowman NS, Benedick S, Bernard H, et al. Cozumel Island, Quintana Roo, México. Appl Soil Ecol. 2014;83:44–50.
Logging cuts the functional importance of invertebrates in tropical 46. D’Cunha P, Nair VM. Diversity and distribution of ant fauna in Hejamadi Kodi
rainforest. Nat Commun. 2015;6:6836. sandspit, Udupi district, Karnataka, India. Halteres. 2013;4:33–47.
20. Bar-On YM, Phillips R, Milo R. The biomass distribution on Earth. Proc Natl 47. Balakrishnan S, Srinivasan M, Mohanraj J. Diversity of some insect fauna in
Acad Sci USA. 2018;115:6506–11. different coastal habitats of Tamil Nadu, southeast coast of India. J Asia Pac
21. Barlow J, França F, Gardner TA, Hicks CC, Lennox GD, Berenguer E, et al. The Biodivers. 2014;7:408–14.
future of hyperdiverse tropical ecosystems. Nature. 2018;559:517–26. 48. Brook BW, Sodhi NS, Ng PKL. Catastrophic extinctions follow deforestation
22. Novotny V, Basset Y. Rare species in communities of tropical insect in Singapore. Nature. 2003;424:420–3.
herbivores: pondering the mystery of singletons. Oikos. 2000;89:564–72. 49. Corlett RT. Plant succession on degraded land in Singapore. J Trop Forest
23. Novotny V, Drozd P, Miller SE, Kulfan M, Janda M, Basset Y, et al. Why are Sci. 1991;4:151–61.
there so many species of herbivorous insects in tropical rainforests? Science. 50. Davison GWH, Cai Y, Li TJ, Lim WH. Integrated research, conservation and
2006;313:1115–8. management of Nee Soon freshwater swamp forest, Singapore: hydrology
24. Basset Y, Cizek L, Cuenoud P, Didham RK, Guilhaumon F, Missa O, et al. and biodiversity. GBS. 2018;70(Suppl1) Nee Soon:1–7.
Arthropod diversity in a tropical forest. Science. 2012;338:1481–4. 51. Yee ATK, Ang WF, Teo S, Liew SC, Tan HTW. The present extent of
25. Duke NC, Meynecke J-O, Dittmann S, Ellison AM, Anger K, Berger U, et al. A mangrove forests in Singapore. Nat Singapore. 2010;3:139–45.
world without mangroves? Science. 2007;317:41b–2b. 52. Colwell RK, Coddington J. Estimating terrestrial biodiversity through
26. Valiela I, Bowen JL, York JK. Mangrove forests: one of the world’s threatened extrapolation. Phil Trans R Soc Lond B. 1994;345:101–18.
major tropical environments. Bioscience. 2001;51:807. 53. Longino JT, Coddington J, Colwell RK. The ant fauna of a tropical rain forest:
27. Gilman EL, Ellison J, Duke NC, Field C. Threats to mangroves from climate estimating species richness three different ways. Ecology. 2002;83:689–702.
change and adaptation options: a review. Aquat Bot. 2008;89:237–50. 54. Scharff N, Coddington JA, Griswold CE, Hormiga G. Bjørn P de P. When to
28. Spencer T, Schuerch M, Nicholls RJ, Hinkel J, Lincke D, Vafeidis AT, et al. quit? estimating spider species richness in a northern european deciduous
Global coastal wetland change under sea-level rise and related stresses: the forest. J Arachnol. 2003;31:246–73.
DIVA Wetland Change Model. Glob Planetary Change. 2016;139:15–30. 55. Meier R, Wong W, Srivathsan A, Foo M. $1 DNA barcodes for reconstructing
29. Friess DA, Richards DR, Phang VXH. Mangrove forests store high densities of complex phenomes and finding rare species in specimen-rich samples.
carbon across the tropical urban landscape of Singapore. Urban Ecosyst. Cladistics. 2016;32:100–10.
2016;19:795–810. 56. Wang WY, Srivathsan A, Foo M, Yamane SK, Meier R. Sorting specimen-rich
30. Alongi DM. Mangrove forests: resilience, protection from tsunamis, and invertebrate samples with cost-effective NGS barcodes: validating a reverse
responses to global climate change. Estuarine Coastal Shelf Sci. 2008;76:1–13. workflow for specimen processing. Mol Ecol Resour. 2018;18:490–501.
31. Spalding MD, Ruffo S, Lacambra C, Meliane I, Hale LZ, Shepard CC, et al. The 57. Srivathsan A, Hartop E, Puniamoorthy J, Lee WT, Kutty SN, Kurina O, et al.
role of ecosystems in coastal protection: adapting to climate change and Rapid, large-scale species discovery in hyperdiverse taxa using 1D MinION
coastal hazards. Ocean Coastal Manage. 2014;90:50–7. sequencing. BMC Biol. 2019;17:96.
32. Zavalloni M, Groeneveld RA, van Zwieten PAM. The role of spatial 58. Yeo D, Srivathsan A, Meier R. Longer is not always better: optimizing barcode length
information in the preservation of the shrimp nursery function of for large-scale species discovery and identification. Syst Biol. 2020;69:999–1015.
mangroves: a spatially explicit bio-economic model for the assessment of 59. Meier R, Shiyang K, Vaidya G, Ng PKL. DNA barcoding and taxonomy in Diptera: a tale
land use trade-offs. J Environ Manage. 2014;143:17–25. of high intraspecific variability and low identification success. Syst Biol. 2006;55:715–28.
33. Nagelkerken I, Blaber SJM, Bouillon S, Green P, Haywood M, Kirton LG, et al. 60. Edgar RC. Search and clustering orders of magnitude faster than BLAST.
The habitat function of mangroves for terrestrial and marine fauna: a Bioinformatics. 2010;26:2460–1.
review. Aquat Bot. 2008;89:155–85. 61. Chao A, Jost L. Coverage-based rarefaction and extrapolation: standardizing
34. Yates KK, Rogers CS, Herlan JJ, Brooks GR, Smiley NA, Larson RA. Diverse samples by completeness rather than size. Ecology. 2012;93:2533–47.
coral communities in mangrove habitats suggest a novel refuge from 62. Willis A, Bunge J. Estimating diversity via frequency ratios: estimating
climate change. Biogeosciences. 2014;11:4321–37. diversity via ratios. Biom. 2015;71:1042–9.
35. Zhang K, Lin S, Ji Y, Yang C, Wang X, Yang C, et al. Plant diversity accurately 63. Ronquist F, Forshage M, Häggqvist S, Karlsson D, Hovmöller R, Bergsten J,
predicts insect diversity in two tropical landscapes. Mol Ecol. 2016;25:4407–19. et al. Completing Linnaeus’s inventory of the Swedish insect fauna: Only
36. Bagchi R, Gallery RE, Gripenberg S, Gurr SJ, Narayan L, Addis CE, et al. 5,000 species left? PLoS One. 2020;15:e0228561.
Pathogens and insect herbivores drive rainforest plant diversity and 64. Chiu C-H, Chao A. Estimating and comparing microbial diversity in the
composition. Nature. 2014;506:85–8. presence of sequencing errors. PeerJ. 2016;4:e1634.
37. Becerra JX. On the factors that promote the diversity of herbivorous insects 65. Mahé F, de Vargas C, Bass D, Czech L, Stamatakis A, Lara E, et al. Parasites
and plants in tropical forests. Proc Natl Acad Sci USA. 2015;112:6098–103. dominate hyperdiverse soil protist communities in Neotropical rainforests.
38. Moreira X, Abdala-Roberts L, Rasmann S, Castagneyrol B, Mooney KA. Plant Nat Ecol Evol. 2017;1:0091.
diversity effects on insect herbivores and their natural enemies: current thinking, 66. Gotelli NJ, Colwell RK. Estimating species richness. Biol Divers Front Meas
recent findings, and future directions. Curr Opin Insect Sci. 2016;14:1–7. Assess. 2011;12:39–54.
39. Lewinsohn TM, Novotny V, Basset Y. Insects on plants: diversity of herbivore 67. Wang Y, Naumann U, Wright ST, Warton DI. mvabund - an R package for
assemblages revisited. Annu Rev Ecol Evol Syst. 2005;36:597–620. model-based analysis of multivariate abundance data: the mvabund R
40. Batista-da-Silva JA. Effect of lunar phases, tides, and wind speed on the package. Methods Ecol Evol. 2012;3:471–4.
abundance of Diptera Calliphoridae in a mangrove swamp. Neotrop 68. Benjamin DJ, Berger JO, Johannesson M, Nosek BA, Wagenmakers E-J, Berk
Entomol. 2014;43:48–52. R, et al. Redefine statistical significance. Nat Hum Behav. 2018;2:6–10.
41. Chowdhury S. Butterflies of Sundarban Biosphere Reserve, West Bengal, 69. Ho BC, Lua HK, Ibrahim B, Yeo RSW, Athen P, Leong PKF, et al. The plant
eastern India: a preliminary survey of their taxonomic diversity, ecology and diversity in Bukit Timah Nature Reserve, Singapore. GBS. 2019;71(suppl.1):41–
their conservation. J Threat Taxa. 2014;6:6082–92. 144.You can also read