Untangling the imprints of climate, geography and land use/ cover on bird diversity in the South American Gran Chaco - IBN
←
→
Page content transcription
If your browser does not render page correctly, please read the page content below
Received: 17 April 2019   |   Revised: 26 January 2020   |   Accepted: 31 January 2020

DOI: 10.1111/jbi.13827

RE SE ARCH PAPER

Untangling the imprints of climate, geography and land use/
cover on bird diversity in the South American Gran Chaco

María Gabriela Názaro1 | Daniel A. Dos Santos2,3                                         | Ricardo Torres4,5 |
Matthias Baumann6 | Pedro G. Blendinger1,3

1
 Instituto de Ecología Regional, Universidad
Nacional de Tucumán, and Consejo Nacional          Abstract
de Investigaciones Científicas y Técnicas,         Aim: To evaluate the structure of bird communities throughout the South American
Tucumán, Argentina
2                                                  Gran Chaco determining the effects of climate, geography and land use/land cover in
 Instituto de Biodiversidad Neotropical,
Universidad Nacional de Tucumán, and               bird beta diversity, as well as to understand the beta diversity processes underlying
Consejo Nacional de Investigaciones
                                                   land use changes across broad spatial ranges.
Científicas y Técnicas, Cúpulas
Universitarias, Tucumán, Argentina                 Location: South American Gran Chaco.
                                                   Taxon: Birds.
3
 Facultad de Ciencias Naturales, Universidad
Nacional de Tucumán, Tucumán, Argentina
4
                                                   Methods: We constructed a site-by-species matrix with occurrence probabilities of
 Museo de Zoología, Facultad de Ciencias
Exactas, Físicas y Naturales, Universidad          293 bird species across 2,669 spatial units tiling completely the study area. Based on
Nacional de Córdoba, Córdoba, Argentina            this matrix, we calculated pairwise dissimilarities scores and performed a hierarchical
5
 Instituto de Diversidad y Ecología Animal,
                                                   cluster analysis for describing the spatial configuration of dissimilarities. The cluster-
Consejo Nacional de Investigaciones
Científicas y Técnicas, Universidad Nacional       ing result was spatially represented through an original venation map with bounda-
de Córdoba, Córdoba, Argentina
6
                                                   ries between sites widened in the function of their distance in the dendrogram. We
 Geography Department, Humboldt-
Universität zu Berlin, Berlin, Germany             used the Generalized Dissimilarity Modelling approach to model beta diversity, using
                                                   geographic distance, climatic and land use/land cover information as predictors. We
Correspondence
Daniel A. Dos Santos, Facultad de Ciencias         mapped beta diversity patterns using colour theory and the HSV colour model.
Naturales e IML, Universidad Nacional de           Results: We identified two main clusters of sites across the Gran Chaco, which repre-
Tucumán, Miguel Lillo 205, 4000 Tucumán,
Argentina.                                         sent environmentally different sites and harbour very distinct assemblages of species.
Email: dadossantos@csnat.unt.edu.ar                These main groups are separated by two natural delimiters: The Bermejo-Pilcomayo
Funding information                                interfluvium and the Lower Paraná floodplain. Overall, we observed that the percent-
Consejo Nacional de Investigaciones                age of cropland and climatic variables were important shapers of bird beta diversity.
Científicas y Técnicas
                                                   Main conclusions: We provide the first area-wide assessment of land use/land cover
Handling Editor: Camila Ribas                      effects on bird beta diversity for the Gran Chaco. The distribution of croplands has a
                                                   marked influence on bird beta diversity at regional scale highlighting the role of anthropic
                                                   changes in reshaping bird beta diversity within the ecoregion. Taking into account the
                                                   global increasing conversion of forests into croplands, a growing footprint of land use
                                                   changes over geographical patterns of bird diversity in forest biomes can be anticipated.

                                                   KEYWORDS

                                                   beta diversity, bird communities, dry forest, endangered ecosystems, GDM, land use, species
                                                   distribution

Journal of Biogeography. 2020;00:1–16.                          wileyonlinelibrary.com/journal/jbi © 2020 John Wiley & Sons Ltd             |    1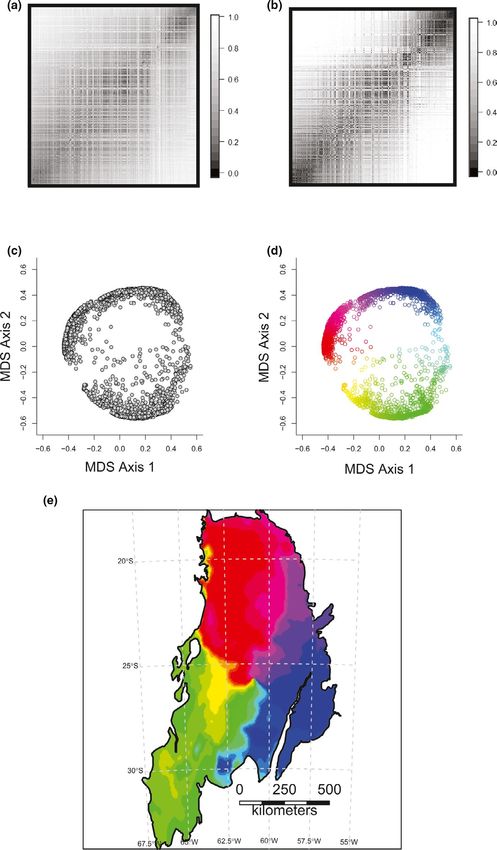
2 | NÁZARO et al.
1 | I NTRO D U C TI O N ecosystems that would result in new combinations of bird species
and modified relative abundances that differ significantly from other
Land use change is one of the most relevant processes that drive ecosystems in the same region (Morse et al., 2014).
the dynamics of biological diversity (Dormann et al., 2007; Peters The South American Gran Chaco is characterized by a rich
et al., 2019). Human activities often generate completely novel land- birdlife but with a few endemics. It is compositionally influenced by
scapes, with unpredictable changes to alpha-, beta- and gamma-di- surrounding biomes with which it has controversial biogeographic
versity (Socolar, Gilroy, Kunin, & Edwards, 2016). Therefore, giving relations (Porzecanski & Cracraft, 2005; Prieto-Torres, Rojas-Soto,
that detailed gamma diversity studies at regional scales are difficult Santiago-Alarcon, Bonaccorso, & Navarro-Sigüenza, 2019; Short,
to achieve, Socolar et al. (2016) argued for the need to understand 1975; Straube & Di Giacomo, 2007). Despite the numerous surveys
the processes underlying beta diversity patterns and its behaviour about deforestation/fragmentation and studies on priority conser-
under scenarios of land use change. From this perspective, beta di- vation areas in the Chaco dry forest (e.g. Andrade-Díaz, Sarquis,
versity represents a key concept for understanding ecosystem func- Loiselle, Giraudo, & Díaz-Gómez, 2019; Nori et al., 2016), few stud-
tioning and management, complementing the alpha-scale researches ies have assessed the diversity patterns and relationships among the
and leading to management practices aligned to broad scope for entire avifauna across the whole region. Most of the information
biodiversity conservation (Legendre, Borcard, & Peres-Neto, 2005; collected in Chaco avifaunal studies comes from a small number of
Socolar et al., 2016). areas, so it is risky to formulate generalizations on biota dynamics
The main drivers behind beta diversity differ through spatial because of the lack of replication (Straube & Di Giacomo, 2007).
scales (e.g. Gaston et al., 2007; Melo, Rangel, & Diniz-Filho, 2009), Therefore, many questions have yet to be answered regarding the
and their effects may vary according to taxonomic groups (Socolar macroecological spatio-temporal patterns of the Chaco avifauna
et al., 2016). For instance, plants and spiders show opposite trends (Herzog y Kessler, 2002; Nores, 1992).
(increasing and decreasing beta diversity respectively) across con- This paper aims to study the bird community structure and com-
ventional and organic croplands in Europe, while deforestation has position across the South American Gran Chaco and to untangle the
different effects on the soil bacterial beta diversity either reduc- role of different environmental and land use/land cover variables
ing or increasing it in the Brazilian Amazon or Borneo respectively on the bird beta diversity. To achieve these goals, we firstly anal-
(Socolar et al., 2016). At the regional scale, climate and habitat het- ysed the spatial configuration of bird species richness and secondly
erogeneity seem to be the main determinants of bird beta diversity mapped the hierarchical clustering of sites guided by their avifauna
(Corbelli et al., 2015; Keil et al., 2012; Veech & Crsit, 2007). More ef- dissimilarities. These analyses are on the path to achieve a better
fort is necessary to understand the role of environmental and biotic understanding of the spatial structure of the Chacoan bird diversity.
factors on beta diversity across broad spatial ranges (Antão, McGill, They are necessary to interpret better the beta diversity patterns to
Magurran, Soares, & Dornelas, 2019). be explored subsequently. Finally, we used Generalized Dissimilarity
Although knowledge about the effects of land use change on Modelling (GDM) to analyse the bird beta diversity in the South
species richness has increased considerably in recent years (Koivula American Gran Chaco and to recognize both the unique and shared
et al., 2017; MacGregor-Fors & Schondube, 2011; Rittenhouse contributions of predictors (climate, geography and land use/land
et al., 2012), its effect on beta diversity has been little explored cover information) in explaining the data.
(Barnagaud et al., 2017; Corbelli et al., 2015; Jeliazkov et al., 2016).
This asymmetry is still more marked in less-studied regions such as
the South American dry forests. These forests have experienced an 2 | M ATE R I A L S A N D M E TH O DS
increasing rate of deforestation, especially in the Brazilian Cerrado,
the Chiquitano Forests in Bolivia and the Gran Chaco in Bolivia, 2.1 | Study area
Paraguay and Argentina (Baumann et al., 2017). In the last 30 years,
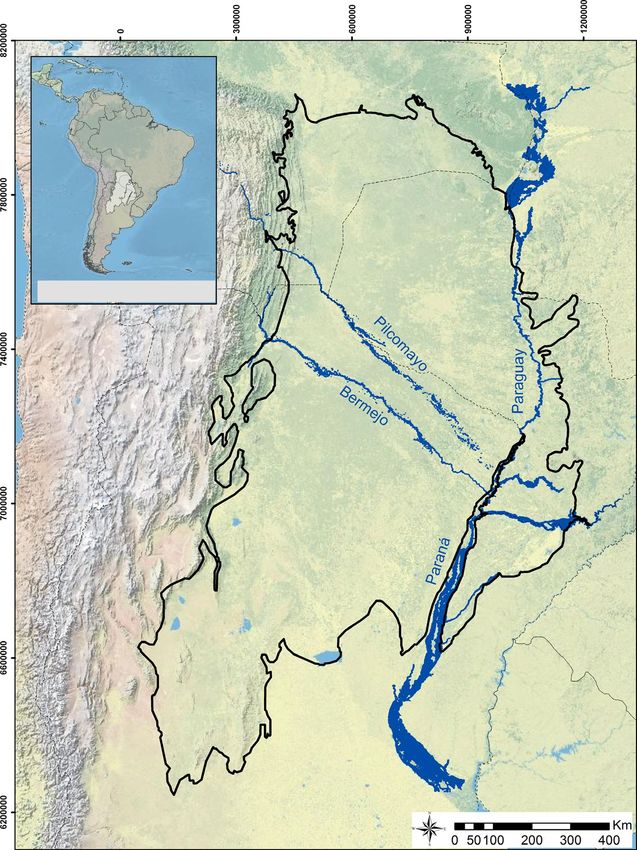
the Gran Chaco has become a hotspot of agricultural expansion and The South American Gran Chaco (Figure 1) is a vast tropical and sub-
intensification, as cattle ranching and agriculture have expanded at tropical dry forest region that occupies 1.1 million km2 over part of
the expense of forests (Baumann et al., 2017). The Gran Chaco's bird Bolivia, Argentina, Paraguay and a small portion of Brazil, compris-
richness is particularly sensitive to land use changes, declining in a ing the Dry Chaco and the Wet Chaco sub-ecoregions (Olson et al.,
gradient from natural habitats to implanted pastures and croplands 2001). Its terrain is mainly flat, except for the west and southwest,
(Macchi, Grau, Zelaya, & Marinaro, 2013). Additionally, bird assem- where low elevation mountain ranges run. The climate is semi-arid
blages in natural grasslands show low similarity when compared with and highly seasonal, with a distinct dry season in autumn and win-
those from implanted pastures (Macchi et al., 2013). Thus, while open ter (May–September), and a warm, wet season in spring and summer
habitats would be important for biodiversity in the landscape config- (November–April). The rainfall gradient decreases westwards from
uration of the Gran Chaco, the novel open habitats created by cat- 1,200 mm in the Wet Chaco to 450 mm in the Dry Chaco (Bucher,
tle ranching and agriculture lead to local species extinction (Torres, 1982). The mean annual temperature is around 22°C, with an average
Gasparri, Blendinger, & Grau, 2014) and high unpaid extinction debt monthly maximum of 28°C. The vegetation is a mosaic of dry forests,
(Semper-Pascual et al., 2018). Land use changes are creating novel open woodlands, scrublands, savannas and grasslands (Bucher, 1982;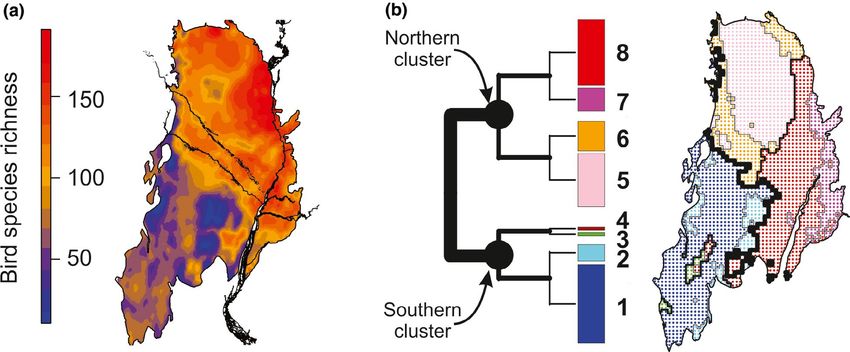
NÁZARO et al.                                                                                                                                      |   3

F I G U R E 1 Study area: The South
American Gran Chaco with its main
watercourses

Clark, Aide, Grau, & Riner, 2010). The large extent of the area in ad-       to other biogeographical areas (Porzecanski & Cracraft, 2005). Besides,
dition to the wide variety of environments favour a high diversity of        numerous wetlands distributed mainly to the east of the Gran Chaco
animal and plant species, and therefore, make Chaco a key area for           provide suitable habitats for aquatic birds. Large marsh ecosystems are
biodiversity conservation (The Nature Conservancy, Fundación Vida            major breeding sites for resident species and receive huge numbers of
Silvestre Argentina, Fundación DesDel Chaco, & Wildlife Conservation         non-breeding migrants (Stotz et al., 1996).
Society, 2005).                                                                 Historically, much of the region has been severely degraded by ex-
   Short (1975) listed more than 400 breeding bird species in the re-        tensive cattle ranching and subsistence agriculture in addition to tim-
gion, most of them restricted to South America. However, the number of       ber and charcoal extraction (Clark et al., 2010). Still, the conversion of
truly endemic species is low (Stotz, Fitzpatrick, Parker III, & Moskovits,   forests to agriculture has experienced increasing rates over the past
1996). Many bird species occurring in the Gran Chaco are widespread          30 years. In that period, more than 142,000 km2 of the Chaco's for-
and range far beyond its limits (Short, 1975). Chacoan bird species rich-    ests, equalling 20% of all forest, was replaced by croplands (38.9%) or
ness decreases from north to south (Rabinovich & Rapoport, 1975).            grazing lands (61.1%). The relative forest loss was higher in the wet
Surrounding regions like the Andes to the west, the Atlantic Forest to       Chaco (19.8%) than the dry Chaco (18.2%; Baumann, Piquer-Rodríguez,
the northeast and the Pampas and Patagonia to the south would influ-         Fehlenberg, Gavier Pizarro, & Kuemmerle, 2016). Forests have been
ence it (Straube & Di Giacomo, 2007). A comparative historical analysis      replaced mainly by croplands in Argentina; meanwhile, deforestation
of robust phylogenies predicted that Chacoan bird species would be           followed by pastures has especially taken place in Paraguay. In turn,
more closely related to the Cerrado than to Caatinga species, and less       the Bolivian Chaco was the less modified area (Baumann et al., 2017).
4   |                                                                                                                              NÁZARO et al.

2.2 | Species distributions                                               a site-by-species matrix R = [rij ] in which each entry rij denotes the
                                                                          probability of occurrence of species j into site i.
2.2.1 | Habitat suitability models

We performed habitat suitability models in MaxEnt v3.3.1 using            2.3 | Analysis of distributional matrix
species presence data from all the Gran Chaco region along with
nine environmental variables: annual mean temperature, annual             Each row of the site-by-species matrix represents the structure of
precipitation, distance to water bodies, slope and five land use/         bird assemblage for a given site. Technically, it corresponds to a mul-
land cover classes (henceforth called LULC, concerning with per-          tivariate binary response. So, summation over all the entries of a row
centages of forest, natural grassland, cropland, pasture and others,      (i.e. probability scores) retrieves the mathematical expectation or
the latter mainly being associated with water bodies and human            average number of species for the respective site.
buildings). Data sources are in Appendix 1 while the complete list           We calculated dissimilarities between sites using the comple-
of presence records by species is available in Appendix S1. To mini-      ment of the Positive Matching Index (i.e. 1 - PMI, Dos Santos &
mize the complexity of models, we used only linear and quadratic          Deutsch, 2010). We calculated three parameters (a, b and c) from
features, and we determined the optimal value for the regulari-           the matrix R of occurrence probabilities for species across sites.
zation coefficient (β) for each species (Cobos, Peterson, Barve, &        The parameter a represents the number of common species be-
Osorio-Olvera, 2019). For each species, we recovered the pre-             tween sites under comparison; b and c count the species recorded
dicted map of presence from the constructed model (binary out-            for one of the two sites. As each row of R can be likened to a mul-
put). The choice of species, variables and the modelling process is       tivariate binary variable, the average count of items under random
fully described in Appendix S2. We recognize that models trained          sampling from such variable is obtained as the sum of all prob-
with presence data collected only from the Gran Chaco region may          ability scores involved (i.e. summation over all entries of a row).
have lower performance than models trained with presence data             Therefore, the required triad of parameters are embodied in their
of the full species’ ranges (Carretero & Sillero, 2016; Raes, 2012).      respective symmetric matrices A = [a ij ], B = [bij ] and C = [cij ] of
However, as our goal was to analyse the effect of both environ-           inter-site comparison. They can be calculated as follows: A = R.RT,
mental and land use variables on bird beta diversity, and given that      B = R.(1 − R)T and C = (1 − R).RT. The calculated matrix of compo-
the land use layers we used were developed specifically for the           sitional dissimilarities between sites is the input for (a) clustering
Gran Chaco, we narrowed our calibration area to that region. In           and (b) beta diversity modelling.
any case, after selection of the species that met all the reliabil-          Using this dissimilarity matrix, we perform hierarchical clus-
ity requirements for further use (Appendix S2), one of the authors        tering (Becker & Chambers & Wilks, 1988). This technique allows
(PGB) made a final selection evaluating the fit of the modelled           us to explore data and look for discontinuities and clear cut seg-
distributions with current knowledge on species’ distributions            regation of ecological units. Robust clusters consist of a set of
according to his extensive experience in the field and specific lit-      sites characterized by high within-group and low between-group
erature (e.g. del Hoyo, Elliot, Sargatal, Christie, & Kirwan, 2019;       similarity. It portrays valuable cues to interpret results coming
Herzog et al., 2016).                                                     from beta diversity modelling. For each meaningful cluster, a list
                                                                          of supporting species is provided. Species are considered as diag-
                                                                          nosing elements of a cluster whenever their distributions overlap
2.2.2 | Site-by-species matrix                                            significantly with the set of spatial units comprising such cluster.
                                                                          Statistical significance is assessed by calculating the probability
The presence/absence maps obtained from the habitat suitability           of set intersection (Kalinka, 2013). A low probability score (set
models were rasters in a 3 × 3 km resolution. To facilitate subse-        here at 0.01) means that the overlap size is large enough to be
quent calculations, we transformed the original maps to another of        expected by random chance. Empirically, statistical significance
coarser resolution (i.e. units of 21 × 21 km resolution after grouping    occurs when the similarity between clusters and species spatial
7 × 7 cells). These larger spatial units are called hereafter as sites.   distributions, measured through the above-mentioned PMI index,
Previously, we had verified that clustering obtained with this coarse     is larger than 0.6.
resolution did not differ from clustering performed at finer resolu-         The identification and posterior mapping of clustering configura-
tions in terms of the optimal number of clusters as well as spatial       tion help to recognize the spatial nature of dissimilarity data. Here,
range of larger and subordinated clusters in their hierarchical as-       we also introduce an innovative way to map the salient features of
sortment. After grouping pixels into sites, the single binary maps        the clustering obtained. We just focus on the very first three in-
resulted in maps with continuous values ranging from 0 (complete          stances of dichotomy across the dendrogram ending up with eight
absence) to 1 (full presence) accounting for the occurrence degree        clusters. The intercluster boundary or, technically speaking, the
of species in sites. For each site i, these values can be interpreted     geometrical bisector between two sites from different clusters, is
as the occurrence probability of a given species within such site i.      represented in the map through concatenated segments where the
Mathematically, the resulting distribution map can be encoded into        line width depends on the level at which the dendrogram is cut for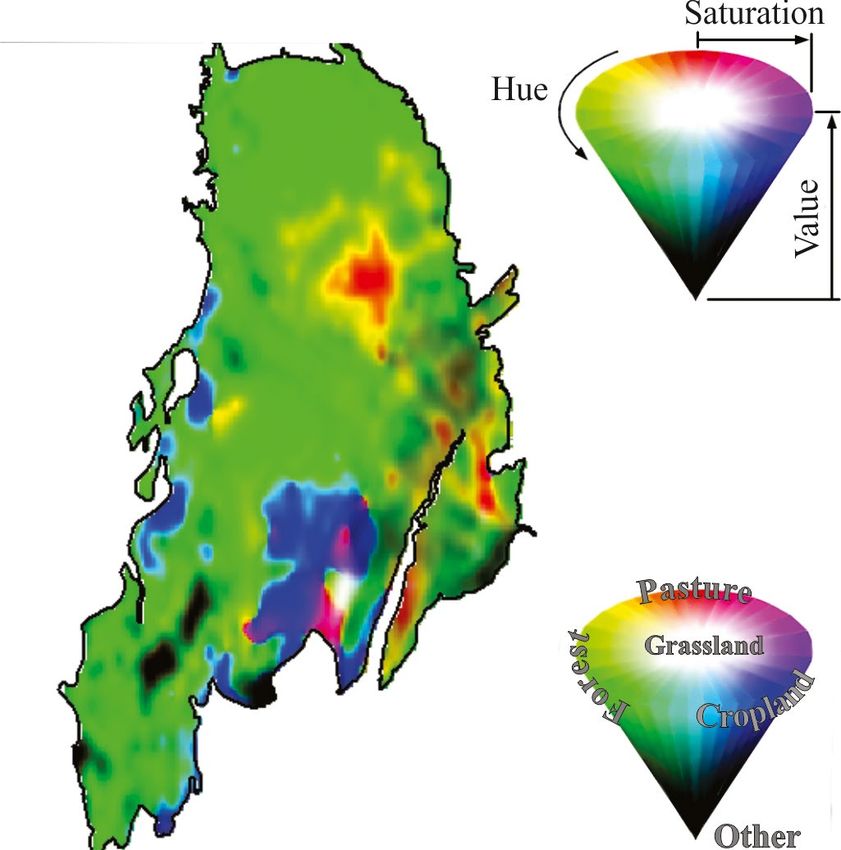
NÁZARO et al.                                                                                                                                   |   5

obtaining clusters. Thus, line width between sites segregated into          Appendix S2). We included the geographic distance between pairs
distinct clusters after the first bipartition of the dendrogram is much     of sites as a predictor variable to correct the effect of spatial auto-
wider than that of sites separated from each other at a lower dis-          correlation. We used Annual mean temperature and Annual precip-
similarity level. The final output allows the reader to recognize the       itation variables (Hijmans, Cameron, Parra, Jones, & Jarvis, 2005) to
spatial domain of clusters. Due to its similarities with the hierarchical   assess climatic effects.
leaf vein system of angiosperms (where the veins of higher branch-
ing orders have smaller diameters; Sack & Scoffoni, 2013), we named
this map as the dissimilarity venation map. We performed all these          2.5.2 | Unique and shared effects of predictors
procedures with the R statistical software (R Core Team, 2018).
                                                                            We deal with three sets of predictors, namely the climatic, geograph-
                                                                            ical and LULC variables. Shared and unique contributions in percent-
2.4 | LULC data analysis and mapping                                        ages in explaining the deviance of the null model were inferred by
                                                                            computing the explained deviance of all the possible models. We
We performed a compositional data analysis over the LULC pro-               start the calculation with all available predictor variables, deleting
files of sites. Details are provided in Appendix S3. The LULC layers        one class of variables at a time until we arrive at models based on
represent compositional data since scores for each LULC class are           single predictors. Then, with the aid of overlapping set equations
proportions of the total coverage and are therefore interdependent          based on 3-set Venn diagram operations, the different contributions
(Aitchison, 1982). We explored this data through principal compo-           were recognized. Percentages were graphically depicted through a
nent analysis adjusted to compositions (Aitchison PCA) since this           sectored circle of total radius proportional to the total amount of
technique accounts for the covariations among parts. We obtained            information to be explained (i.e. deviance of null model). The outer
a compositional biplot to see these covariations through the R pack-        ring would correspond to the unknown component, the middle ring
age robCompositions (Templ, Hron & Filzmoser, 2011). We generated           is sectored like a pie chart and accounts for the unique and 2-set
an LULC map to assess visually the relative contribution of LULC cat-       shared contributions, and finally, the inner circle is proportional to
egories, using for that purpose the HSV (hue, saturation and value)         the 3-set overlap.
colour model. See Appendix S3 for additional details about the cal-
culation process. This step is critical for a better understanding of
the spatial nature of LULC variable.                                        2.5.3 | Beta diversity map

                                                                            To graphically represent dissimilarities between pairs of sites we used
2.5 | Analysis of beta diversity                                            the multidimensional scaling applied on the reweighted matrix of dis-
                                                                            similarities (Dos Santos, Cuezzo, Reynaga, & Domínguez, 2011) as
2.5.1 | Generalized dissimilarity modelling                                 implemented by the function reweight in the R package SyNet (Dos
                                                                            Santos, 2011). This procedure promotes a two-dimensional represen-
We used GDM analysis (Ferrier, Manion, Elith, & Richardson,                 tation of data points that resembles a circle. The structure of the dis-
2007) to reveal patterns of beta diversity and to predict the com-          similarity matrix can thus be represented with data points arranged
positional dissimilarity between sites across the Gran Chaco. This          in the perimeter of a closed two-dimensional shape, ideally a circum-
approach allows to estimate the magnitude and rate of species               ference, and can be tied to angular positions and then assigned with
turnover along environmental/geographical gradients, by consid-             colours accordingly. In colour theory, the hue is the characteristic or
ering the dissimilarity between pairs of sites as a function of their       appearance parameter that defines the pure tone and is represented
environmental difference and geographical distance (Fitzpatrick             by angular positions around a central point. Consequently, the colour-
et al., 2013). We use the R package gdm (Manion et al., 2017), se-          ing of data points proceeds by matching their angular positions with
lecting the default option of three I-spline basis functions per pre-       those of hues in the colour wheel.
dictor. The I-spline functions describe the relationship between
beta diversity and the gradient and hold information about the
contribution of each input variable (Ferrier et al., 2007). We tested       3 | R E S U LT S
overall model significance by using Monte Carlo permutations on
the input matrix of predictors followed by calculation of the ex-           3.1 | Analysis of distributions
plained deviance.
   To evaluate the importance of LULC classes in influencing beta           We obtained a distributional matrix of 2,669 sites × 293 bird spe-
diversity, we fitted separate I-splines for each of them. The LULC          cies from habitat suitability models (available in Appendix S4). A
predictors were the respective percentages of Forest, Natural grass-        minor percentage of the modelled species (i.e. 10%) showed ranges
land, Cropland, Pasture and Other features (wetlands and human              spanning >60% of the region, while a huge number of species (i.e.
buildings), as in Baumann et al. (2017) with modifications (see             80%) occupied less than half of the region. Expected richness was
6 | NÁZARO et al.
F I G U R E 2 (a) Expected bird richness. The main rivers of the Paraná drainage network have been projected onto the map. (b) Dissimilarity
venation map. To the left, hierarchical grouping of sites based on their dissimilarities. The cluster configuration is shown up to the third divisive
level of the respective dendrogram. Size of rectangles at the tips proportional to the area of the cluster. To the right, spatial expression of
clusters already identified. The boundaries are widened depending on the dissimilarity between clusters to which adjacent sites belong to
not homogeneously distributed, with maximum values (c. 192 spe- main nucleus of pastures at the Northern cluster of sites in Paraguay
cies) in the northeast of the region and decreasing to the southwest (Figure 3). At the Southern cluster, croplands developed at two
(Figure 2a). The decline in richness was particularly marked to the separate bands separated by forested sites. Thus, productive areas
south of the Pilcomayo-Bermejo interfluvium, dropping until ten were more patchily distributed to the south than to the north of
species in certain areas. Interestingly, these poorest sites were ag- Gran Chaco. Croplands and Pastures were intermingled with natural
gregated into spatially disjoint sets. grasslands to the south and east of Chaco (Figure 3).
The hierarchical clustering of sites resulted in two main clus-
ters on both sides of rivers Bermejo and Lower Paraná (hereafter
Northern and Southern clusters; Figure 2b). Figure 2b also shows 3.3 | Analysis of beta diversity
through the dissimilarity venation map the assortment of sites within
subsequent clusters. The Northern cluster occupied the largest part The model fitted the data significantly and explained 79.87% of the
of the region, approximately two-thirds of it, while the Southern deviance (Table 2, Figure 4a). The shape of the fitted I-splines for
cluster occupied only one-third (Table 1). Contiguity in space is variables associated with beta diversity was nonlinear, suggesting
more common for the sub-clusters found at the Northern portion a complex behaviour for the compositional turnover rate along the
than those of the Southern counterpart, which is patchier in this re- gradient (Figure 4b–e). Most predictors reached a plateau after a
gard. On average, species richness in the Northern cluster is twice given threshold, although a few variables (notably %Cropland) be-
as much as in the Southern cluster, and it represents 40% of the total haved non-asymptotically.
number of species under consideration (Table 1). Taking into account the magnitude of effects (maximum height
achieved by I-splines), %Cropland, Annual precipitation and Annual
mean temperature were the dominant variables (Table 2). Climatic
3.2 | LULC data analysis variables are geographically structured, so they share a large per-
centage in explaining the model deviance, but they remain little
The first two components of the covariance biplot explained 76% of associated with LULC variables (Table 2, Figure 4f). The upper con-
the variance in the data (Figure S3 1). Forest exhibited a higher varia- cavity of the %Cropland curve means that the turnover came slowly
tion relative to all LULC classes across data points. The link between in sites with scarce crops, but increased as the percentage of crops
the tips of the rays of Cropland and Forest passes through the tip increased. Contrarily, the lower concavity of Annual precipitation
of the ray of Pasture. This indicates that these three categories are and Annual mean temperature means that compositional dissimi-
linearly related. In this case, when Forest increases, the other two larity increased quickly at relatively lower values of both variables,
will decrease. Additional details about the interpretation of biplot but more slowly beyond 1,000 mm and 24°C respectively.
are provided in Appendix S3. We compressed the information about compositional dissimilar-
As a whole, Forest expanded over 56% of the region, Pasture ities into a 2D spatial representation of data (Figure 5). The resulting
and Cropland over 25%, Others occupied around 15% and Natural map of beta diversity is displayed in Figure 5e. Chromatic contrasts
grasslands were less represented. Forested sites surrounded the observed in the map parallel those already observed in Figure 2bTA B L E 1 Main characteristics of clusters defined through Figure 2b. Numbering of elemental clusters identical to those of such figure. The overall area covers 1,078,101 km2. For a given
set of elemental clusters, represents the average species richness to be recorded in there, and | S >50% | indicates the total number of species that have more than half of their expected
distributions embedded within the respective cluster. Species are included in the list of supporting or diagnosing entities whenever the overlap between their spatial ranges and the area of
clusters are large enough to yield a significant similarity measure, namely a PMI score over 0.6
NÁZARO et al.
Lower level of clustering
Clustering {1} {2} {3} {4} {5} {6} {7} {8}
% Area 28.62% 6.07% 1.12% 1.12% 19.60% 10.94% 8.47% 24.05%
< S> 65 27 48 65 122 114 130 115
| S >50% | 49 0 0 0 18 2 12 56
Diagnosing Cyanoliseus patagonus, Crypturellus undulatus, Alectrurus risora, Anthus nattereri, Dendrocygna viduata,
species Hirundinea ferruginea, Micrastur semitorquatus, Dacnis cayana, Elaenia flavogaster, Platalea ajaja, Plegadis
Leptasthenura platensis, Nothura boraquira, Forpus xanthopterygius, Gubernetes chihi
Pseudoseisura lophotes, Synallaxis albilora yetapa, Pseudoleistes guirahuro,
Rhynchospiza strigiceps, Sappho Sporophila bouvreuil, Sporophila
sparganurus, Spiziapteryx leucoptera, Turdus leucomelas
circumcincta
Intermediate level of clustering
Clustering {1, 2} {3, 4} {5, 6} {7, 8}
% Area 34.69% 2.25% 30.54% 32.52%
< S> 58 57 119 119
| S >50% | 50 0 75 108
Diagnosing Nothura darwinii, Amazona aestiva, Campephilus melanoleucos, Agelasticus cyanopus, Amazonetta brasiliensis,
species Serpophaga Campylorhamphus trochilirostris, Cantorchilus Amblyramphus holosericeus, Anthus lutescens, Anumbius
munda, Turdus guarayanus, Chaetura meridionalis, Claravis annumbi, Aramides ypecaha, Aramus guarauna, Arremon
chiguanco pretiosa, Coccyzus americanus, Columbina flavirostris, Arundinicola leucocephala, Basileuterus
squammata, Crypturellus parvirostris, culicivorus, Butorides striata, Cacicus haemorrhous, Calidris
Falco rufigularis, Formicivora melanogaster, melanotos, Certhiaxis cinnamomeus, Ciconia maguari, Circus
Geranospiza caerulescens, Herpetotheres buffoni, Colaptes campestroides, Conirostrum speciosum,
cachinnans, Icterus croconotus, Ictinia Dendrocolaptes platyrostris, Donacobius atricapilla,
plumbea, Inezia inornata, Myiothlypis Emberizoides herbicola, Emberizoides ypiranganus,
flaveola, Myrmorchilus strigilatus, Patagioenas Gallinago paraguaiae, Hirundo rustica, Ixobrychus exilis,
cayennensis, Phacellodomus rufifrons, Megarynchus pitangua, Myiarchus ferox, Nothura maculosa,
Phaeomyias murina, Primolius auricollis, Pachyramphus validus, Paroaria capitata, Phacellodomus
Sarcoramphus papa, Sarkidiornis melanotos, ruber, Phalacrocorax brasilianus, Phimosus infuscatus,
Sporophila lineola, Thamnophilus sticturus Porphyrio martinicus, Porzana albicollis, Progne chalybea,
Pseudocolopteryx flaviventris, Pseudocolopteryx sclateri,
Rhynchotus rufescens, Rostrhamus sociabilis, Satrapa
icterophrys, Sporophila collaris, Sporophila hypoxantha,
Sporophila ruficollis, Sturnella superciliaris, Tachycineta
leucorrhoa, Thlypopsis sordida, Trogon surrucura, Veniliornis
passerinus, Xolmis cinereus
|
7
(Continues)8 | NÁZARO et al.
and match natural dividers such as the Bermejo-Pilcomayo inter-
fluvium and Lower Paraná influence area. The distinction between
dominicus, Tachyphonus rufus, Tapera naevia, Thamnophilus doliatus, Theristicus caerulescens, Thraupis
Icterus pyrrhopterus, Jabiru mycteria, Jacana jacana, Machetornis rixosa, Melanerpes candidus, Milvago
Anhinga anhinga, Aratinga nenday, Ardea cocoi, Bartramia longicauda, Busarellus nigricollis, Buteogallus
Campylorhynchus turdinus, Casiornis rufus, Cathartes burrovianus, Celeus lugubris, Charadrius collaris,
Rynchops niger, Saltator similis, Schoeniophylax phryganophilus, Stelgidopteryx ruficollis, Tachybaptus
Dryocopus lineatus, Elaenia spectabilis, Fluvicola albiventer, Gnorimopsar chopi, Hylocharis chrysura,
Psittacara leucophthalmus, Pyrocephalus rubinus, Ramphastos toco, Rhea americana, Riparia riparia,
the Northern and Southern clusters of sites is clearly detectable in
chimachima, Mycteria americana, Myiarchus tyrannulus, Nyctibius griseus, Nyctidromus albicollis,
Pachyramphus viridis, Paroaria coronata, Piaya cayana, Piculus chrysochloros, Pionus maximiliani,
Chauna torquata, Chordeiles nacunda, Chrysomus ruficapillus, Cnemotriccus fuscatus, Columbina
the 2D scatter after multidimensional scaling (Figure 5d) and is also
meridionalis, Buteogallus urubitinga, Cacicus chrysopterus, Cacicus solitarius, Cairina moschata,
talpacoti, Crotophaga ani, Crotophaga major, Dendrocygna autumnalis, Dolichonyx oryzivorus,
easily perceived on the map. The Northern portion is longitudinally
sayaca, Tigrisoma lineatum, Tolmomyias sulphurescens, Tringa solitaria, Volatinia jacarina
striped, whereas the Southern counterpart shows a more convo-
luted aspect for the sites identically coloured (and so, more similar
between them in bird composition).
4 | D I S CU S S I O N
In this paper, we provide the first area-wide assessment of LULC ef-
fects on the beta diversity of birds for the whole Gran Chaco. The
area is currently under several anthropization processes (Baumann
et al., 2017), and we show that cropland is the major LULC class in ex-
plaining the beta diversity patterns at the regional scale. We also ana-
lysed the structure of bird communities and their spatial patterns of
diversity inside the Gran Chaco. We show that the distribution of bird
richness is higher, and bird communities are compositionally more dif-
ferent in the northern than in the southern part of the Gran Chaco.
These sub-regions are mainly defined by latitude rather than the tra-
ditional longitudinal subdivision of the Gran Chaco largely based on
precipitation gradient and floristic composition: western Dry Chaco
versus eastern Wet Chaco (Bucher, 1982). LULC exhibited a great im-
{5, 6, 7, 8}
pact on the spatial distribution of the avifauna with a unique effect as
63.06%
relevant as the combined effects of geographic distance and climate.
119
241
When considering all variables individually, croplands outweigh the
remaining ones. Thus, anthropogenic landscape changes can be re-
Knipolegus aterrimus, Sturnella loyca
shaping bird beta diversity within the Gran Chaco. This is especially
important for management policies since tropical and subtropical dry
Higher level of clustering
areas are experiencing an accelerated rate of land use change.
4.1 | The two faces of the Chacoan avifauna
{1, 2, 3, 4}
36.94%
This is the first study that explores the patterns of bird diversity on a
58
52
regional scale for the South American Gran Chaco in the last 40 years,
and the first that attempts to understand how different environmen-
tal variables (natural and anthropogenic) may influence them. Almost
50% of the Chaco avifauna was reported by Short (1975) as widely
distributed across the region. Our results, in contrast, showed that
most Chacoan bird species have an intermediate to narrow rather
than wide range size within the Gran Chaco and that almost 80% of
the species occupy a total area less than half of the entire region. To a
large extent, these differences are explained by the greater precision
(Continued)
of distribution maps obtained with niche modelling compared with
the information available four decades ago.
Diagnosing species
As reported for many taxa in the Neotropics (e.g. Hawkins,
Diniz-Filho, Jaramillo, & Soeller, 2006; Rull, 2011), we found herein
Clustering
TA B L E 1
a negative relationship between the latitude and richness. The
| S >50% |
% Area
Chacoan avifauna is firstly divided into two large dissimilar clusters
< S>
of communities at both sides of a divider running along the directionNÁZARO et al. | 9
distributional limits. Many widespread Neotropical birds that enter
the Gran Chaco from the north reach their southern distributional
limits in this interfluvium (Nores, 1992; Short, 1975). Similarly, sev-
eral species that enter the region from the south reach the northern
limit of their distribution near this area. Also, tropical and subtropical
climates (as determined by the Tropic of Capricorn) narrowly fit the
distribution of the Northern and Southern clusters respectively.
Interestingly, the northern sub-region is supported by many
species mainly associated with humid environments ranging from
large water bodies to swamps and marshes in forests, in addi-
tion to forest species associated with wet forests (Table 1). Short
(1975) had already stated that wetland-associated species were
mainly distributed to the northeast of the region. Although most
of these species are not exclusive from the northern sub-regions,
their occurrence is higher there, owing to the greater availability
of wetlands and wet forests. In turn, the northern sub-region is
divided longitudinally into two well-defined areas, one to the west
characterized mainly by forest birds, and one to the east long char-
acterized by bird species that inhabit wetlands and flood grass-
FIGURE 3 Synthetic LULC map. By using the HSV colour model, lands (Table1). There are no current geographical barriers that
percentages of the five LULC classes are translated into a single support this subdivision, but rather it reflects a climatic gradient of
colour. The sub-composition of Pasture-Forest-Cropland defines decreasing precipitation from east to west and the replacement of
the hue, whereas 100 – % Natural grassland and 100 – % Others predominant habitat types from more humid to drier ones. Species
corresponds to saturation and value/brightness respectively. Thus,
supporting the southern sub-regions are mainly associated with
reddish areas are dominated by Pasture, bluish by Cropland, greenish
mountainous and arid environments, including scrublands, xero-
by Forest, whitish by Natural grassland and blackish by Others
morphic forests and grasslands, all predominant environments in
southern South America. These results reinforce the idea of the
TA B L E 2 Summary of the GDM (Generalized Dissimilarity strong imprint of the climate on species distribution over which
Model) for the Gran Chaco. For each variable, the scores for the the effects of land use change described below are superimposed.
magnitude of effects (measured by summing the coefficients of the
Hence, the spatial correlate of our clustering result leads to a
I-splines from GDM) are reported. The total explained deviance was
non-trivial discussion: splitting out of the Gran Chaco guided by
obtained by subtracting the null deviance from the model deviance
its avifauna does not match the traditional bipartition into Dry and
Variables Importance Wet Chaco sub-ecoregions. This last classification is largely based
Geographical distance (km) 0.25 (6.35%) on the climatic gradient and floristic composition (Bucher, 1982;
Annual precipitation 0.79 (20.05%) Olson et al., 2001), and divides the Gran Chaco longitudinally. The
Annual mean temperature 0.83 (21.07%) answer to the previous question is only partially affirmative be-
% Pasture 0.04 (1.02%) cause the northern sub-region includes all the Wet Chaco but also
expands latitudinally to the north of Bermejo over the Dry Chaco.
% Forest 0.18 (4.57%)
Most species with restricted distributions within the Gran
% Cropland 1.31 (33.25%)
Chaco inhabit in the north and east, contributing to the greatest
% Natural grassland 0.02 (0.51%)
species richness in the northern communities. The occurrence of
% Other 0.52 (13.2%)
restricted-range species in this sub-region is presumably related
Model deviance 595,716.28
to requirements of more humid conditions and the tropical distri-
Null deviance 119,897.43 bution of most of these species (Short, 1975; Stotz et al., 1996).
Percent explained 79.87% While an analysis of the biogeographic relationships between the
Gran Chaco and the surrounding biomes is outside the objectives
north-northwest–south-southeast, being the northern cluster more of this study, polarized colonization and latitudinal restriction to
specious than the other. The divider between these two clusters dispersal is probably the mechanism underlying the clustering
coincides broadly with the Bermejo-Pilcomayo interfluvium and configuration along the north–south axis. Examples are species
the Lower Paraná river. The interfluvium between the Bermejo and that enter marginally in the region; they occupy very small areas in
Pilcomayo rivers has been previously identified as a disjunction zone the Chaco and include species mostly distributed in neighbouring
in bird distributions in southern South America (Nores, 1992; Short, ecoregions like Amazonia, Chiquitano Forests and the Pantanal
1975), where several pairs of species and subspecies show their in the north (e.g. Ramphocelus carbo, Nystalus chacuru) or like10 | NÁZARO et al.
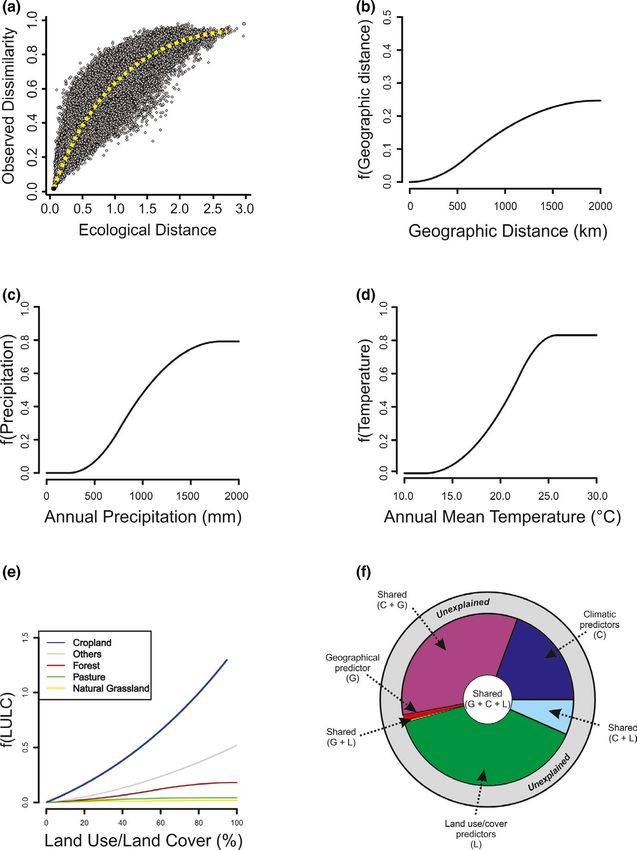
F I G U R E 4 (a) Relationship between
observed compositional dissimilarity
and ecological distance between sites.
The ecological distance between a pair
of sites is calculated as the difference
they have along the single linear
predictor or gradient inferred (obtained
by summation over differences across
I-splines). (b–e) Generalized dissimilarity
model represented by fitted I-splines
(partial regression fits). Eight predictors
were included in the model, and they
deepen in geography, climate and LULC
data. The maximum height reached by
each curve indicates the total amount of
compositional turnover associated with
that variable (it also indicates the relative
importance of that variable in explaining
beta diversity), holding all other variables
constant. The shape of each function
indicates how the rate of compositional
turnover varies along the gradient. (f)
Partition of overall deviance of null model
among unique and shared contributions of
predictor classes
the sub-Andean mountain range and Patagonia in the south (e.g. can emerge (Morse et al., 2014), resulting in unpredictable changes of
Sturnella loyca, Catamenia analis). alpha-, beta-, and gamma-diversity (Socolar et al., 2016). The grow-
ing areas devoted to croplands in the Gran Chaco may have already
caused irreversible changes in the composition of bird communities.
4.2 | Untangling the Gordian knot of β drivers Geographic distance was recorded as the main variable deter-
mining the beta diversity of different taxa, with climatic variables
Remarkably, cropland was the single variable that more strongly influ- becoming more important on a coarser spatial scale (country scale),
enced the beta diversity structure in the Gran Chaco. LULC tends to while land use showed a weaker effect but at a finer spatial scale (e.g.
have stronger effects on biodiversity at small spatial scales (Jeliazkov Keil et al., 2012). Jeliazkov et al. (2016) as well as Keil et al. (2012)
et al., 2016), but in this study, we observed that they were strongly reported the scale dependence between agriculture and biodiver-
associated with beta diversity patterns at the regional scale. This sity, where anthropization affected biodiversity at finer scales but
highlights how human-driven landscape changes could be reshaping not at the regional scale. Contrary to these results, we found that
the beta diversity of birds within the region. The growing intensity of the unique contribution of geographic distance in explaining the beta
human impacts on ecosystems make transformed environments a per- diversity is not as large as expected. Although meaningful, the over-
vasive feature of landscapes (Ellis, Klein Goldewijk, Siebert, Lightman, all explanatory condition of a model including both geographic dis-
& Ramankutty, 2010). Where ecosystem-process modifications tance and climate is not considerably larger than that obtained with
reached a given threshold, novel ecosystems with different properties such variables acting alone since they both covary. Precipitation andNÁZARO et al. | 11 F I G U R E 5 Quantitative procedure and final result during mapping of beta diversity. (a) Intensity matrix of dissimilarity matrix for the Gran Chaco (site-by-site matrix, 2,669 × 2,669, values between 0/pure black and 1/pure white). (b) Intensity plot of the reweighted dissimilarity matrix. Clusters are evident as dark blocks along the main diagonal. (c) Ordination diagram of data points derived from multidimensional scaling applied on the reweighted matrix. (d) Colour assignment using the hue wheel. (e) Bird beta diversity map for the South American Gran Chaco temperature are spatially structured, with warmer and most rainy habitats through land cover change (Baselga, Bonthoux, & Balent, sites to the north and east respectively. Our results also contrast 2015). Agricultural intensification decreases not only the alpha di- with the scale dependence of agriculture–biodiversity relationships. versity of birds but also the beta diversity by landscape homoge- In the Gran Chaco, LULC was the main factor governing beta diversity nization and structural simplification (Jeliazkov et al., 2016; Karp patterns at the regional scale, highlighting the novelty of our study, et al., 2018). In dry forests, bird species richness can be dimin- as LULC was always considered a variable with local-scale effects. ished by habitat simplification, being lower in croplands than in Species habitat requirements are a key determinant of distri- forests (Macchi et al., 2013; MacGregor-Fors & Schondube, 2011; butional shifts when human activities change the distribution of Mastrangelo & Gavin, 2014). In the Gran Chaco, two processes
12 | NÁZARO et al.
could be shaping patterns of beta diversity through the conversion Lira-Noriega, Grady, Padial, & Vitule, 2018). In the Gran Chaco,
of natural areas to croplands. On the one side, a large proportion the richest sites of the region are in the northeast, but analysing
of land being converted to croplands (Baumann et al., 2016) can be beta diversity patterns highlights the complementary importance
shaping the beta diversity in the region through a homogenization of the southernmost sectors and the risks they face. This study is
process that reduces the alpha- and beta-diversity between crop- a substantial contribution to the knowledge of the South American
lands. On the other side, the conversion of natural habitats to agri- Gran Chaco avifauna and how human activities are affecting it.
cultural systems allows the expansion of a different set of species Moreover, the non-anticipated strong effect of cropland cover-
to human-modified landscapes by moving through altered habitat age on the regional-scale diversity suggests a growing footprint
matrices (Macchi et al., 2013; MacGregor-Fors & Schondube, 2011). of land use change over the geographical patterns of bird diversity
As croplands are intercalated with forests that harbour a distinctive in forest biomes. We hope that our results become a basis for fu-
species composition, this process can promote an increase of beta ture ecological studies and conservation decisions that take into
diversity (Macchi et al., 2013). The combination of within-habitat account regional-level faunistic patterns, in order to protect the
homogenization and increasing between-habitat heterogeneity maximum possible diversity of this highly threatened ecosystem.
contributes to new patterns of beta diversity in transformed eco-
systems, following a trajectory of beta diversity change under per- AC K N OW L E D G E M E N T S
sistent anthropogenic pressure (Socolar et al., 2016). This study was partially funded by a doctoral fellowship to MGN
Although our results provide a significant basis for new studies, it provided by the Consejo Nacional de Investigaciones Científicas y
is important to highlight a number of cautionary statements. First, we Técnicas (CONICET). We are very grateful to Tobias Kuemmerle,
used five LULC classes, which could be improved with more detailed who kindly contributed with their comments to improve the first
and precise coverage variables that can better capture subtle differ- version of the manuscript. We also want to express gratitude to the
ences in the use of the mosaic of habitats by bird species. Second, two anonymous reviewers who not only made a careful reading of
we used the same LULC variables for modelling individual species our manuscript but also offered genuinely constructive suggestions.
distribution and analysing beta diversity patterns. In spite of this, we
do not expect circularity in data analyses, since the studies were fo- DATA AVA I L A B I L I T Y S TAT E M E N T
cused on different entities (i.e. while habitat suitability models focus The authors confirm that the data supporting the findings of this
on the species level, GDM focuses on the community level). Third, study are available within the article and its supplementary materials.
the effect of croplands on bird beta diversity could mask the effect
of forest cover, since the change in the percentage of cropland per ORCID
site was highly inversely correlated with the change in forest cover Daniel A. Dos Santos https://orcid.org/0000-0002-3259-7214
(see Appendix S3). Lastly, as we were limited by the extension of the
land use layers, we modelled the species distributions using occur- REFERENCES
rence data from the Gran Chaco region only. We acknowledge that Aitchison, J. (1982). The statistical analysis of compositional data.
more accurate patterns can emerge if species distributions are mod- Journal of the Royal Statistical Society, 44, 139–177. https://doi.
org/10.1111/j.2517-6161.1982.tb01195.x
elled using both occurrence data from their entire ranges and land
Andrade-Díaz, M. S., Sarquis, J. A., Loiselle, B. A., Giraudo, A. R., & Díaz-
use layers of a greater extent (e.g. covering all South America), high Gómez, J. M. (2019). Expansion of the agricultural frontier in the
resolution and representing different dates, like those we employed. largest South American Dry Forest: Identifying priority conservation
Unfortunately, land use layers of such characteristics do not yet exist. areas for snakes before everything is lost. PLoS ONE, 14, e0221901.
https://doi.org/10.1371/journal.pone.0221901
In recent years, the Gran Chaco has been subjected to agricul-
Antão, L. H., McGill, B., Magurran, A. E., Soares, A. M., & Dornelas, M. (2019).
tural expansion and intensification (Baumann et al., 2017). It expe- β-diversity scaling patterns are consistent across metrics and taxa.
rienced one of the highest deforestation rates worldwide, mainly Ecography, 42(5), 1012–1023. https://doi.org/10.1111/ecog.04117
due to the expansion of soybean production and industrial cattle Barnagaud, J. Y., Kissling, W. D., Tsirogiannis, C., Fisikopoulos,
V., Villéger, S., Sekercioglu, C. H., & Svenning, J. C. (2017).
ranching (Baumann et al., 2017; Grau, Gasparri, & Aide, 2005). If
Biogeographical, environmental and anthropogenic determinants
this process continues without regulation, it could cause great and of global patterns in bird taxonomic and trait turnover. Global
perhaps irreversible changes on the Chacoan avifauna (Semper- Ecology and Biogeography, 26, 1190–1200. https://doi.org/10.1111/
Pascual et al., 2018). For conservation purposes, it is essential to geb.12629
analyse not only the richness patterns but also compositional dis- Baselga, A. (2010). Partitioning the turnover and nestedness compo-
nents of beta diversity. Global Ecology and Biogeography, 19, 134–143.
similarities between sites (Devictor et al., 2010). The Chaco's pro-
https://doi.org/10.1111/j.1466-8238.2009.00490.x
tected area network is insufficient and sparse (Nori et al., 2016), Baselga, A., Bonthoux, S., & Balent, G. (2015). Temporal beta diversity of
so studies that explore in-depth the replacement and nested- bird assemblages in agricultural landscapes: Land cover change vs.
ness components of beta diversity make significant contributions stochastic processes. PLoS ONE, 10, e0127913.
Baumann, M., Gasparri, I., Piquer-Rodriguez, M., Gavier Pizarro, G.,
(Baselga, 2010; Socolar et al., 2016). Detecting priority conserva-
Grifiths, P., Hostert, P., & Kuemmerle, T. (2017). Carbon emissions
tion areas is a huge challenge for conservationists and should be from agricultural expansion and intensification in the Chaco. Global
based on integrated views of alpha- and beta-diversity (Zwiener, Change Biology, 23, 1902–1926. https://doi.org/10.1111/gcb.13521NÁZARO et al. | 13
Baumann, M., Piquer-Rodríguez, M., Fehlenberg, V., Gavier Pizarro, G., Hawkins, B. A., Diniz-Filho, J. A., Jaramillo, C. A., & Soeller, S. A. (2006).
Kuemmerle, T. (2016). Land-use competition in the South American Post-Eocene climate change, niche conservatism, and the latitudinal
Chaco. In J. Niewöhner (Ed.), Land use competition: Ecological, eco- diversity gradient of New World birds. Journal of Biogeography, 33,
nomic and social perspectives (pp. 215–229). Cham: Springer. 770–780. https://doi.org/10.1111/j.1365-2699.2006.01452.x
Becker, R. A., Chambers, J. M., & Wilks, A. R. (1988). The new S language. Herzog, S. K., & Kessler, M. (2002). Biogeography and composition of
Pacific Grove, CA: Wadsworth. dry forest bird communities in Bolivia. Journal of Ornithology, 143,
Bucher, E. H. (1982). Chaco and caatinga – South American arid savannas, 171–204. https://doi.org/10.1007/BF02465448
woodlands and thickets. In B. J. Huntley & B. H. Walker (Eds.), Ecology Herzog, S. K., Terrill, R. S., Jahn, A. E., Remsen, J. V. Jr., Maillard, Z. O.,
of tropical savannas (Vol. 42, pp. 48–79). Berlin, Heidelberg: Springer. García-Solíz, V. H., … Vidoz, J. K. (2016). Birds of Bolivia: Field guide.
Carretero, M. A., & Sillero, N. (2016). Evaluating how species niche mod- Santa Cruz de la Sierra: Asociación Armonía.
elling is affected by partial distributions with an empirical case. Acta Hijmans, R. J., Cameron, S. E., Parra, J. L., Jones, P. G., & Jarvis, A. (2005).
Oecologica, 77, 207–216. Very high resolution interpolated climate surfaces for global land
Clark, M. L., Aide, T. M., Grau, H. R., & Riner, G. (2010). A scalable ap- areas. International Journal of Climatology, 25, 1965–1978. https://
proach to mapping annual land cover at 250 m using MODIS time doi.org/10.1002/joc.1276
series data: A case study in the Dry Chaco ecoregion of South Jeliazkov, A., Mimet, A., Chargé, R., Jiguet, F., Devictor, V., & Chiron, F.
America. Remote Sensing of Environment, 114, 2816–2832. https:// (2016). Impacts of agricultural intensification on bird communities:
doi.org/10.1016/j.rse.2010.07.001 New insights from a multi-level and multi-facet approach of biodi-
Cobos, M. E., Peterson, A. T., Barve, N., & Osorio-Olvera, L. (2019). kuenm: versity. Agriculture, Ecosystems & Environment, 216, 9–22. https://doi.
An R package for detailed development of ecological niche models org/10.1016/j.agee.2015.09.017
using Maxent. PeerJ, 7, e6281. https://doi.org/10.7717/peerj.6281 Kalinka, A. T. (2013). The probability of drawing intersections: extending
Corbelli, J. M., Zurita, G. A., Filloy, J., Galvis, J. P., Vespa, N. I., & Bellocq, I. the hypergeometric distribution. arXiv Preprint arXiv, 1305.0717.
(2015). Integrating taxonomic, functional and phylogenetic beta diver- Karp, D. S., Frishkoff, L. O., Echeverri, A., Zook, J., Juárez, P., & Chan,
sities: Interactive effects with the biome and land use across taxa. PLoS K. M. A. (2018). Agriculture erases climate-driven β-diversity in
ONE, 10, e0126854. https://doi.org/10.1371/journal.pone.0126854 Neotropical bird communities. Global Change Biology, 24, 338–349.
del Hoyo, J., Elliott, A., Sargatal, J., Christie, D. A., & Kirwan, G. (Eds.). https://doi.org/10.1111/gcb.13821
(2019). Handbook of the birds of the world alive. Barcelona: Lynx Keil, P., Schweiger, O., Kühn, I., Kunin, W. E., Kuussaari, M., Settele, J., …
Edicions. Retrieved from http://www.hbw.com/ Storch, D. (2012). Patterns of beta diversity in Europe: The role of cli-
Devictor, V., Mouillot, D., Meynard, C., Jiguet, F., Thuiller, W., & Mouquet, mate, land cover and distance across scales. Journal of Biogeography,
N. (2010). Spatial mismatch and congruence between taxonomic, 39, 1473–1486. https://doi.org/10.1111/j.1365-2699.2012.02701.x
phylogenetic and functional diversity: The need for integrative con- Koivula, M. J., Chamberlain, D. E., Fuller, R. J., Palmer, S. C. F., Bankovics,
servation strategies in a changing world. Ecology Letters, 13, 1030– A., Bracken, F., … Watt, A. D. (2017). Breeding bird species diversity
1040. https://doi.org/10.1111/j.1461-0248.2010.01493.x across gradients of land use from forest to agriculture in Europe.
Dormann, C. F., Schweiger, O., Augenstein, I., Bailey, D., Billeter, R., De Ecography, 41, 1331–1344. https://doi.org/10.1111/ecog.03295
Blust, G., … Zobel, M. (2007). Effects of landscape structure and Legendre, P., Borcard, D., & Peres-Neto, P. R. (2005). Analyzing beta
land-use intensity on similarity of plant and animal communities. diversity: Partitioning the spatial variation of community com-
Global Ecology and Biogeography, 16, 774–787. position data. Ecological Monographs, 75, 435–450. https://doi.
Dos Santos, D. A. (2011). SyNet: Inference and analysis of sympatry net- org/10.1890/05-0549
works. R package version 2.0. https://CRAN.R-project.org/packa Macchi, L., Grau, H. R., Zelaya, P. V., & Marinaro, S. (2013). Trade-offs be-
ge=SyNet tween land use intensity and avian biodiversity in the dry Chaco of
Dos Santos, D. A., Cuezzo, M. G., Reynaga, M. C., & Domínguez, E. (2011). Argentina: A tale of two gradients. Agriculture Ecosystems & Environment,
Towards a dynamic analysis of weighted networks in biogeography. 174, 11–20. https://doi.org/10.1016/j.agee.2013.04.011
Systematic Biology, 61, 240–252. MacGregor-Fors, I., & Schondube, J. E. (2011). Use of tropical dry forests
Dos Santos, D. A., & Deutsch, R. (2010). The positive matching index: A and agricultural areas by Neotropical bird communities. Biotropica,
new similarity measure with optimal characteristics. Pattern Recognition 43, 365–370. https://doi.org/10.1111/j.1744-7429.2010.00709.x
Letters, 31, 1570–1576. https://doi.org/10.1016/j.patrec.2010.03.010 Manion, G., Lisk, M., Ferrier, S., Nieto-Lugilde, D., Mokany, K., &
Ellis, E. C., Klein Goldewijk, K., Siebert, S., Lightman, D., & Ramankutty, Fitzpatrick, M. C. (2017). gdm: Generalized dissimilarity modeling. R
N. (2010). Anthropogenic transformation of the biomes, 1700 to package version 1.3.7.
2000. Global Ecology and Biogeography, 19, 589–606. https://doi. Mastrangelo, M. E., & Gavin, M. C. (2014). Impacts of agricultural in-
org/10.1111/j.1466-8238.2010.00540.x tensification on avian richness at multiple scales in Dry Chaco for-
Ferrier, S., Manion, G., Elith, J., & Richardson, K. (2007). Using generalized ests. Biological Conservation, 179, 63–71. https://doi.org/10.1016/j.
dissimilarity modelling to analyse and predict patterns of beta diver- biocon.2014.08.020
sity in regional biodiversity assessment. Diversity and Distributions, 13, Melo, A. S., Rangel, T. F., & Diniz-Filho, J. A. (2009). Environmental drivers of
252–264. https://doi.org/10.1111/j.1472-4642.2007.00341.x beta-diversity patterns in New-World birds and mammals. Ecography,
Fitzpatrick, M. C., Sanders, N. J., Normand, S., Svenning, J. C., Ferrier, 32, 226–236. https://doi.org/10.1111/j.1600-0587.2008.05502.x
S., Gove, A. D., & Dunn, R. R. (2013). Environmental and historical Morse, N. B., Pellissier, P. A., Cianciola, E. N., Brereton, R. L., Sullivan,
imprints on beta diversity: Insights from variation in rates of spe- M. M., Shonka, N. K., … McDowell, W. H. (2014). Novel ecosystems
cies turnover along gradients. Proceedings of the Royal Society B, 280, in the Anthropocene: A revision of the novel ecosystem concept
20131201. https://doi.org/10.1098/rspb.2013.1201 for pragmatic applications. Ecology and Society, 19, 12. https://doi.
Gaston, K. J., Davies, R. G., Orme, C. D. L., Olson, V. A., Thomas, G. H., org/10.5751/ES-06192-190212
Ding, T.-S., … Blackburn, T. M. (2007). Spatial turnover in the global Nores, M. (1992). Bird speciation in subtropical South America in relation
avifauna. Proceedings of the Royal Society B: Biological Sciences, 274, to forest expansion and retraction. The Auk, 109, 346–357. https://
1567–1574. https://doi.org/10.1098/rspb.2007.0236 doi.org/10.2307/4088203
Grau, H. R., Gasparri, N. I., & Aide, T. M. (2005). Agriculture expansion Nori, J., Torres, R., Lescano, J. N., Cordier, J. M., Periago, M. E., & Baldo,
and deforestation in seasonally dry forests of northwest Argentina. D. (2016). Protected areas and spatial conservation priorities for en-
Environmental Conservation, 32, 140–148. demic vertebrates of the Gran Chaco, one of the most threatenedYou can also read