SOCIO-ECONOMIC AND ENVIRONMENTAL SITUATION AT SURROUNDING VILLAGES OF OLAM'S BLACK PEPPER PLANTATION - Bao Huy, Nguyen The Hien, Ho Dinh Bao and ...
←
→
Page content transcription
If your browser does not render page correctly, please read the page content below
Vietnam Black Pepper Plantation

 SOCIO-ECONOMIC AND ENVIRONMENTAL
SITUATION AT SURROUNDING VILLAGES OF
 OLAM’S BLACK PEPPER PLANTATION
 Bao Huy, Nguyen The Hien, Ho Dinh Bao and Nguyen Thi Thao

 March 2021
Study team

 Id Name Academic Professional Institution
 degree
 1 Bao Huy Prof. Ph.D. Forest Resource and Consultancy for
 Environment Management, Forest Resources and
 Community Development Environment
 Management (Frem)

 2 Nguyen The Hien MSc. Flora, Social Forestry Frem

 3 Ho Dinh Bao MSc. Fauna, Social Forestry Tay Nguyen
 University and Frem

 4 Nguyen Thi Thao Dr. Medicine, Community Frem
 Health Care

Acknowledgement
This study is funded and operated by OLAM Spices. We, the study team, would like to thank all
informants from the villages of Ia Brel, Ia Jol, the surrounding farmers and workers of the
OLAM Black Pepper Plantation, who provided the useful information about their livelihoods;
Thanks also to Mr. Veluswamy Lingaiah, Lam Quang Trung and Olam’s staffs for providing
information, logistics and helping with field study.

 ii
Abbreviation
 ANR Assisted Natural Regeneration
APFNet Asia-Pacific Network for Sustainable Forest Management and Rehabilitation
CEMA Committee for Ethnic Minority Affairs
CV Coefficient Variation (%)
D Diameter at breast height of the tree (cm)
DDF Dry dipterocarp forest
FAO the Food and Agricultural Organization
H Height of the tree (m)
HH Household
IPC Income per capita (Million VND/person/month)
ITTO International Tropical Timber Organization
IUCN International Union for Conservation of Nature
n, N Number of samples
NTFP Non- Timber Forest Products
PCA Principal Components Analysis
S Standard deviation

 iii
TABLE OF CONTENTS

1 INTRODUCTION............................................................................................. 8
 1.1 Rationale ........................................................................................................................... 8
 1.2 Objectives of the study ..................................................................................................... 8
2 APPROACH AND METHODOLOGY ........................................................ 10
 2.1 Approach ........................................................................................................................ 10
 2.2 Selection of villages and collection of background information at the village level ..... 10
 2.3 Collection of household information on their livelihoods and creation of a dataset of
 interviewed households ............................................................................................................. 12
 2.3.1 Selection of household representatives to interview and sample size (number of
 interviewees) .......................................................................................................................................12
 2.3.2 Collection of household information on livelihoods and establishment of a household
 dataset 14
 2.4 Natural forest inventory .................................................................................................. 15
 2.5 Information and data analysis ......................................................................................... 15
 2.5.1 Data, information analysis on socio- economic issues ........................................................15
 2.5.2 Analysis of forest, plant, wild animal data ..........................................................................16
3 RESULTS AND DISCUSSION ..................................................................... 18
 3.1 Background information on socio- economic environmental characteristics of the two
 studied villages .......................................................................................................................... 18
 3.1.1 Natural environmental conditions of the studied area .........................................................18
 3.1.2 Socio-economic characteristics at village level ...................................................................18
 3.2 Information and estimated statistics related to household livelihoods ........................... 21
 3.2.1 Statistics of household structure ..........................................................................................21
 3.2.2 Household education ...........................................................................................................22
 3.2.3 Health insurance, social insurance, food security of the household ....................................24
 3.2.4 Drinking and domestic water of the household ...................................................................24
 3.2.5 Household housing ..............................................................................................................25
 3.2.6 Use of electricity and other energy ......................................................................................26
 3.2.7 Sanitation and sewage system of the household ..................................................................26
 3.2.8 Communication information ...............................................................................................27
 3.2.9 Social unions and household participation ..........................................................................27
 3.2.10 Household income level by income per capita ....................................................................27
 3.3 Farming versus household livelihood ............................................................................. 28
 3.3.1 Agricultural land use right (Red Book) for households ......................................................28
 3.3.2 Land area and cultivated land area of household and factors affected to ............................28
 3.3.3 Main crops and its effect on the total income of the household ..........................................31
 iv
3.3.4 Soil, fertilizer, pesticides, herbicides and crop productivity ...............................................34
 3.3.5 Livestock and Vet versus household income level ..............................................................35
 3.3.6 Water source for farming.....................................................................................................37
 3.3.7 Fire used for farming ...........................................................................................................37
 3.3.8 Monoculture versus multi-crop and intercropping ..............................................................37
 3.4 Agriculture and forestry extension services for the household ...................................... 38
 3.5 Local watershed management versus household livelihoods ......................................... 38
 3.6 Management of biodiversity, forest resources and impacts on existing degraded forests
 39
 3.6.1 Management of the natural forests around Olam pepper farm ............................................39
 3.6.2 Current use of wood, firewood, collection of NTFPs, and hunting of wild animals in the
 studied villages ....................................................................................................................................41
 3.6.3 Current forest state around the OLAM pepper farm and consequences of loss and
 degradation of natural dipterocarp forest on household livelihoods and environment........................43
 3.7 Household economy versus livelihoods ......................................................................... 48
 3.7.1 Income sources and balance of cash income and expenditure of the household .................48
 3.7.2 Factors affecting household economy and livelihoods........................................................53
4 RECOMMENDATIONS FOR SUSTAINABLE FARMING
LANDSCAPE AND LIVELIHOODS ................................................................. 56
 4.1 Improving household living standards ........................................................................... 56
 4.2 Improving farming system.............................................................................................. 57
 4.3 Improving local watershed ............................................................................................. 59
 4.4 Rehabilitating forest, biodiversity and landscape ........................................................... 59
 4.4.1 The purpose of restoring the natural forest ecosystem in the area ......................................59
 4.4.2 Approach for forest rehabilitation .......................................................................................59
 4.4.3 Silviculture measures for rehabilitating degraded dipterocarp forests ................................60
 4.4.4 Regulations to involve local communities into forest landscape rehabilitation ..................68
5 CONCLUSION................................................................................................ 69
6 Annexes ............................................................................................................ 73
 6.1 Annex 1: Form 1 - Collecting basic information at village level ................................... 73
 6.2 Annex 2: Form 2 - Questionnaire for semi-structure individual interview .................... 76
 6.3 Annex 3: List of Informants ........................................................................................... 82
 6.4 Annex 4. Some photos of interview and discussion with local people in studied villages
 85
 6.5 Annex 5: Coding variables and units .............................................................................. 86
 6.6 Annex 6: Forms for forest survey ................................................................................... 88

 v
List of Tables
Table 1. Summary statistics for income per capita/month of household and calculation of number
sampling size ...............................................................................................................................................13
Table 2. The number of people and percentages interviewed by ethnic group, women in each selected
village and in total .......................................................................................................................................14
Table 3. Proportion of ethnic groups in the two studied villages ................................................................19
Table 4. Household economy classified by Government in the two studied villages .................................20
Table 5. Summary statistics of family structure of the household in the two studied villages....................22
Table 6. Categorizing drinking water sources of the households according to WHO/UNICEF (2018) .....25
Table 7. Categorizing domestic water sources of households according to WHO/UNICEF (2018) ..........25
Table 8. Percentage of households by housing type....................................................................................26
Table 9. Percentage of households by toilet category according to WHO / UNICEF (2018) .....................26
Table 10. Rate of Household Income Levels based on Income Per Capita.................................................27
Table 11. Summary statistics of land area at household level .....................................................................28
Table 12. Summary statistics of components in principal component equation related to land area of the
households ...................................................................................................................................................30
Table 13. Analysis of Variance for Land area (ha) by two factors of HH Income Level and Village ........30
Table 14. Multiple range tests for Contracted land area (ha) per HH by Ethnic group ...............................31
Table 15 Summary statistics of main crops area of the household .............................................................31
Table 16. Estimated total crops area and the rate at the village level..........................................................32
Table 17. Averaged productivity of main crops in the studied area ............................................................35
Table 18. Total yield of main crops in the studied villages.........................................................................35
Table 19 Summary statistics of numbers of livestock at household level ...................................................36
Table 20. Estimated total numbers of livestock in the two studied villages ...............................................36
Table 21. Household percentage per water sources for watering crops in the studied area ........................37
Table 22. Summary statistics of forest honey and bamboo shoots collected by households in the two
studied villages ............................................................................................................................................42
Table 23. Analysis of Variance for Total income of the household effected by Forest honey and Bamboo
shoots...........................................................................................................................................................43
Table 24. List of wild animals existing in two transects in the eastern and western forest hills of Olam
pepper farm .................................................................................................................................................44
Table 25. List of forest plant species in IUCN, Viet Nam Red List and Decree 06/2019/ND-CP existing in
two transects in the easter and western forest hills of Olam pepper farm ...................................................45
Table 26. List of dominant tree species with density rate N% > 3 % in the easter and western forest hills
of Olam pepper farm ...................................................................................................................................46
Table 27. List of dominant regenerated tree species with density rate n % > 3 % in the easter and western
forest hills of Olam pepper farm .................................................................................................................47
Table 28. Summary statistics for income sources of the household in the two studied villages .................49
Table 29. Multiple Range Tests for Total Income by Household Income Level ........................................50
Table 30. Summary statistics of expenditure categories and household expenditures for both studied
villages ........................................................................................................................................................50
Table 31. Analysis of Variance for Balance of cash income and expenditure of the household by four
factors ..........................................................................................................................................................52
Table 32. Least Squares Means for Balance of cash income and expenditure of the household with 95.0
Percent Confidence Intervals.......................................................................................................................52
Table 33. Multiple Range Tests for Balance of cash income and expenditure by Household Income Level
and Who makes decision on expenditures of the household. ......................................................................53
Table 34. List of plant species used for assisted natural regeneration and enrichment planting in tropical
dry dipterocarp forest after over exploitation ..............................................................................................62
Table 35. List of plant species in IUCN, Viet Nam Red List and Decree 06/2019/ND-CP existing or
potential for tropical dry dipterocarp forest rehabilitation ..........................................................................64

 vi
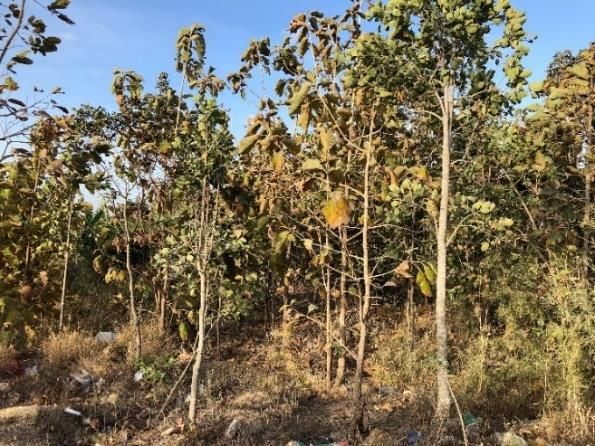
Table 36. List of wild animal species in IUCN, Viet Nam Red Book and Decree 06/2019/ND-CP
potential for tropical dry dipterocarp forest rehabilitation ..........................................................................65

List of Figures
Figure 1. Location of Olam’ pepper farm, two eastern and western hill forests and two related
surrounding villages: Ia Brel and Ia Jol belong to Ia Le commune, Chu Puh district, Gia Lai province,
Viet Nam (Source: Google Earth Pro).........................................................................................................11
Figure 2. Participatory sketching of the residential and farming areas of the two studied villages ............19
Figure 3. Rural infrastructure in the two studied villages has been built or/and supported by Olam Pepper
Farm ............................................................................................................................................................21
Figure 4. Education levels of the head of household...................................................................................23
Figure 5. Number of children dropping out of school and percentage of households.................................23
Figure 6. Plot of component high weights of variables related to land area of households in the studied
area ..............................................................................................................................................................29
Figure 7. Photos of some main crops in the two studied villages ...............................................................33
Figure 8. Plot of component weights of variables of total income of household with area of main crops .34
Figure 9. Model of intercropping cashew and cassava on sandy soil..........................................................38
Figure 10. Map of Landscape of Olam Pepper Farm and surrounding forest hills .....................................40
Figure 11. Farming, charcoal making, and illegal logging still occur on degraded forest hills to the east
and west of Olam farm. ...............................................................................................................................41
Figure 12. Percentage of households using fuels for cooking .....................................................................42
Figure 13. Photos of current forest state around the Olam Pepper farm .....................................................44
Figure 14. Diameter distribution of tree layer with diameter at breast height (D) greater than or equal to 5
cm in the easter and western forest hills of Olam pepper farm ...................................................................46
Figure 15. Height (H) distribution of regenerated tree layer with diameter at breast height less than 5 cm
and the height of regenerated trees greater than or equal to 0.5 m in the easter and western forest hills of
Olam pepper farm........................................................................................................................................48
Figure 16. Estimated percentage of households per cash income sources ..................................................50
Figure 17. Averaged expenditure categories of the household in percent in the two studied villages ........51
Figure 18. Estimated percentage of households by who makes the decision on expenditures in the
household ....................................................................................................................................................53
Figure 19. Plot of component weights of Income Per Capita with factors of household livelihood ...........55
Figure 20. Illustration of multi-purpose indigenous trees: Food, medicine, aromatic compound, fodder,
wood fuel, timber, etc. (Huy and Hien, 2021) .............................................................................................61

 vii
1 INTRODUCTION
1.1 Rationale
 Olam’s Black Pepper Farm in Ia Le commune, Chu Puh district, Gia Lai province, Viet
Nam, lies in a highly intensive production area. Perennial and annual crops are occupying almost
all arable and accessible lands. Olam's pepper farm is surrounded by living and farming
communities that are closely related to the landscape approach to sustainable pepper growing.
 Olam has planted 275 ha of black pepper with total anticipated production of 1,650 MT /
year; conducted the afforestation around 300 ha of mainly Acacia hybrid and being assigned by
Gia Lai province to rehabilitate about 336 ha of degraded dipterocarp forests in two hills located
in the East and West of Olam’s pepper farms (Source: Olam office in Ia Le Commune, 2021)
 Natural landscapes include dipterocarp forests, rivers, streams and swamps that have not
been protected specifically. With the ecological characteristics of the area such as the vegetation
previously distributed mainly as dipterocarp forest, many soil points are sand and rock with low
organic matter content. Low forest coverage along with overexploitation of forest products
results in low large tree density leading to frequent soil erosion throughout the landscape,
thereby reducing soil nutrient, water quality. Therefore, the degraded dipterocarp forests here
should have intensive silviculture techniques to rehabilitate.
 The socio-economic trend is that the rural area organizes cultivation according to the
model of scattered independent households, each household cultivates several hectares of
agricultural commodity products, mainly cassava, cashew, pepper, maize, and beans, raises goats
and cows. The agricultural land expansion of the surrounding communities is present both in
Olam owned land and on the surrounding mountain slopes, at a high rate. As a result, some of
the remaining natural spots in the nearby landscape are at stake and life expectancy is extremely
low.
 Olam is providing a possible way to improve the relationships among socio-economic and
environmental factors for more sustainable development and responsible businesses. Thus, Olam
has the targeted objectives:
 - Environment, by enlarging the scope of action to the neighboring areas to protect
 remaining and rehabilitating natural forests and restore adjacent degraded lands. This
 will need a program on natural forest rehabilitation including restoring biodiversity,
 forest stands, protecting watershed and streams, sequestering carbon to mitigate
 climate change in the local region.
 - Social, by engaging with local farmers within Olam's boundaries and on contiguous
 plots to build an agreed landscape management plan where the surrounding
 communities would benefit from Olam’s support while ensuring the right
 implementation of landscape action plan.
 To support this important mission, Olam is submitting a project entitled “Back Pepper
Living Landscape” granted by Asia-Pacific Network for Sustainable (APFNet). The expectation
of the project will place pepper into a landscape level approach that will positively impact on
rehabilitating natural landscape and improving livelihoods of related local communities.
1.2 Objectives of the study
 This study aims to provide the detailed, specific information on the livelihoods of
surrounding communities to develop context-specific, sustainable long-term projects that are
 8
relevant and motivated by the needs of the communities. This result can also be the basis for
effectively measuring any changes or long-term impacts during and after project interventions.

 This work is also expected to show the recommendations for communities, Olam and
stakeholders for long term thematic and specific interventions.

 9
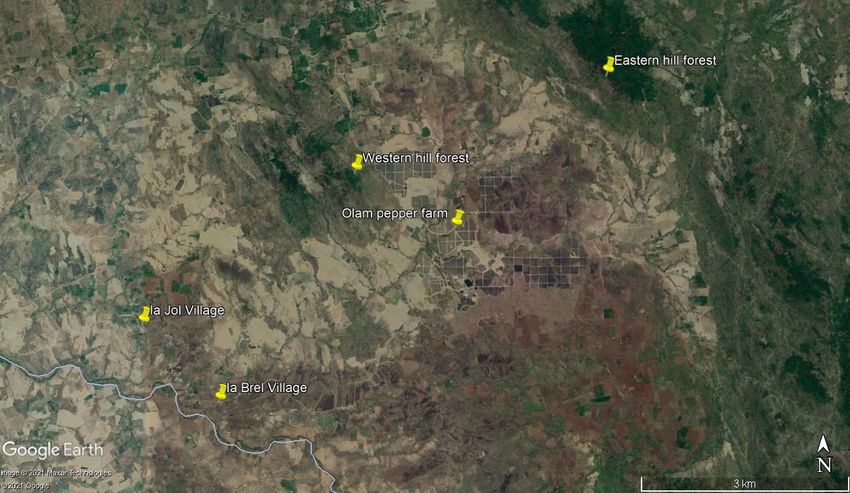
2 APPROACH AND METHODOLOGY
2.1 Approach
 There are the five forms of capital required for sustainable livelihood: i) Natural capital:
land, forests, water; ii) Physical capital: social infrastructure such as roads, utilities, schools,
hospitals, communication information, etc.; iii) Financial capital: cash income or saving; iv)
Human capital: Health, nutritional level, educational standards, and skills; and v) Social capital:
Social relationship including relations to formal organization (Thuan and Huy, 2005). Therefore,
the study approaches the five forms of livelihood mentioned above to design questionnaires and
discussions to collect information and feedback from local people.
 To conduct group discussions and semi-structured interviews, the sample number of
informants needs to be large enough by statistical standards. The representative samples of the
households were selected randomly according to the different target groups. The questionnaires
for interviews and discussions were designed around 5 fields of rural livelihoods to show a
general and comprehensive picture of household and community life, and problems they are
facing in efforts to escape poverty and towards sustainable livelihoods.
 In addition, rapid forest inventory such as transects, sampling plots were conducted to
supplement, clarify and cross-check information from representatives of households related to
state of the art of surrounding natural forest resources.
2.2 Selection of villages and collection of background information at the village
 level
 The residential area and cultivated land of the local people are concentrated to the
southwest of Olam pepper farm, including the two closest villages, Ia Brel and Ia Jol, with the
relationship in land and forest resource use with Olam.
 Therefore, this study was conducted in two villages Ia Brel and Ia Jol, in Ia Le commune,
Chu Puh district, Gia Lai province. Located at geographical coordinates N 13025'30”, E 108011’
06” (Figure 1). These two villages are located 2 - 5 km from Olam pepper farm.

 10
Gia Lai province

 Dak Lak province

 Figure 1. Location of Olam’ pepper farm, two eastern and western hill forests and two related
 surrounding villages: Ia Brel and Ia Jol belong to Ia Le commune, Chu Puh district, Gia Lai
 province, Viet Nam (Source: Google Earth Pro)

 At each village, a group discussion was conducted according to the open-ended questions
of Form 1 in Annex 1, with participation of:
 - At Ia Brel village: Two people of village head and deputy head
 - At Ia Jol village: Four people of village head, deputy, women's union and farmer
 representatives.
 The list of six representatives of the two villages involved into the discussions presented
in Annex 3. The discussions focused on basic information at village level and concerned issues
of the local people in the view of the key people. Main topics were as follows:
 - Basic village information: Population, number of households, village history
 summary,
 - Participatory sketching of village landscape
 - Household situation: Education levels, HH economy classification, religion, ...
 - Agriculture cultivation, livestock
 - Forest and forest land contracted or owned.
 - Infrastructures in the village
 - Management of other natural sources: forest, biodiversity, wild animal
 - Cooperation activities with Olam pepper farm
 - Etc.

 11
2.3 Collection of household information on their livelihoods and creation of a
 dataset of interviewed households
2.3.1 Selection of household representatives to interview and sample size (number of
 interviewees)
 To collect household (HH) information on their livelihoods, the study interviewed mainly
representatives of households in two selected villages: Ia Brel and Ia Jol and few farmers who
have their farm closed to Olam’s pepper farm and some workers of Olam farm.
 The method of random sampling by subjects (proportion of household economy, ethnic
composition, ...) was applied, in which representatives of households were female that reached at
least one third.
 - In Ia Brel village: The rate of poor households is extremely low (6.8%) and there are
 many ethnic groups but with no clear ethnic groups dominated; therefore, random
 sampling was used without target groups. In this village, 31 representatives of
 randomly selected households were interviewed.
 - In Ia Jol village: The rate of poor households also is low (10.7%) and there are many
 ethnic groups, in which the Dao ethnic group dominates at 60% of total household in
 the village; thus, random sampling by ethnic groups was applied, with Dao ethnic
 group was 60% of the sample size, then the remaining 40% of the samples for other
 ethnic groups. In this village 29 representatives of randomly selected households
 were interviewed.
 In addition, to supplement information from stakeholders, the study also interviewed 5
representatives of smallholder farmers who are cultivating around Olam farm and 02 workers of
Olam farm.
 Totally 67 interviewees were interviewed in this study, in which there were 60
representatives of households of the two selected villages, or 65 local farmers involved. List of
informants presented in Annex 3.
 The sample size (number of interviewees) was designed to reach the allowable error of
10%. After randomly sampling the interviewees, calculated the number of samples
(interviewees) to make sure if there is a given error or not. Calculating the needed number of
interviewed households based on variations in household’s income per capita / month – a criteria
for classifying household economy according to multi-dimensional poverty line (Prime Minister,
2015, 2021) (Huy, 2017; Huy and Long, 2019) (Table 1).

 12
Table 1. Summary statistics for income per capita/month of household and calculation of number
 sampling size
 ID Statistics Ia Brel Ia Jol Total
 village village
 1 ninterviewed (Sample number of households interviewed) 31 29 60
 2 ̅ (Averaged income per capita, Mil. VND/month) 2.194
 3 S (Standard deviation) 2.630
 4 CV%: Coefficient variation 119.845
 5 Min 0.197
 6 Max 19.667
 8 Ni, N (Total households in village i and grand total, 147 93 240
 respectively)
 9 nrequired (Sample number of households required to 28 18 46
 reach 10% allowed error for each village and in total)

where:
 ( 2 × %2 ) (22 ×119.845%2 ) (1)
 = 2 × %2
 = 22 ×119.845%2
 = 46
 %2 + 10%2 +
 240

 Where t = 2, E% is the allowable error in percent = 10%; N is total households; CV% is
the coefficient variation in percent = (100 × S/ ̅), S is standard deviation, ̅ is the averaged
income per capita per month of households.
 This result shows that the number of people interviewed in the two selected villages was
60, exceeding the required number of 46.
 From there, the number of samples required to be interviewed by the village is calculated
as follows:
 nrequired (Village) = nrequired in total × Ni (Village) / N (2)
 nrequired (Ia Brel village) = 46 × 147 / 240 = 28 (3)
 nrequired (Ia Jol village) = 46 × 93 / 240 = 18 (4)

 The results showed that the number of interviewees in each village exceeded as required.
In Ia Brel and Ia Jol village, the study interviewed 31 people, 29 people; meanwhile, according
to the request of the allowed error were 28 people and 18 people, respectively.
 The number of people and percentages interviewed by ethnic group, women in each
village presented in Table 2. In which, the proportion of women interviewed was 49%, the Nung
and Dao ethnic people participated the most - because these are the two dominant ethnic groups
in the region.

 13
Table 2. The number of people and percentages interviewed by ethnic group, women in each
 selected village and in total
 Location Ethnic group Female Male Total Percent
 Ia Brel village H Mong 2 9 11 35%
 Dao 1 1 3%
 Nung 4 7 11 35%
 Tay 4 1 5 16%
 Kinh 2 1 3 10%
 Total 13 18 31 100%
 Percent 42% 58% 100%

 Ia Jol village Muong 1 1 2 7%
 Dao 11 8 19 66%
 Nung 3 1 4 14%
 Kinh 3 1 4 14%
 Total 18 11 29 100%
 Percent 62% 38% 100%

 Farmers around and workers Nung 1 1 14%
 of Olam

 Kinh 2 4 6 86%
 Total 2 5 7 100%
 Percent 29% 71% 100%

 All Muong 1 1 2 3%
 H Mong 2 9 11 16%
 Dao 12 8 20 30%
 Nung 7 9 16 24%
 Tay 4 1 5 7%
 Kinh 7 6 13 19%
 Grand total 33 34 67 100%
 Percent 49% 51% 100%

2.3.2 Collection of household information on livelihoods and establishment of a
 household dataset
 Use method of semi- structured interview based on open- ended questionnaires in Form 2
of Annex 2 to collect household information on livelihoods.
 Main contents and information in form 2 collected from interviews with household
representatives are as follows:
 - Household basic information: Ethnic group, number of family members, number of
 laborers, religion, etc.
 - Well- being services for household: Education, health care, housing, sanitation,
 energy, electricity, fuel, etc.
 - Participation in social organizations
 - Farming practices: Owned land area, contracted land, land use right, main crops,
 yield and productivity for each main crop, purpose of crop (sale, consumption, or
 both), livestock, extension services, etc.
 14
- Food security and nutrition
 - Access to forest resources: Local forest management, the need from forest products
 such as wood for housing, barn, firewood, non-timber forest products (NTFPs),
 functions of the natural forest to livelihoods, etc.
 - The meaning of biodiversity to HH livelihood: Intercropping and monocropping
 issues, hunting/gathering, using fire for land clearing, livelihood vs, loss/degraded
 biodiversity, etc.
 - Soil issue: Flooding, using fertilizer and pesticides, soil problem, etc.
 - Water sources: Water for farming, livestock, drinking water, domestic water,
 watershed monitoring, health issues relate to water sources, sewage system, etc.
 - Economic and financial issues: Main income of HH, additional source of income,
 cash incomes form farm, livestock, wage, NTFPs, other, total income, expenditures of
 HH, access to savings and financing/loans, gender issue related to who makes
 decisions of spending money, investing cultivation in HH, etc.
 Annex 4 shows some photos of discussion and interviews with representatives of
households in two studied villages, Ia Brel and Ia Jol.
 Based on interviewing 67 household representatives, a dataset on household livelihoods
in the study area was created, including quantitative, qualitative variables, and descriptive
variables. The qualitative variables were coded for statistical analysis purpose and units of
variables presented in Annex 5.
2.4 Natural forest inventory
 Two forest areas located in the east and the west hills from Olam pepper farm were
surveyed as follows:
 - For describing ecology and measuring forest variables: At each forest hill area,
 establishing two sample plots 300 m2 (10 × 30 m) to record/collect data on ecological
 situation, remaining tree species, diameter at breast height (D, cm), height (H, m) of
 the tree, nearest distance tree to tree, and regeneration of the tree species including
 species name, height of regenerated tree.
 - For recoding forest plants and wild animals: At each hill forest area, set up a transect
 line to record the presence of rare, endangered plants and existing wild animals.
 There were also 2 Olam employees joined the study team to forest survey, their names are
in Annex 3. The forms used for forest survey are presented in Annex 6.
2.5 Information and data analysis
2.5.1 Data, information analysis on socio- economic issues
 Use the developed household livelihood dataset to proceed:
 - Describing socio-economic and livelihood characteristics related to the households.
 - Summarizing the statistics of the household livelihood variables (Huy, 2017)
 - Some variables of household income and expenditure are calculated as follows:
 o Cash income is the income from the sale of crops, livestock, non-timber forest
 products (NTFPs) after deduction of production costs and together with
 salaries and wages (if any). Total cash income was calculated for each
 household in a year (Million VND / HH / year)

 15
o Income includes cash income and any crops, livestock and NTFPs consumed
 by the household (not sold) converted to cash. Total income was calculated
 for each household in a year (Million VND / HH / year)
 o Household expenditure by items such as food (rice, excluding farmers grow
 the rice, especially money to buy milk for families with children under 2 years
 old), education (tuition, other expenses), clothes, household appliance (such as
 televisions, refrigerators, smartphones, motorbikes, pumps, and other
 machines were calculated according to the depreciation rate of the
 equipment), electricity , drinking water (if any), communication (such for
 internet charges, smartphone charges), firewood, other energy (such as gas for
 cooking), health care. Total expenditure was calculated for each household in
 a year (Million VND / household / year)
 o Balance of cash income and expenditure is total cash incomes minus total
 household expenditures in a year (Million VND / HH / year)
 o Income per capita is total income divided by the number of household
 members and calculated per month (Mil. VND / person / month). It is one of
 important indicators to classify the poor, near-poor, average households of the
 Government (Prime Minister, 2015; Decision No. 59/2015 / QD-TTg)
 o Household income level: Based on Income per capita per month indicator
 according to Decree No. 07/2021 / ND-CP (Prime Minister, 2021), this study
 categorized the Household income level and coded as follows:
 ✓ 1: Below minimum income indicator with Income per capita < 1.5 Mil.
 VND/month
 ✓ 2: At average income indicator with Income per capita from 1.5 –
 2.25 Mil. VND/month
 ✓ 3: Above average income indicator with Income per capita > 2.25 Mil.
 VND/month
 - Applying ANOVA to analyze and compare from one to multi factors relating to HH
 livelihoods, economy and using method of 95.0 percent LSD (Fisher's least
 significant difference (LSD) procedure) to identify homogenous groups (Huy, 2017)
 - Principal Components Analysis (PCA): The purpose of the analysis is to obtain a
 small number of linear combinations of the numbers of variables which account for
 most of the variability in the data. Extract numbers of components that had
 eigenvalues greater than or equal to 1.0. Where the values of the variables in the
 equation are standardized by subtracting their means and dividing by their standard
 deviations (Abdi and Williams, 2010; Huy et al., 2020)

2.5.2 Analysis of forest, plant, wild animal data
 Based on data collected on two transects to:
 - Make a list of precious, rare, and endangered wild plant species that still exist in the
 studied forests.
 - Make a list of wild animals that still appear in the studied forests.
 Based on four sample plots data to:
 - Make a list of dominant tree species in the studied forests.
 16
- Set up the diameter distribution of trees layer and height distribution of regenerated
 trees layer.
- Develop a list of plant species used for assisted natural regeneration (ANR) and
 enrichment planting in tropical dry dipterocarp forest (DDF) after over exploitation.
- Develop a list of plant species in IUCN, VIET NAM Red List and Decree
 06/2019/ND-CP existing or potential for tropical dry dipterocarp forest rehabilitation.
- Develop a list of wild animal species in IUCN, Viet Nam Red Book and Decree
 06/2019/ND-CP potential for tropical dry dipterocarp forest rehabilitation.

 17
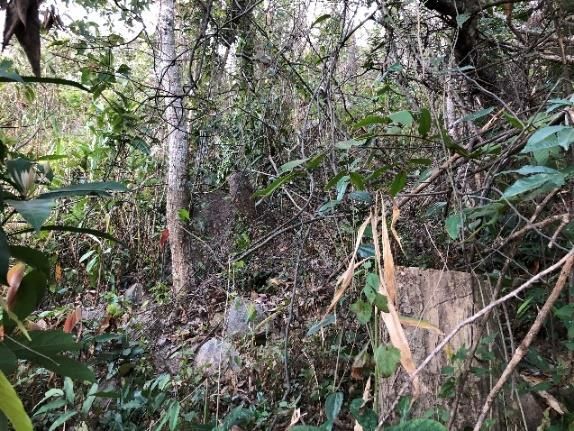
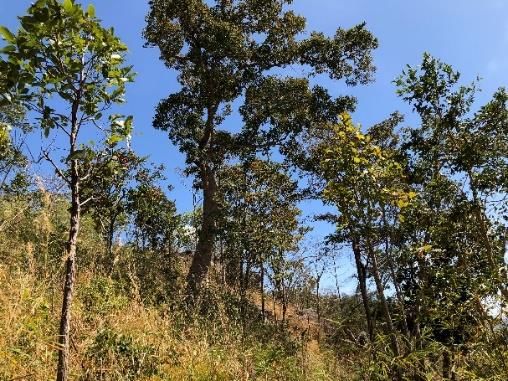
3 RESULTS AND DISCUSSION
3.1 Background information on socio- economic environmental characteristics of
 the two studied villages
3.1.1 Natural environmental conditions of the studied area
 The study area is in the terrain with an average altitude of 300 - 400 m. This is a flat
plain, interspersed with mountains of 500 - 700 m high. The climate is adjacent to the low-lying
Cheo Reo - Phu Tuc so the rainfall is low, about 1,200 - 1,600 mm / year. Droughts usually
occur in the end of November to April next year; with dry and hot westerly winds at the
beginning of the dry season, the temperature can be over 350C, the lowest humidity is below
50%. This area is affected by concentrated heavy rain, so it is easy to generate floods (CEMA,
2020).
 The soil in the area consists of two groups of greyish-yellow soil on acid magma and
alluvial soil. Soils with small red gravel have higher nutrient content and can be cultivated
longer; while low- organic matter sandy soils, rapidly degenerating after a few years of
monoculture. The soils layer is usually not thick, dry in the dry season, and waterlogged in the
rainy season (CEMA, 2020; This study, 2021).
 This is the ecoregion for the distribution of the tropical dry forests dominated by tree
species of Dipterocarpaceae family (Dry dipterocarp forest - DDF). Common features are
drought in the dry season, forest fires and waterlogging in the rainy season. The natural forest
here was seriously degraded, the remaining wood layer has low canopy (< 20%), thin, small
trees, poor quality trees. Forest biodiversity was degraded, most of wildlife was lost, forests have
reduced their water regulation capacity in the basins (This study, 2021).
 The main river here is Ea H Leo, it is also the boundary of the two provinces of Gia Lai
and Dak Lak. Streams that originate in the mountains in the region flow into the Ea H Leo River.
However, these streams are in deciduous dipterocarp forest areas, together with extreme
degradation of the tree layer, they reduce the upstream regulatory function of the forest, shallow
streams in the dry season and make flow strong in the rainy season (This study, 2021)
3.1.2 Socio-economic characteristics at village level
 In this section, information, data is synthesized from the results of collecting and
discussing with groups of key people in the two studied villages.
 The ethnic minorities in the north began to migrate and gather here from 1998 to 2002,
then from 2002 to 2008 the population increased to form a residential area, stable farming and in
2008 officially recognized the administrative units that are Ia Brel and Ia Jol villages.
 The two villages now have many ethnic groups living together (Table 3), mainly ethnic
minorities who have migrated from the North; In which, in Ia Jol village, the Dao ethnic
dominates, while in Ia Brel, the Tay is slightly more than other ethnic groups.

 18
Table 3. Proportion of ethnic groups in the two studied villages
 Id Ethnic Group Ia Brel Village Ia Jol Village
 Number of HH Percent Number of HH Percent
 1 Muong 2 1.4 3 2.9
 2 H Mong 29 19.7
 3 Dao 18 12.2 55 54.5
 4 Nung 29 19.7 15 14.9
 5 Tay 46 31.3 13 12.8
 6 Kinh 14 9.5 15 14.9
 7 Others 9 6.2
 Total 147 100.0 101 100.0
Source: The two village heads of Ia Brel and Ia Jol

 The population in villages of Ia Brel and Ia Jol is 602 and 420 people with 147 and 101
households, respectively. Sketches made by key people showed that people in both villages live
and cultivate alternately and along the inter-village road, about 4- 6 km from National road No.
14 and about 2- 5 km from Olam pepper farm (Figure 2).

 Ia jol Village
 Sketched Ia Jol Village
 Dak Lak province Sketched Ia Brel
 Village

 Go to Ia Brel
 Village

 Dak Lak province

 Go to Olam farm

Figure 2. Participatory sketching of the residential and farming areas of the two studied villages
 According to data kept by the two village heads, the proportion of poor households
according to the multidimensional poverty line (Prime Minister, 2015; Decision No.
59/2015/QD-TTg) was 6.8% and 9.9% in Ia Brel and Ia Jol, respectively (Table 4). Such a
poverty rate is low, so these villages are categorized out of extremely difficult villages (The
extremely difficult village has a poverty household rate of 35% or more (Prime Minister, 2016;
Decision No. 50/2016/QD-TTg))

 19
Table 4. Household economy classified by Government in the two studied villages
 Village Household economy classification

 Poor Percent Near Percent Average Percent Total Percent
 HH poor HH
 HH
 Ia Brel 10 6.8% 23 15.6% 114 77.6% 147 100.0%
 Ia Jol 10 9.9% 14 13.9% 77 76.2% 101 100.0%
 Total 20 8.1% 37 14.9% 191 77.0% 248 100.0%
Source: The two village heads of Ia Brel and Ia Jol

 Regarding public infrastructure, both villages have village halls that are brick-built
houses; about 20% of the main road is made of concrete in the inner village, the rest is dirt road;
Each village has a kindergarten and a branch school at the primary level; There is no medical
station in the village.

 In both villages, there are crops that need watering such as pepper, coffee, and fruit trees.
However, both villages do not have public irrigation systems to irrigate crops, so households
invest themselves to water their crops from wells, ponds, lakes, and streams.
 Most people buy and sell at the central market of Ia Le commune, 8-12 km from the
village. The commune market is quite full of food and consumer goods; Just go to the center of
Chu Pu district to buy agricultural machinery and electronics. The district center is about 20-25
km from the villages.
 With efforts to produce pepper responsibly to the community, and towards attracting
local communities to participate in production in a sustainable landscape, both villages have
been supported by Olam pepper farm with infrastructure such as installing drinking water
filtration system for Ia Brel village, upgrading primary schools in villages Ia Brel and Ia Jol,
repairing community hall in Ia Jol village, installing some streetlights using solar energy roads
in two villages (7-10 lights per village), cooperating with two villages to repair inner-village
roads annually (Figure 3)

 Community Hall of Ia Brel Village Primary School at Ia Brel Village

 20
Road connecting villages Ia Jol and Ia Brel Streetlights using solar energy in Villages of Ia Jol and
 Ia Brel

 Drinking water filtration system in Ia Brel Village
 Figure 3. Rural infrastructure in the two studied villages has been built or/and supported by
 Olam Pepper Farm

3.2 Information and estimated statistics related to household livelihoods
 In this section, based on dataset created from household interviews, reflecting information,
statistical data, estimates related to household livelihood development in the study area.
3.2.1 Statistics of household structure
 Statistical data on the household structure for the two studied villages is presented in Table
5. The statistical results show that the family size of ethnic minority migrant communities is no
longer too large, with an average of 4.6 people / HH. The number of children at school age is
estimated at 446, and the number of children under 2 years of age that need special care is not
much about 25 in both villages.
 The number of male and female workers is quite balanced. Laborers in the families here
are not only working on farm but also off-farm such as hired labor, working for Olam, for the
rubber companies in the region. The number of non-farm workers is more than half of the
workforce in the household. Half of HH members generate income for the family (Table 5).

 21
Table 5. Summary statistics of family structure of the household in the two studied villages
 Count Average Standard Coeff. of Minimum Maximum
 deviation variation
 Number of family members 65 4.6 1.467 32.0% 2 9
 Number of female laborers 65 1.3 0.509 40.3% 1 3
 Number of male laborers 65 1.2 0.625 51.4% 0 3
 Number of elders 65 0.3 0.600 216.6% 0 2
 Number of children 65 1.8 1.156 65.3% 0 5
 Number of children under 2 65 0.1 0.341 369.5% 0 2
 Number of farm working 65 2.1 0.897 42.9% 0 4
 Number of off-farm working 65 1.3 1.108 87.8% 0 5
 Number of members generating income 65 2.5 1.002 40.2% 0 6

3.2.2 Household education
 In terms of education, 10% of the population in Ia Brel village and 30% in Ia Jol village
are illiterate. Since most of them have had to go through a long period of migration, they have
organized farming to settle down and thus cannot go to school. At present, there are several
young people going to college and university, about 2 - 5 people in two villages (Source: Head
of the villages).
 The results of the estimation of the percentage of household heads by educational level
are shown in Figure 4. It shows that up to 26% of the household heads in the two villages are
illiterate. About 30% of household heads have primary education. Thus, nearly 60% of
household heads have low educational level. Such an education level of the household head has
certainly limited the ability to access social information, markets, science and technology for
economic and cultural development for the household. Meanwhile, education is the most
important component to develop sustainable household livelihoods.

 12 (3.23%)
 9 (17.24%)
 0 (22.58%)
 9 (22.58%) 0 (31.03%)

 8 (6.90%)

 1 (3.23%)
 8 (3.23%)
 3 (6.45%)
 1 (3.45%)
 6 (20.69%)
 7 (12.90%) 4 (6.45%) 2 (6.90%)
 3 (3.45%)
 6 (3.23%) 5 (3.45%) 4 (6.90%)
 5 (16.13%)

 Ia Brel village Ia Jol village

 22
12 (1.54%)
 9 (18.46%)
 0 (26.15%)

 8 (4.62%)

 7 (7.69%) 1 (3.08%)
 2 (3.08%)

 3 (6.15%)
 6 (12.31%)
 4 (6.15%)
 5 (10.77%)

 Both villages
 Figure 4. Education levels of the head of household
 Note: 9 (18.46%): the 9th grade in school with estimated 18.46% of HH numbers; If it is 0 that is illiterate

 3 (3.23%)
 1 (13.79%)
 2 (6.45%)

 1 (25.81%)

 0 (64.52%)

 0 (86.21%)

 Ia Brel village Ia Jol village

 3 (1.54%)
 2 (3.08%)

 1 (18.46%)

 0 (76.92%)

 Both villages
 Figure 5. Number of children dropping out of school and percentage of households.
 Note: 0 (76.92) is 0 children dropping out of school with 76.92% of HH numbers

 In both villages, 23% of households have 1-3 children dropping out of school including
children never went to the school; up to 35% of households in Ia Brel village have 1-3 children
dropping out of school, while in Ia Jol it was lower with 14% of households with an average of 1
child dropping out (Figure 5).

 23
Thus, improved education should be made for both the elderly and children in the study
area to ensure sustainable livelihood development.
3.2.3 Health insurance, social insurance, food security of the household
 Between 2016 and 2020, according to Decision No. 50/2016 / QD-TTg (Prime Minister,
2016), the two studied villages have been categorized into the list of the extremely difficult
villages belong to the communes in Ethnic Minority and Mountainous Areas, so health insurance
was free for all family members. According to statistics, 93.8% of households have had this type
of health insurance in recent years.
 However, by 2021, the villages have escaped from the list of extremely difficult villages,
so they will no longer receive the 100% health insurance subsidy as before; but people must pay
½ of the health insurance fees. As a result, many households have not yet participated in this new
health insurance.
 Meanwhile, social insurance is even a new topic for urban residents who do not work for
the state or private sector, so it is strange to farmers. Recently, the state introduced a program to
buy voluntary social insurance among people. Its benefits are that people who do not work for
the state or private companies with social insurance contributions, such as farmers, will receive
100% of their pension and health insurance upon retirement. In the studied villages, there are a
few number of Village Heads, Village Vice Heads, Party Secretaries, Leaders of unions
participating in voluntary social insurance; usually pay the minimum fee of 138,000 VND /
month; meanwhile, almost no farmers are involved.
 Up to 14/65 (21.5%) HH interviewed lack food in some years, usually 2 - 3 months;
Often these are poor households, lacking basic livelihoods such as insufficient land, many sick
family members, low education, etc. The solution of these households is often to borrow hot
loans from the fertilizer and pesticide suppliers in the area. They pay high interest through
agricultural products when they are harvested.
 In terms of nutrition for children under 2 years old, through interviews, there is no major
problem; Children are often given priority in nutrition despite being poor.
3.2.4 Drinking and domestic water of the household
 Drinking water and domestic water are issues of concern in the study area; Because this
is the area of natural water such as wells, lakes, rivers and streams that are often contaminated
with lime and alum.
 The drinking water sources of HH were categorized according to WHO/UNICEF (2018)
presented in Table 6. Thanks to Olam's water filtration system, 74% of households in Ia Brel
village and 21% of households in Ia Jol village have clean drinking water. Meanwhile, up to
25% of households do not have access to clean water, so they must buy bottled water to drink,
usually those who are far from Olam's filtered water. 100% of Olam workers' families use dug
water at their home for drinking; meanwhile Olam workers take drinking water from the piped
water situtated inside the farm.

 24
Table 6. Categorizing drinking water sources of the households according to WHO/UNICEF
 (2018)
 Village/Object Source of drinking water
 Piped water (Olam) Dug water Packaged Total
 water
 Ia Brel 74% 16% 10% 100%
 Ia Jol 21% 34% 45% 100%
 Surrounding Farmers 20% 60% 20% 100%
 Olam Worker Famillies 0% 100% 0% 100%
 Total 45% 30% 25% 100%
Note: % is Percentage of households

 According to statistics, about 30% of households use self-filtered or unfiltered well water
for drinking. Therefore, about 26/65 households interviewed (40% of households) suffer from
intestinal disease, diarrhea every year or a few years, which may be due to unsanitary drinking
water sources.
 The domestic water source of the households is classified according to WHO / UNICEF
(2018), shown in Table 7, which is mainly from two sources of dug water and pond. Dug water
is often contaminated with lime, alum, and pond water is often not hygienic. Most households
(97%) use dug water, 4.6% lack domestic water due to dry wells in the dry season.
Table 7. Categorizing domestic water sources of households according to WHO/UNICEF (2018)
 Village/Object Source of domestic water Total
 Dug water Pond
 Ia Brel 97% 3% 100%
 Ia Jol 97% 3% 100%
 Surrounding Farmers 100% 0% 100%
 Olam Workers 100% 0% 100%
 Total 97% 3% 100%
Note: % is Percentage of households

3.2.5 Household housing
 The statistical results show that about 60% of households have wooden houses, the rest
are brick houses, some households have temporary houses (
Table 8. Percentage of households by housing type
 Village Temporary Wooden house Brick house Total
 house
 Ia Brel 6.5% 61.3% 32.3% 100.0%
 Ia Jol 0.0% 62.1% 37.9% 100.0%
 Surrounding farmers 20.0% 60.0% 20.0% 100.0%
 Workers of Olam farm 0.0% 0.0% 100.0% 100.0%
 Total 4.5% 59.7% 35.8% 100.0%

3.2.6 Use of electricity and other energy
 The national electricity grid was established in this area since 2011, people live along the
inter-village axis, so most households use electricity; It is estimated that both villages have more
than 93% of households using electricity from the grid. The number of households that do not
have access to the electricity connection mainly in Ia Brel village accounts for about 13% of total
households in which 10% use solar energy for the light. The households do not have grid
electricity because they live on the fields far from the village and commune/village roads.
 There is almost no public lighting system on rural roads, only a few solar-powered lights
on the main road are installed by Olam in two villages.
3.2.7 Sanitation and sewage system of the household
 Statistics on the percentage of households with toilets categorized according to WHO /
UNICEF (2018) are presented in Table 9. It shows that about 27% of households have hygienic
toilet (flush / pour flush); about 36% of household have relatively hygienic latrines (dry pit), the
rest 36% do not have a facility (bush/field). Olam's workers are guaranteed to have hygienic
toilets in the workplace.
 In Ia Brel village, there are 62 households (42% of households), Ia Jol has 31 households
(31% of households) that do not have a toilet (No facility / Bush / Field). Not making toilets here
is more related to community living habits than not having enough money; In fact, it is observed
that some households build large houses with good materials as the house in the urban but did
not build toilets.
 There are almost no public toilets in the village, only one dry pit latrine funded by Olam
is built in the village hall area.
 Like many rural mountainous areas in Vietnam, there is no domestic wastewater
treatment system; Therefore, domestic wastewater has polluted rivers, streams, ponds and lakes
in the area. Nearly 100% of households do not have sewage system.
 Table 9. Percentage of households by toilet category according to WHO / UNICEF (2018)
 Village Flush / pour Dry pit Composting No facility / Total
 flush latrines toilets Bush/Field
 Ia Brel 29% 29% 0% 42% 100%
 Ia Jol 17% 48% 3% 31% 100%
 Surrounding farmers 40% 20% 0% 40% 100%
 Workers of Olam farm 100% 0% 0% 0% 100%
 Total 27% 36% 1% 36% 100%

 26
3.2.8 Communication information
 Modern communication technology has now reached remote villages, including fiber-
optic Internet, Smartphone 3-4 G and Television. In the surveyed area, up to 10.7% of
households connect to high-speed cable Internet, 78.5% of households use Smartphone 3-4 G to
connect internet and 70-100% of households have television.
 The connection to the internet, in addition to entertainment, also helps farmers to access
socio-economic information, general science and technology. Farmers have in fact been on the
internet to learn how to solve the production and life problems they face.
 However, in terms of supporting agricultural and forestry production, information on the
internet is limited, sometimes inaccurate, advertising from seeds, fertilizers, pesticides providers,
... makes farmers difficult to choose the correct information.
3.2.9 Social unions and household participation
 Civil society organizations (CSO) that have not yet approached mountainous rural areas,
so the activities are mainly from social unions such as the Farmers' Union, Women's Union, and
Veterans Association.
 Households participating in the Women's Union have some benefits such as supporting
women to get loans from the Union, and women participating in social work. Joining Farmers'
Association also helps households get more production information and technical advances. 65%
of households have members who join these social unions.
 Participation in social organizations and activities is an important component of
household livelihoods, providing opportunities for farmers to have a voice, access to socio-
economic development policies and reflect their aspirations.
 However, these unions in practice have not brought real and effective benefits in rural
mountainous development, improving household livelihoods, but mainly in administrative
activities.
3.2.10 Household income level by income per capita
 It is forecasted that when applying the new multidimensional poverty line in the period
2022 – 2025 (Prime Minister, 2021, Decree No. 07/2021 / ND-CP), the number of poor
households will increase because indicators of the income per capita / month will be higher at 1.5
million VND. It is forecasted that the number of households that cannot reach this indicator will
become poor households in the two villages at over 45 % (Table 10). Meanwhile, these two
villages currently have poor households below 10% (Table 4) according to the current
multidimensional poverty line with income per capita / month lower than 0.7 Million VND for
the poor HH (Prime Minister, 2015; Decision No. 59/2015 / QD-TTg)
 Table 10. Rate of Household Income Levels based on Income Per Capita
 HH income level based on income per capita per month in Mil. VND
 Village < 1.5 (Below 1.5 – 2.25 (At average > 2.25 (Above Total
 minimum income income indicator) average income
 indicator) indicator)
 Ia Brel 45% 26% 29% 100%
 Ia Jol 45% 28% 28% 100%
 Total 45% 27% 28% 100%

 27
You can also read