Sowerby Housing Needs Assessment - (HNA) - Calderdale Council
←
→
Page content transcription
If your browser does not render page correctly, please read the page content below

Sowerby
Housing Needs Assessment
(HNA)

March 2018

Sowerby HNA                                                                                                   2

Quality information
Prepared by                        Checked by                           Approved by

Guillaume Rey – Graduate           Ivan Tennant – Principal Planner     Stuart Woodin
Planning Intern                                                         Technical Director

Revision History
Revision           Revision date   Details              Authorized    Name                   Position

1                  January 2018    Research and         GR            Guillaume Rey          Graduate Planner
                   February 2018   drafting

2                  February 2018   Internal review      IT            Ivan Tennant           Principal Planner

3                  March 2018      Technical review     ST            Stuart Woodin          Technical Director

4                  March 2018      Group comment        SR            Samantha Roberts       Chair, Sowerby
                                                                                             Neighbourhood
                                                                                             Plan Forum

                                                                                                        AECOM
Sowerby HNA                                                                                               3

Prepared for:
Sowerby Neighbourhood Forum

Prepared by:

AECOM
Aldgate Tower
2 Leman Street
London
E1 8FA
aecom.com

© 2018 AECOM. All Rights Reserved.

This document has been prepared by AECOM (“AECOM”) for sole use of our client (the “Client”) in accordance
with generally accepted consultancy principles, the budget for fees and the terms of reference agreed between
AECOM and the Client. Any information provided by third parties and referred to herein has not been checked or
verified by AECOM, unless otherwise expressly stated in the document. No third party may rely upon this
document without the prior and express written agreement of AECOM.

                                                                                                    AECOM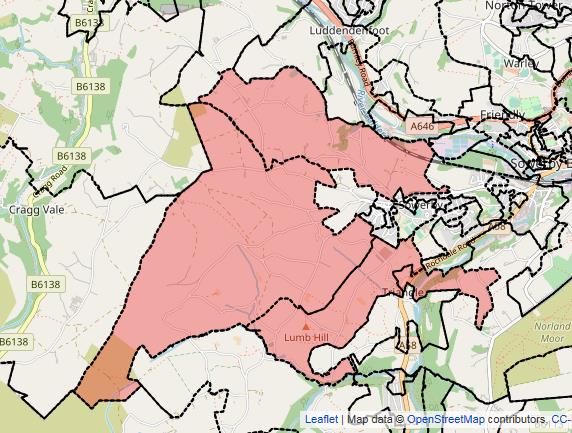
Sowerby HNA                                                                                                                                                     4

Table of Contents
1.     Executive Summary .................................................................................................................................. 1-7
       1.1       Headlines....................................................................................................................................... 1-7
       1.2       Introduction .................................................................................................................................... 1-7
       1.3       Summary of Methodology .............................................................................................................. 1-7
       1.4       Quantity of Housing Needed .......................................................................................................... 1-8
       1.5       Recommendations for next steps ................................................................................................ 1-11
2.     Context ...................................................................................................................................................... 15
       2.1       Local context .................................................................................................................................. 15
       2.2       Census Geography Areas............................................................................................................... 16
       2.3       Planning policy context ................................................................................................................... 17
3.     Approach ................................................................................................................................................... 19
       3.1       Research Questions ....................................................................................................................... 19
       3.1.1 Quantity .......................................................................................................................................... 19
       3.1.2 Tenure............................................................................................................................................. 19
       3.1.3 Type and Size ................................................................................................................................. 19
       3.1.4 Housing for Specialist Groups ........................................................................................................ 19
       3.2       Study Objectives ............................................................................................................................. 20
       3.3       Relevant Data ................................................................................................................................. 20
       3.3.1 SHMA ............................................................................................................................................. 20
       3.3.2 Other relevant data (from LPA or NP group, e.g. housing survey) .................................................. 21
4.     RQ1: What quantity of Housing in the Plan Area is appropriate over the Plan period? .............................. 22
       4.1       Calderdale Local Plan Initial Draft July 2017 (2017-2032) .............................................................. 22
       4.2       Shaping the Housing Future of Calderdale SHMA November 2015 (2012-2033) ........................... 22
       4.3       MHCLG Household Projections ...................................................................................................... 23
       4.4       Dwelling growth 2001 – 2011 .......................................................................................................... 23
       4.5       Dwelling growth since 2011 ............................................................................................................ 24
       4.6       Dwelling growth 2001-2017 ............................................................................................................ 24
       4.7       The Standard Methodology ............................................................................................................ 24
       4.8       Conclusion ...................................................................................................................................... 25
5.     RQ2: What type of affordable housing (social housing, affordable rented, shared ownership,
       intermediate rented) should be included in the housing mix? .................................................................... 26
       5.1       Introduction ..................................................................................................................................... 26
       5.1.1 Definitional issues ........................................................................................................................... 26
       5.1.2 Current tenure profile ...................................................................................................................... 27
       5.2       Indicators of Affordable Housing needs .......................................................................................... 28
       5.2.1 Affordability ..................................................................................................................................... 28
       5.2.1.1 Affordability Ratio............................................................................................................................ 28
       5.2.1.2 Income and Purchase Threshold .................................................................................................... 32
       5.2.2 Housing Waiting List ....................................................................................................................... 36
       5.2.3 Households in unsuitable housing .................................................................................................. 37
       5.3       Bringing the evidence together: Tenures of housing needed .......................................................... 37
       5.3.1 Housing tenure ............................................................................................................................... 37
       5.3.2 Social rented housing ..................................................................................................................... 38
       5.3.3 Discounted market housing (starter homes) ................................................................................... 38
       5.3.4 Shared ownership ........................................................................................................................... 39
       5.3.5 Affordable rent ................................................................................................................................ 40
       5.3.6 Market housing ............................................................................................................................... 40
       5.3.7 Built to rent ..................................................................................................................................... 40
       5.3.8 Conclusion ...................................................................................................................................... 40
6.     RQ3: What type (terrace, semi, bungalows, flats and detached) and size (number of habitable
       rooms) of housing has the best potential to meet local needs? ................................................................. 42

                                                                                                                                                       AECOM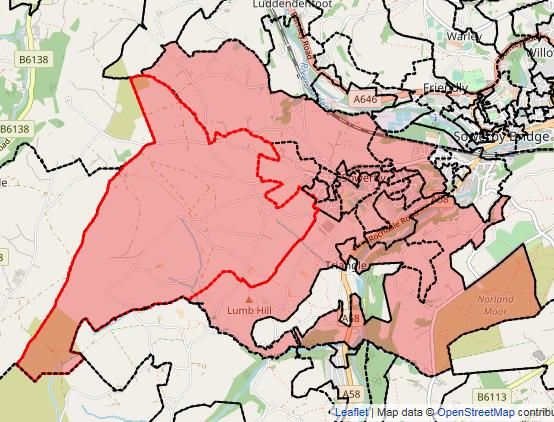
Sowerby HNA                                                                                                                                                    5

       6.1       Background and Definitions ............................................................................................................ 42
       6.2       Current Type and Size profile ......................................................................................................... 43
       6.2.1 Dwelling Type ................................................................................................................................. 43
       6.2.2 Dwelling Size .................................................................................................................................. 44
       6.3       Factors affecting size and type of housing needed ......................................................................... 46
       6.3.1 Age Structure.................................................................................................................................. 46
       6.3.2 Household Composition.................................................................................................................. 48
       6.4       Bringing the evidence together: Market Segmentation ................................................................... 50
       6.4.1 Arrows Analysis .............................................................................................................................. 51
7.     RQ4: What provision should be made for specialist affordable housing for the elderly within the NA?...... 53
       7.1       Sheltered and extra-care housing ................................................................................................... 53
       7.2       Retirement villages ......................................................................................................................... 55
       7.3       Senior Co-housing .......................................................................................................................... 55
       7.4       Multi-generational homes ............................................................................................................... 55
       7.5       Lifetime Homes ............................................................................................................................... 55
       7.6       Right-sizing ..................................................................................................................................... 56
       7.7       Planning flexibility ........................................................................................................................... 56
       7.8       Lifetime neighbourhoods ................................................................................................................ 56
       7.9       Age-friendliness .............................................................................................................................. 56
       7.10      Housing for people with Dementia .................................................................................................. 57
       7.11      The role of the Local Authority ........................................................................................................ 58
8.     Market Signals ........................................................................................................................................... 58
       8.1       Employment and Commuting ......................................................................................................... 58
       8.2       Housing Market (Prices) ................................................................................................................. 60
       8.3       Housing Market (Transactions) ....................................................................................................... 62
       8.4       Migration ......................................................................................................................................... 63
       8.5       Overcrowding and Concealment .................................................................................................... 64
       8.6       Rate of Development ...................................................................................................................... 65
9.     Conclusions ............................................................................................................................................... 66
       9.1       Overview......................................................................................................................................... 66
       9.2       Recommendations for next steps ................................................................................................... 70

                                                                                                                                                      AECOM
AECOM                                                                                                1-6

List of acronyms used in the text:

AH               Affordable Housing (NPPF definition)

AMH              Affordable Market Housing

eLP              Emerging Local Plan

HLIN             Housing Learning and Improvement Network

HMA              Housing Market Area

HNA              Housing Needs Assessment

LHA              Local Housing Allowance

LPA              Local Planning Authority

LQAR             Lower Quartile Affordability Ratio

MAR              Median Affordability Ratio

MBC              Metropolitan Borough of Calderdale

MHCLG            Ministry of Housing, Communities and Local Government, formerly Department for Communities and
                 Local Government (DCLG)

NDP              Neighbourhood Development Plan

NFH              Newly Forming Households

NA               Neighbourhood Plan Area

NPPF             National Planning Policy Framework

OAN              Objectively Assessed Needs

ONS              Office for National Statistics

PPG              Planning Practice Guidance

PRS              Private Rented Sector

QB               Qualifying Body

RCUDP            Replacement Calderdale Unitary Development Plan

SHLAA            Strategic Housing Land Availability Assessment

SHMA             Strategic Housing Market Assessment

SHMA15           Calderdale Strategic Housing Market Assessment 2015

SMAHN            Standard Methodology for Assessing Housing Need

SNPF             Sowerby Neighbourhood Plan Forum

                                                                                                AECOM
AECOM                                                                                                               1-7

1.           Executive Summary
1.1          Headlines
1.      Shared ownership and other affordable forms of homeownership and affordable renting, including social renting,
        have a significant role to play in meeting locally expressed needs, particularly given the relatively high levels of social
        renting in the village in comparison with the borough.

2.      There is likely to be a significant need for small and medium sized housing of 2-3 bedrooms in the future, with these
        most appropriately provided via the provision of semi-detached and terraced houses.

3.      There is a need for additional specialist housing for the elderly in the plan area totalling 13 units over the Plan period,
        which should be of sufficient size to make a small dedicated scheme feasible.

1.2          Introduction
4.      Sowerby Neighbourhood Planning Forum (SNPF) is designated as a Qualifying Body (QB) and has decided to
        prepare a Neighbourhood Plan for Sowerby, referred to here as the Neighbourhood Plan Area (NA). The 2011
        Localism Act introduced neighbourhood planning, allowing parishes, town councils or neighbourhood forums across
        England to develop and adopt legally binding development plans for their neighbourhood area. We have been asked
        to prepare a Housing Needs Assessment (HNA) by the NPPF, based on a robust methodology, local data, and
        focussed on a number of research questions agreed with the NPPF.

5.      As more and more towns and parish councils and forums seek to address housing growth, including tenure and type
        of new housing, it has become evident that developing policies need to be underpinned by robust, objectively
        assessed housing data.

6.      In the words of the national Planning Practice Guidance (PPG), establishing future need for housing is not an exact
                                                                        1
        science, and no single approach will provide a definitive answer . The process involves making balanced judgements
        based on the qualitative and statistical evidence gathered as well as having regard for relevant national and local
        planning policies and guidance.

7.      At a neighbourhood planning level, one important consideration is determining the extent to which the neighbourhood
        diverges from the local authority average, reflecting the fact that a single town, village, or neighbourhood almost
        never constitutes a housing market area on its own and must therefore be assessed in its wider context.

8.      The guidance quoted above on housing needs assessment is primarily aimed at local planning authorities preparing
        Strategic Housing Market Assessments (SHMA), which are used to determine housing need at a local authority level.
        However, it helpfully states that those preparing neighbourhood plans can use the guidance to identify specific local
        needs that may be relevant to a neighbourhood, but that any assessment at such a local neighbourhood level should
        be proportionate.

9.      Our brief was to advise on data at this more local level to help Sowerby Neighbourhood Plan Forum (SNPF)
        understand the tenure, type, and size of housing needed to inform neighbourhood plan policies.

1.3          Summary of Methodology
10. HNA at neighbourhood plan level can be focused either on the quantity of housing needed, type of housing needed,
    or both. In most cases, there is a need to focus on the quantity where the housing target for the settlement being
    assessed is unclear, for example where the local authority has not set a specific target for the settlement, or where
    there is no local plan in place.

11. In the case of Sowerby, the emerging Local Plan (eLP) for the Metropolitan Borough of Calderdale (MBC) gives a
    figure of 390. However, that target refers to an area larger than the NA. In this context, the task of this HNA will be to
    arrive at a housing target for the settlement and see how it compares to the target given by the MBC. It will then
    consider what types, tenures and sizes of housing are needed by the local population living in Sowerby.

12. The rationale for this approach is that neighbourhood plans need to meet the basic conditions, the fulfilment of which
    is tested through an independent examination. One of these, Basic Condition E, requires the Neighbourhood Plan to
    be in ‘general conformity with the strategic policies’ of the Local Plan. The Government’s Planning Practice Guidance

1
    PPG Paragraph: 014 Reference ID: 2a-014-20140306 Revision date: 06 03 2014

                                                                                                              AECOM
AECOM 1-8
2
indicates that the level of housing development is likely to count as a strategic policy. As such, this HNA investigates
specific local needs that are relevant to the neighbourhood whilst supporting the strategic development needs set out
in the emerging local plan. This means a neighbourhood plan can propose more housing where there is a
demonstrable need, but not less than the Local Plan.
13. Regarding the types of housing needed, there is generally more flexibility on what neighbourhood plans can cover.
Indeed, the emerging local plan makes clear that evidence from the Calderdale Strategic Housing Market
Assessment 2015 (SHMA15) should inform local and neighbourhood housing mix.
14. In order to understand the types of housing needed in Sowerby we have gathered a wide range of local evidence
and summarised it into policy recommendations designed to inform decisions on housing characteristics.
15. This objective and independent housing needs advice note follows the PPG approach where relevant. This ensures
our findings are appropriately evidenced. The PPG advises that assessment of development needs should be
thorough but proportionate and does not require planners to consider purely hypothetical future scenarios, only future
scenarios that could be reasonably expected to occur.
16. Our approach is to provide advice on the housing required based on need and/or demand rather than supply. This is
in line with the PPG, which states that ‘the assessment of development needs should be an objective assessment of
need based on facts and unbiased evidence. Plan makers should not apply constraints to the overall assessment of
need, such as limitations imposed by the supply of land for new development, historic under performance, viability,
3
infrastructure or environmental constraints.’
17. For this reason, we advise that the conclusions of this report should be assessed against supply-side considerations
(including, for example, factors such as transport infrastructure, landscape constraints, flood risk and so on) as a
4
separate and follow-on exercise.
1.4 Quantity of Housing Needed
18. Our assessment of a wide range of data sources identified four separate projections of dwelling numbers for
Sowerby between 2017 and 2032 based on:
The emerging Local Plan (eLP), which generates a target of 253 dwellings over the Plan period between
2017 and 2032 or 17 dwellings (rounded) per annum.
5
A ‘proportionate share’ derivation from the SHMA15, Objectively Assessed Need (OAN); total of 317
dwellings over the Plan period between 2012 and 2033 (rounded), or 15 dwellings per annum;
MHCLG Household Projection of 265 dwellings (rounded) between 2011 and 2032, or 13 dwellings per
annum;
A projection forward of net dwelling completion rates 2001-2017 gives 123 dwellings over the Plan period or
8 dwellings per annum.
19. These dwelling number projections are illustrated in Figure 1-1 on the following page.
2
PPG Paragraph: 006 Reference ID: 2a-006-20140306
3
See Planning Practice Guidance, Paragraph: 004 Reference ID: 2a-004-20140306 Revision date: 06 03 2014
4
Such an approach, clearly separating housing need assessment from dwelling capacity assessment, was endorsed by the Government
for calculating housing need at local authority level in the ministerial statement and press release ‘Councils must protect our precious
green belt land’ (MHCLG, 4 October 2014, available at https://www.gov.uk/government/news/councils-must-protect-our-precious-green-
belt-land)
5
The OAN includes the baseline demographic need, plus any adjustments made to official forecasts to account for projected rates of
household formation post 2021, past suppression of the formation of new households, the effect of past under-supply, employment
forecasts, market signals and affordable housing need (as set out in paragraph ID2a-004 of the NPPG).
AECOM
AECOM                                                                                                        1-9

     Figure 1-1: Dwelling projections for the Sowerby NA, 2017-2032

                     Local Plan
                     SHMA(derived)
                     DCLG Household Projections-derived
                     Dwelling completions 2001-2016 derived
                     OAN Calculation
                     Dwellings apportioned by the MBC

     2,000

     1,900

     1,800

     1,700

     1,600

     1,500

     1,400

     1,300
                        2001                       2011                      2017                       2032
     Source: AECOM Calculations

20. The graph above sets out the total number of homes factoring in each of the projections we have identified in
    Sowerby. So, for example, factoring in MHCLG derived data (orange line) to the number of dwellings that have
    already been built in the NA between 2011 and 1st January 2017 (16), produces a total requirement that there should
    exist in the NA 1,826 homes by the end of the Plan period (adding together existing dwellings, and new homes that
    are required to be built).

21. The starting point to arrive at an overall projection for housing numbers to be delivered in the NA over the Plan period
    is to calculate the average of the four projections set out above; we depart from this approach if we have reason to
    believe a given projection should be awarded more weight than others, or should be excluded. For example, if the
    Local Plan was out of date in planning terms, or another was a clear outlier.

22. In the case of Sowerby, we decided to discount the dwelling completions derived number from the overall projection,
    as low levels of delivery in recent years would produce a significantly lower overall projection. Therefore the initial
    housing projection for the town is 273 dwellings or 18 dwellings per annum over the Plan period, to which we need to
    apply market signals (for example the economic context in which the NA sits, together with the performance of the
    housing market) are likely to impact on it.

23. In Table 1-1 on the following page we have applied our professional judgment on the scales of increase and
    decrease associated with each factor on a scale from one to three, where one arrow indicates ‘some impact’, two
    arrows ‘stronger impact’ and three arrows indicates an even stronger impact. The factors set out are in alphabetical
    but no other order.

24. The research suggests that there is evidence to support a significant uplift to housing need on the basis of an
    accumulated under-delivery in Sowerby and the fact that more than 58% of households cannot meet their housing
    needs. On this basis, we would recommend an uplift of 20% to the housing need figure. As a result, we make a
    recommendation of between 278-334 dwellings for 2018-2032.

                                                                                                        AECOM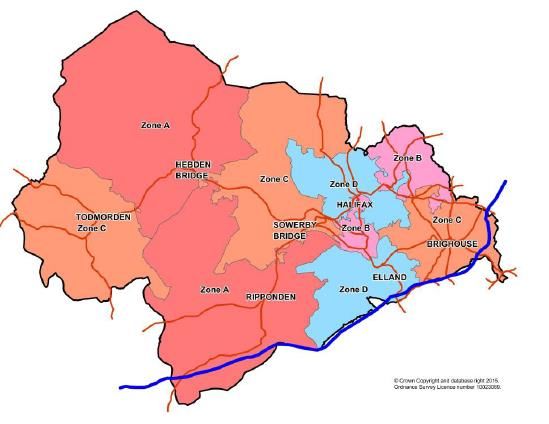
AECOM 1-10
Table 1-1: Summary of factors specific to Sowerby with a potential impact on neighbourhood plan
housing quantity
Factor Source(s) (detailed in Chapter 8) Possible impact on Rationale for judgement
future housing need
Employment and Census 2001/2011, DataShine Although there is a limited expected growth
Commuting Commute’ accessed at: within the NA itself, the growth of Halifax is
http://commute.datashine.org.uk likely to have an impact on Sowerby in terms
of demand for housing as it has been shown
that most of residents commute to Halifax.
Therefore one up arrows were deemed
appropriate.
Housing Sales (Prices) Land Registry Price Paid Data for Prices are lower than the borough average,
2007-2016 with the exception of terraced housing. We
have deemed one up arrow appropriate to
account for that higher price for terraced
housing, which suggests a strong demand for
that type.
Housing Sales (Volume) Land Registry Price Paid Data for There is a discrepancy between the number
2007-2016, Census 2001/2011 of housing typologies sold and the level in the
data, existing stock. The imbalance suggests
increasing demand for terraced and semi-
detached dwellings, while very few flats are
being sold compared to the stock. We have
therefore used a neutral arrow to account for
the potential demand for medium-sized
dwellings along with a decreasing demand for
smaller and very large properties.
Migration Census Data 2001, 2011 Migration is not seen as a significant factor in
determining housing need.
Overcrowding and Census Data 2001, 2011 Although there is some evidence of
Concealment overcrowding and concealed families in
Sowerby, these are not deemed particularly
significant given the levels seen in the MBC
as a whole.
Rate of development Land Registry Data/AECOM The LPA has significantly under-delivered
Calculations against HMA targets during the past five
years. Therefore it is reasonable to suggest
three up arrows to account for the
accumulated under-delivery.
AECOMAECOM 1-11
1.5 Recommendations for next steps
25. This neighbourhood plan housing needs advice has aimed to provide Sowerby with evidence on housing trends from
a range of sources. We recommend that the Neighbourhood Forum should, as a next step, discuss the contents and
conclusions of this report with the Metropolitan Borough of Calderdale (MBC) with a view to reaching a shared
understanding on the implications and way forward for the neighbourhood plan, bearing the following in mind:
the recommendations and findings of this study;
Neighbourhood Planning Basic Condition A, that it has regard to national policies and advice contained in
guidance issued by the Secretary of State; Condition D, that the making of the neighbourhood plan
contributes to the achievement of sustainable development; and Condition E, which is the need for the
neighbourhood plan to be in general conformity with the adopted strategic development plan;
the views of MBC – in particular in relation to the housing need figure that they think appropriate;
the views of local residents;
the views of other relevant local stakeholders, including housing developers; and
the numerous supply-side considerations, including local environmental constraints, the location and
characteristics of suitable land, and any capacity work carried out by the MBC, including but not limited to
the SHLAA; and
The impact of the new Government proposed standard methodology on calculating housing need on the
borough and its neighbourhoods.
26. Recent changes to the planning system, forthcoming changes to the NPPF, as well as the implementation of the
Housing and Planning Act 2016, will continue to affect housing policies at a local authority and, by extension, a
neighbourhood level.
27. This advice note has been provided in good faith by AECOM consultants on the basis of housing data and national
guidance current at the time of writing (alongside other relevant and available information).
28. Bearing this in mind, we recommend that the steering group should monitor carefully strategies and documents with
an impact on housing policy produced by the Metropolitan Borough or any other relevant body and review the
neighbourhood plan accordingly to ensure that general conformity is maintained.
29. At the same time, monitoring on-going demographic or other trends over the period in which the neighbourhood plan
is being developed (factors summarised in Table 1-2 would help ensure relevance and credibility of its policies.
Table 1-2: Summary of local factors specific to Sowerby with a potential impact on
neighbourhood plan housing type
Factor Source(s) (see Possible impact on housing needed Conclusion
Chapter 3)
Demographic Ageing did not seem to affect Sowerby as Consequently, we would highlight the
change much as Calderdale and England during the necessity to not only provide for an ageing
inter-censual period; the proportion of population but also to provide sufficient
residents aged 85+ has indeed decreased market and affordable housing to
when it has increased in other places. encourage young people to stay in the
area, but also to attract people to provide
It should also be noted, however, that the NA local businesses with the workforce they
has a significantly high proportion of retired need to deliver economic growth.
residents which is projected to increase. This
will create a shortage of the labour force.
Among projected changes, one person and
couples will make up the majority of
household increase, and the majority of those
are likely to be retired or households nearing
the age of retirement.
Finally there will be less families and newly
AECOMAECOM 1-12
forming households.
Affordable Housing The Lower Quartile Affordability Ratio (LQAR) Owner occupation has been the dominant
for Sowerby was 7.64 in 2017 respectively. trend in tenure; however, as we have
seen, this tenure is beyond the means of
This compares with a LQAR for Calderdale of the vast majority of households; planners
around 4.59 in 2016. should therefore encourage others to
come forward, such as shared equity,
This data suggests entry level dwellings are
starter homes and private rented sector.
relatively unaffordable in Sowerby compared
with the district generally. Affordability issues will be exacerbated by
the reported increase in house prices in
Based on properties currently being marketed
the area in recent years. Moreover, in
(February 2018), and taking into account
order to address demographic trends that
house price data in Land Registry, an entry-
have seen a decline in those aged
level dwelling is estimated to cost £98.375. At
between 25-44 and forecast loss of
this price point, using CACI data on
people of working age it is appropriate for
household income, around 58% of all
social rented housing to form the majority
households are unable to afford to purchase a
of affordable homes provided.
dwelling of this type.
Sowerby should seek build to rent (BTR)
As regards access to the private rental development, a percentage of which may
market, around 58% of all households are be ‘intermediate rented housing’
unable to access entry-level type dwellings for addressing the need for affordable market
rent as the current rental market in Sowerby is housing for younger age groups.
currently more expensive; given this is
supposedly the most affordable open market Social housing is already a substantial
tenure, we can conclude that 58% of tenure within the NA, however, that level
households are unable to access housing should be increased to meet the needs of
suited to their needs, given their household those who cannot afford market housing.
composition, without subsidy. As not everyone can apply to social
housing, the PRS has a potential role to
The Housing Waiting List data provided by the play. The lack of PRS (and its
MBC suggests there are 102 households are unaffordability) and of Intermediate
in priority need in the NA. Housing, should be tackled to meet the
needs of those who earn too much to be
The SHMA suggests that affordability issues
eligible for social housing, but do not earn
may drive an increase in concealed
enough to afford market housing at the
households and dampen new household
current price level.
formation; concealed households and
household composition data, which indicates
an increase in the number of households with
non-dependent children over the inter-censual
period, provides some evidence of this in
Sowerby.
Tenure of housing The current housing stock exhibits the There is evidence of a need for more
dominance of owner-occupation, and an affordable housing, with an emphasis of
important growth of PRS. facilitating access to homeownership to
households who are forced into the PRS.
Based on the current income distribution
and evidence gathered earlier, a
distribution of the following housing
tenures is recommended:
53.8% (55 to 60%) Social rented
21.6% Intermediate
24.6% Market Housing (mainly
privately rented)
AECOMAECOM 1-13
Dwelling type Linked to homes being relatively large in Terraced and semi-detached dwellings
Sowerby, 30% of all housing is detached. seem particularly appropriate to satisfy the
demand for smaller dwellings.
Although terraced-dwellings have decreased
by 6% between 2001 and 2011, their price is
high compared to the rest of the borough,
which suggests a strong demand for that type.
Demand/need for During the inter-censual period, there was aPolicy should address the needs of
smaller dwellings significant growth in the number of couples concealed households through the
without children and one-person households. provision of smaller, affordable market
dwellings as well as AH so as to
Childless couples and one person households encourage household formation rates,
constitute 18.6% and 29.8% (most important and stem the decline of the local working
group) of the population respectively. age population.
Single person households have recorded the In terms of size of dwellings, the trends
greatest uplift in numbers, at 77.8% over the identified point towards a mix of smaller
inter-censual period. dwellings and family sized homes, of 2-5
habitable rooms.
The growth of non-dependent children
households points to depressed household
formation rates, a finding supported by the
small, but statistically significant, presence of
concealed households in the area (9 at the
time of the last census).
A truer picture of ‘concealed households’ can
be seen in data for households with non-
dependent children. For Sowerby, at the time
of the last Census, 10.5% of all households
fell into this type against 8.6% in the borough,
160 households, suggesting the phenomenon
of adult children living with their parents is not
uncommon in the NA.
Family-sized Families with children made up the second This current housing stock exhibits a
housing largest group in Sowerby at 27.4% of the ‘family-oriented’ neighbourhood. However,
population in 2011. in light of recent demographic shifts, this
orientation is declining and adding family-
The current housing stock exhibits the sized housing to the stock would be
dominance of larger dwellings between 4 and inappropriate.
7 rooms.
Notwithstanding these trends, The
There was an increase of almost 60% of 7 evidence of decline of the economically
room dwellings between 2001 and 2011. active population suggests the overall loss
of working age households. The objective
should be to maintain Sowerby as a
working as well as retired community, able
to sustain the businesses, services and
facilities essential to thriving community
life. This can be done through prioritising
the needs of families, firstly so as to retain
a balanced population in future years, but
also so as to capitalise on the area’s
natural appeal to them.
Housing for The 2014-based subnational population Although the population is not ageing as
independent living projections suggest an increase of 178.46% of quickly as the rest of the nation or the
the resident aged 85 and over. Although MBC, there will be a need to provide for
AECOMAECOM 1-14
for older people during the inter-censual period ageing was the increase of older residents in the NA.
less important than in the MBC, by the end of
the Plan period, the elderly population in this Working from the recommended number
age group will form a substantial part of the of specialist dwellings for each 1000
population of Sowerby, even more than in people aged 75+ put forward by the
Calderdale. Housing LIN the following provision
should be provided over the Plan period:
Projections, using the LIN method, suggest an
2 additional conventional
increase of 31 residents aged 75+ in the next sheltered housing units
15 years. 4 additional leasehold sheltered
housing units
1 additional ‘enhanced’ sheltered
units, split 50:50 between those
for rent and those for sale
0 to 1 additional extra care
housing units for rent
1 additional extra care housing
units for sale
0 additional specialist dementia
care homes
AECOMAECOM 15
2. Context
2.1 Local context
30. Sowerby is one of the oldest villages in Yorkshire and is found in the Metropolitan Borough of Calderdale in
West Yorkshire, England. It lies in the Pennine Hills and is contiguous with Sowerby Bridge. The village is
located 3.7 miles west-southwest of Halifax and 7.6 miles west-northwest of Huddersfield. The A58 links
Sowerby to Leeds, 21.4 miles northeast and the M62 links the village to Manchester, 26.6 miles southwest.
31. The NA designated by Metropolitan Borough of Calderdale corresponds more or less to that northern part of
the Ryburn Ward, (Figure 2-1) which is not included in the Ripponden Parish (Figure 2-2).
Figure 2-1: North of Ryburn Ward Figure 2-2: North of Ripponden Civil Parish
Sowerby
Sowerby
Source: Ordnance Survey Source: Ordnance Survey
32. Looking at natural boundaries, the rivers Calder and Ryburn roughly constitute the NA’s northeast and
southeast borders, while its western border runs along small roads going through the rural farming area
located west of the village.
Figure 2-3: Sowerby Neighbourhood Area
Source: Calderdale Council
AECOMAECOM 16
2.2 Census Geography Areas
33. The NA boundary does not match with any statistical or administrative geographical unit. For the purpose of
this exercise, and in order to retrieve Census data corresponding to the NA boundary, we have selected and
aggregated the OAs (smallest statistical unit available from the census) entirely, or almost entirely contained
within the boundary (Figure 2-4 and Figure 2-5). We then excluded the OAs that were only partially
contained within the boundary (Figure 2-6).
34. OAs were designed to be relatively homogeneous in terms of population. This is why the OAs in the village
are much smaller than those within the rural areas as they contain a large population over a smaller area.
The output areas which were excluded are all relatively large and are indicative of a population scattered
over a large area. They can, therefore, be excluded and we can still produce a reasonably accurate
estimate of the population living within the NA boundary. Figures 2.5 and 2.6 therefore show output areas
that partially cover the NA area, but which are very rural and contain very few homes and residents.
Figure 2-4: Sowerby NA boundary overlapped onto output areas
Source: Calderdale Council, Nomis, AECOM
Figure 2-5: All output areas within NA boundary
Source: Nomis
Figure 2-6: Output areas only partially contained within NA boundary
Source: Nomis
AECOMAECOM 17
2.3 Planning policy context
35. In line with the basic conditions of Neighbourhood Planning, Neighbourhood Development Plans (NDPs)
are required to be in general conformity with the adopted strategic local policies. Consequently, there is a
requirement for the relevant Local Plan to be reviewed as part of this HNA.
36. The current local development policy comprises of the Replacement Calderdale Unitary development
plan (RCUDP) adopted in August 2006 and amended by the Secretary of State in August 2009 for a Plan
period of 15 years running from 2001 to 2016. As the RCUDP was adopted before 2012, it can be
considered out of date and not reliable for the purposes of arriving at a housing need figure for Sowerby.
6
Moreover, there will be no policies carried over from the RCUDP .
37. Although this document should have been replaced by the Calderdale LDF by August 2009, because of
delays to the plan preparation, the Council suspended work on this with the emergence of the NPPF and
agreed in early 2014 to move towards the production of a single Local Plan.
38. The emerging Local Plan (eLP) is due for adoption in 2018 and proposed to run for a period of 15 years
from 2017 to 2032. The document currently available is the Calderdale Local Plan Initial Draft July 2017;
7
it is still in progress to publication stage , and all policies and proposals are in draft form and should not be
regarded as final. Nevertheless, for the purpose of this exercise and given the maturity of the eLP, it is
appropriate for a review of the policies in this document to be conducted.
39. The emerging Local Plan provides the following 6 policies that are relevant to this HNA:
40. SD3 – Housing Target: which proposes a minimum target for 13,286 additional net dwellings to be
st st
delivered within Calderdale between 1 April 2017 and 31 March 2032 approximating to 886 dwellings per
8
annum, and a maximum target for 16,871 producing 1,125 dwellings per annum .
41. HS3 – Housing Mix: which ensures achievement of the right mix of type, size, tenure and affordability of
new housing (i) informed by the most recent SHMA (iv) in proposals for housing developments of 10 or
more dwellings (ii) and requires a statement setting out how the mix of housing will assist in meeting local
needs for housing development of 30 or more dwellings (iii).
42. HS4 – Housing for Independent Living: which states that proposals for residential development should
9
ensure that 100% of units are adaptable and accessible homes (iii). The policy further specifies that the
Council will actively seek to increase the level of housing suitable to meet the needs of older people and
disabled people (i) and that development proposals for communal establishments and specialist housing will
be supported provided they meet the criteria detailed in the policy.
43. HS6 – Affordable Housing (AH): which sets, as per SHMA15, a target for AH of 202 per annum.
Furthermore, the policy states that the details of AH provision required in private housing developments will
be informed by market location (sub-market areas are ranked according to 4 categories based upon their
housing market strength/value, detailed in Figure 2-7 and Figure 2-8 below), site size threshold
(developments of more than 10 homes), practicality and viability (proportion may be less according to
viability evidence). Exceptions will be made on brownfield sites within ‘medium’ or ‘cold’ market value
10
areas , in the Western part of the borough which is parished and where justified, a financial contribution of
a least equal value may be accepted to provide affordable homes elsewhere.
44. The level of AH will take into account the most recent evidence such as the SHMA15 and the contribution
may vary in size and style depending on needs of the particular submarket and in accordance with HS3 and
HS4.
6
Calderdale MBC (July 2017), ‘Calderdale Local Plan Initial Draft’, Annex 4, Paragraph 4.2
7
The document sets out the Council's initial draft Local Plan for further consultation under Regulation 18. Regulation 18
Consultation gives stakeholders and local people an opportunity to put forward additional comments and suggestions for
reasonable alternatives which the Council can consider as it finalises its Local Plan. This is not the regulation 19 Publication
draft which will be released in early 2018 for formal representations under Regulation 20.
8
The average of both numbers is 1005 dwellings per annum
9
Requirement M4(2) of the Building Regulations 2015
10
Calderdale Economic Viability Assessment (2011) has distinguished between property market performance across
Calderdale by separating the sub-areas into categories based on the sales receipts of houses and housing land from February
2008 to February 2010, and through consultation with industry stakeholders. Each sub-market has been classified under the
following categories:
‘very hot’ – highest value sub-market locations
‘hot’ – well performing sub-markets with values (transactions) above the Calderdale (borough-wide) average
‘moderate’ (referred to as ‘medium’ in the Local Plan) – average performing sub-markets with values straddling the
Calderdale average.
‘cold’ – least well performing sub-market locations.
AECOMAECOM 18
Figure 2-7: Provision of AH to Meet Policy HS6
Source: Calderdale Local Plan Initial Draft July 2017
Figure 2-8: Affordable Housing Zones
Source: Calderdale Local Plan Initial Draft July 2017
11
45. HS7 – Houses in Multiple Occupation : which does not state any specific numeric target but states that
HMOs will contribute to housing needs across the borough and that permission will be granted for the use of
a building as a HMO provided it does not cause harm to the area.
46. HS8 – Meeting the Need of Gypsies and Travellers and Travelling Showpeople: which states that the
provision of sufficient pitches and plots is estimated in different studies such as Calderdale Gypsy and
Traveller and Travelling Showperson Accommodation Assessment (2015) and the Calderdale and Kirklees
Baseline Census (2015). This policy is mainly concerned with site requirements.
11
HMOs are houses that are not occupied by a single household and include dwellings occupied by two or more people living
separately, bedsites, lodgings and hostels. They meet specific housing needs, such as those of students, single people on low
incomes or people who move frequently and require temporary accommodation (Calderdale Local Plan Initial Draft July 2017
16.61)
AECOMAECOM 19
3. Approach
3.1 Research Questions
47. HNA at neighbourhood plan level can be focused either on quantity of housing needed, type of housing
need, or both. In most cases, there is a need to focus on quantity where the housing target for the
settlement being assessed is unclear, for example where the local authority has not set a specific target for
the settlement, or where there is no local plan in place.
48. Research Questions abbreviated to ‘RQ;’ are arrived at the start of the project through discussion and
agreement with the Neighbourhood Forum. They serve to direct our research and provide the structure for
the HNA. The key research questions can be summarised as follows:
3.1.1 Quantity
49. The emerging Local Plan (eLP), Calderdale Local Plan Initial Draft 2017, has not yet been adopted but is
mature enough for the neighbourhood forum to have regard to its policies.
50. The eLP arrives at a housing figure of 13,286 for the borough. The eLP does not put forward a specific
number of this overall borough housing target to be allocated to Sowerby, although the Sowerby
Neighbourhood Plan Forum (SNPF) has commented that the MBC is seeking to apportion 390 dwellings
12
across 5 Greenfield sites .
51. Having conducted a review of the location of these sites, it appears that, while some of these are indeed
located within the NA (Brockwell Lane, Hough End, Dean Lane), others (Bently Royd and Cemetery Lane)
are outside or partially outside it. On the basis of this apparent ambiguity, it is appropriate for this HNA to
provide the SNPF with a housing needs figure.
RQ1: What quantity of Housing in the Plan Area is appropriate over the Plan period and how does that number
compare to the 390 dwellings apportioned by the borough?
3.1.2 Tenure
52. The SNPF has communicated the existence of a pressing need for AH. The Forum cites long waiting lists
for social housing for this claim, the presence of a community on lower incomes within the NA, and the fact
that existing AH falls into tenures that make it unaffordable to many within the community.
53. Furthermore, the eLP sets out policies that divides the borough into a number sub-housing market areas;
the NA falls into the two areas where the proportion of new build dwellings that are allocated to AH should
13
be between 25 and 35% . Although this gives an indication of the amount of AH to be provided, the policy
states that the tenure mix should be decided on the basis of the most recent evidence of local need.
54. Therefore, it is appropriate to provide the group with more clarity as to the AH tenures suited to meeting
community needs.
RQ2: What type of affordable housing (social housing, affordable rented, shared ownership, intermediate rented)
should be included in the housing mix?
3.1.3 Type and Size
55. The SNPF has expressed a keen interest in the type and size of dwellings to satisfy the needs. Although the
NA comprises of a diverse range of houses, the Forum has suggested smaller one or two bedrooms
dwellings are very rare, and most of the supply includes large, detached dwellings and farms.
RQ3: What type (terrace, semi, bungalows, flats and detached) and size (number of habitable rooms) of housing
has the best potential to meet local needs?
3.1.4 Housing for Specialist Groups
56. The SNPF has identified that there are not enough sheltered and extra dwellings for the elderly. The existing
nursing homes have either reached full capacity or are unaffordable for most.
RQ4: What provision should be made for specialist affordable housing for the elderlies within the NA?
12
Samantha Roberts, Sowerby Neighbourhood Plan Forum, 12/12/2017
13
Calderdale MBC (July 2017), ‘Calderdale Local Plan Initial Draft’, p.202
AECOMAECOM 20
3.2 Study Objectives
57. The objectives of this report can be summarised as:
Collation of a range of data with relevance to housing need in Sowerby;
Analysis of that data to determine patterns of housing need and demand; and
Setting out recommendations based on our data analysis that can be used to inform the
Neighbourhood Plan’s housing policies.
58. The remainder of this report is structured around the research questions set out above.
Chapter 9 sets out our conclusions and recommendations based on our data analysis that can be
used to inform the Neighbourhood Plan’s housing policies.
3.3 Relevant Data
3.3.1 SHMA
59. The PPG states that neighbourhood planners can refer to existing needs assessment prepared by the LPA
as a starting point. As Sowerby NA is located within the Calderdale Housing Market Area, we turned to the
Calderdale Strategic Housing Market Assessment (November 2015, henceforth SHMA), which covers the
housing market area and informs emerging housing policies at a local authority level, including AH policy.
60. While these are credible sources, and their statistical robustness can be assumed, their usefulness also
depends on whether the Housing Market Area (HMA) that the SHMA studies treat as their subject area can
be used as a proxy for the NA. This requires an assessment of the extent to which the demographic
characteristics and economic trends that it identifies are shared with it. Shared characteristics emerge as a
result of internal linkages fundamental to the notion of the ‘housing market area’ (HMA).
61. PPG defines an HMA as a geographical area ‘defined by household demand and preferences for all types
14
of housing, reflecting the key functional linkages between places where people live and work. It goes on to
remark that ‘establishing the assessment area may identify smaller sub-markets with specific features, and
it may be appropriate to investigate these specifically in order to create a detailed picture of local need. It is
important also to recognise that there are ‘market segments,’ i.e. not all housing types or economic
15
developments have the same appeal to different occupants.’
62. PPG therefore sets two principle tests for identifying a functional HMA: patterns of demand for housing and
commuting relationships. The first can be denoted by the concept of ‘self-containment,’ the degree to which
household moves are ‘contained’ within a certain geographical area, and the second by ‘travel to work
areas.’ It is generally assumed that a strong HMA will show 70% of household moves and commuting
journeys will be take place within its geography.
63. Sowerby NA is located within the Calderdale Housing Market Area, the housing market for the Borough
being largely self-contained. Furthermore, a number of distinct sub-markets have been identified within
Calderdale and are shown in Figure 3-1.
64. Consequently, the SHMA15 draws upon a range of data including population projections, housing market
transactions and employment scenarios to derive the objectively-assessed housing need. As such, it
contains relevant evidence to the RQs and to determining the degree to which the housing needs context of
Sowerby itself differs from the authority-wide picture.
65. As the NA is located close to Sowerby Bridge and in the Ryburn Ward, Sowerby straddles both the Sowerby
Bridge Local Housing Market Area and the Ryburn Valley Local Housing Market Area (sub-areas of the
overall Calderdale HMA), also shown in Figure 3-1. Consequently, when available, specific data to both
areas will be used as it allows a more nuanced and localised approach than results for the wider Calderdale
HMA.
14
PPG Paragraph: 010 Reference ID: 2a-010-20140306 Revision date: 06 03 2014
15
PPG Paragraph: 008 Reference ID: 2a-008-20140306 Revision date: 06 03 2014
AECOMAECOM 21
Figure 3-1: Sub-areas within Calderdale
Source: SHMA15, p. 27
66. This provides a strong starting point for policy development that aims to build on and add local specificity to
those of the LPA by enabling a comparison to be made with NA-level data (gathered as part of the
preparation of this study), given that such an exercise reveals contrasts as well as similarities.
3.3.2 Other relevant data (from LPA or NP group, e.g. housing survey)
67. In addition to the SHMA studies, we have gathered a range of other data sources to ensure our study is
robust for the purposes of developing policy at the neighbourhood plan level and locally specific. These
include Census providing insights into demographic shifts, the affordable housing waiting list which covers
the general Sowerby Bridge area and provided to us by the MBC, CACI data that provides data on
household income and Land Registry house price data.
68. Furthermore, to assess the housing market in Sowerby NA, data from the Land Registry was analysed. This
data provides price paid, housing types and date of transaction information, which allows housing market
trends to be identified. This data was collected for the HX6 postcodes (75) that are contained within the NA
boundary to create a database including all housing transactions registered with the Land Registry between
st
January 1s 2007 and December 31 2016. This area is used within the Market Signals section and also to
inform affordability ratios.
AECOMYou can also read


