Housing Element 2021-2029 - CITY OF LAGUNA NIGUEL - DRAFT May 2021
←
→
Page content transcription
If your browser does not render page correctly, please read the page content below
CITY OF
LAGUNA NIGUEL

  2021-2029
Housing Element

      DRAFT

     May 2021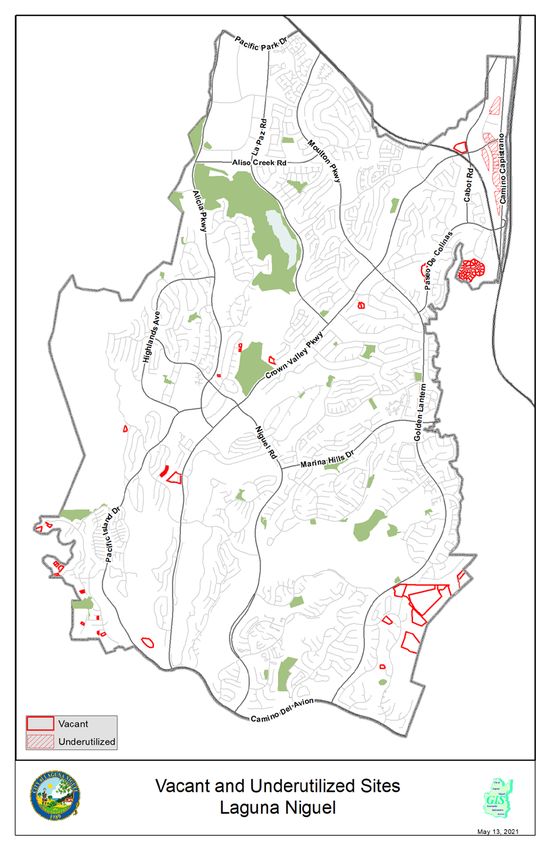
THE CITY OF LAGUNA NIGUEL HOUSING
General Plan for the City of Laguna Niguel
Chapter 8 - HOUSING ELEMENT
Contents
I. Introduction ................................................................................................................................................... 1
A. Purpose of the Housing Element ......................................................................................................... 1
B. Scope and Content of the Housing Element ........................................................................................ 1
C. Public Participation ............................................................................................................................. 1
D. Consistency with Other Elements of the General Plan........................................................................ 2
II. Housing Needs Assessment ........................................................................................................................... 3
A. Population Characteristics ................................................................................................................... 3
1. Population Growth Trends .......................................................................................................... 3
2. Age .............................................................................................................................................. 4
B. Household Characteristics ................................................................................................................... 4
1. Household Size ........................................................................................................................... 4
2. Housing Tenure........................................................................................................................... 5
3. Overcrowding ............................................................................................................................. 6
4. Household Income and Overpayment ......................................................................................... 7
C. Employment ........................................................................................................................................ 8
1. Current Employment................................................................................................................... 8
D. Housing Stock Characteristics............................................................................................................. 9
1. Housing Type and Vacancy ........................................................................................................ 9
2. Housing Age and Conditions .................................................................................................... 10
3. Housing Cost ............................................................................................................................ 10
E. Special Needs .................................................................................................................................... 13
1. Persons with Disabilities ........................................................................................................... 13
2. Elderly....................................................................................................................................... 16
3. Large Households ..................................................................................................................... 16
4. Female-Headed Households ..................................................................................................... 16
5. Farm Workers ........................................................................................................................... 17
6. Homeless Persons ..................................................................................................................... 17
F. Assisted Housing at Risk of Conversion ........................................................................................... 18
1. Inventory of Assisted Units ...................................................................................................... 18
2. Units at Risk ............................................................................................................................. 18
G. Low- and Moderate-Income Housing in the Coastal Zone ............................................................... 20
H. 2021-2029 Housing Needs ................................................................................................................ 21
1. Overview of the Regional Housing Needs Assessment ............................................................ 21
2. 2021-2029 Laguna Niguel Housing Needs ............................................................................... 21
III. Resources and Opportunities ....................................................................................................................... 23
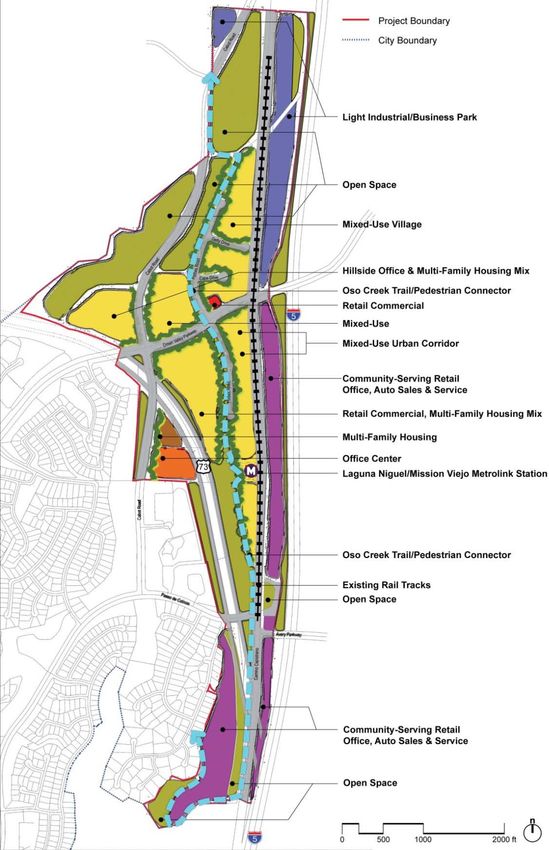
A. Land Resources ................................................................................................................................. 23
B. Financial and Administrative Resources ........................................................................................... 23
1. State and Federal Resources ..................................................................................................... 23
2. Local Resources ........................................................................................................................ 24
C. Energy Conservation Opportunities .................................................................................................. 24
IV. Constraints ................................................................................................................................................... 27
A. Governmental Constraints ................................................................................................................. 27
1. Land Use Plans and Regulations............................................................................................... 27
2. Development Processing Procedures ........................................................................................ 38
3. Development Fees and Improvement Requirements ................................................................ 40
Draft | May 2021 iii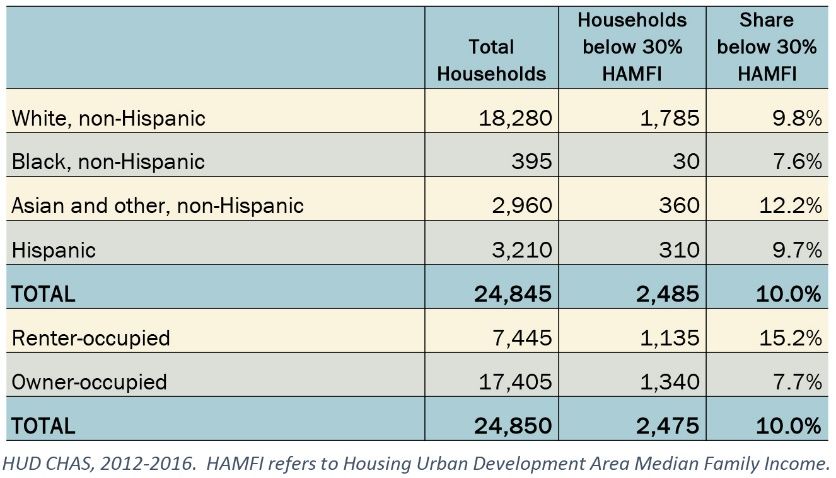
THE CITY OF LAGUNA NIGUEL                                                                                                                            HOUSING

      B.       Non-Governmental Constraints ......................................................................................................... 42
               1. Environmental Constraints........................................................................................................ 42
               2. Infrastructure Constraints.......................................................................................................... 42
               3. Land Costs ................................................................................................................................ 43
               4. Construction Costs .................................................................................................................... 43
               5. Cost and Availability of Financing ........................................................................................... 43
      C.       Affirmatively Furthering Fair Housing ............................................................................................. 43
V.    Housing Plan ............................................................................................................................................... 44
      A.       Goals and Policies ............................................................................................................................. 44
      B.       Housing Programs ............................................................................................................................. 45
      C.       Quantified Objectives ........................................................................................................................ 48

Appendix A – Evaluation of the Prior Housing Element
Appendix B – Residential Land Inventory
Appendix C – Public Participation Summary

                                                                  List of Tables
Table II-1      Population Trends, 2000-2020 Laguna Niguel vs. SCAG Region..................................................... 3
Table II-2      Age Distribution Laguna Niguel ........................................................................................................ 4
Table II-3      Household Size Laguna Niguel.......................................................................................................... 5
Table II-4      Household Tenure – Laguna Niguel vs. SCAG Region..................................................................... 5
Table II-5      Household Tenure by Age – Laguna Niguel...................................................................................... 6
Table II-6      Overcrowding by Tenure – Laguna Niguel vs. SCAG Region .......................................................... 6
Table II-7      Overpayment by Income Category – Laguna Niguel......................................................................... 7
Table II-8      Extremely-Low-Income Households by Race and Tenure – Laguna Niguel..................................... 7
Table II-9      Employment by Industry – Laguna Niguel ........................................................................................ 8
Table II-10     Employment by Occupation – Laguna Niguel ................................................................................... 8
Table II-11     Housing by Type – Laguna Niguel vs. SCAG Region ...................................................................... 9
Table II-12     Vacant Units by Type – Laguna Niguel vs. SCAG Region ............................................................... 9
Table II-13     Age of Housing Stock – Laguna Niguel vs. SCAG Region............................................................. 10
Table II-14     Income Categories and Affordable Housing Costs, 2021 – Orange County.................................... 11
Table II-15     Median Sales Price for Existing Homes – Laguna Niguel vs. SCAG Region ................................. 11
Table II-16     Monthly Owner Costs for Mortgage Holders – Laguna Niguel vs. SCAG Region ......................... 12
Table II-17     Percentage of Income Spent on Rent – Laguna Niguel ................................................................... 12
Table II-18     Percentage of Income Spent on Rent by Income Category – Laguna Niguel .................................. 13
Table II-19     Disabilities by Type – Laguna Niguel ............................................................................................. 14
Table II-20     Disabilities by Type for Seniors 65+ – Laguna Niguel vs SCAG Region ....................................... 14
Table II-21     Elderly Households by Income and Tenure – Laguna Niguel ......................................................... 16
Table II-22     Female Headed Households – Laguna Niguel ................................................................................. 17
Table II-23     Inventory of Assisted Units – Laguna Niguel ................................................................................. 18
Table II-24     2021-2029 Regional Housing Needs – Laguna Niguel .................................................................... 21
Table III-1     Land Inventory Summary – Laguna Niguel..................................................................................... 23
Table IV-1      Residential Land Use Categories – Laguna Niguel General Plan .................................................... 27
Table IV-2      Land Use Development Capacity – Gateway Specific Plan ............................................................ 30
Table IV-3      Residential Development Standards ................................................................................................ 32
Table IV-4      Permitted Residential Uses by Zoning District ................................................................................ 33
Table IV-5      Residential Parking Requirements ................................................................................................... 37
Table IV-6      Planning and Development Fees ...................................................................................................... 41
Table V-1       Quantified Objectives – 2013-2021 City of Laguna Niguel ............................................................ 48

Draft | May 2021                                                                                                                                                 iv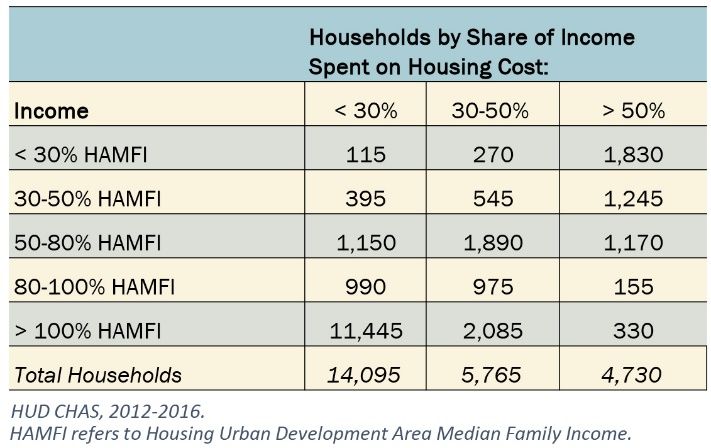
THE CITY OF LAGUNA NIGUEL                                                                           HOUSING

I.        INTRODUCTION
A. Purpose of the Housing Element
The Housing Element is a guide for housing within Laguna Niguel. The Element provides an indication of
the need for housing in the community in terms of housing affordability, availability, adequacy, and
accessibility. The Element provides a strategy to address housing needs and identifies a series of specific
housing programs to meet community needs.
The Housing Element is an official municipal response to a growing awareness for the need to provide
housing for all economic segments of the community, as well as a legal requirement for all California
jurisdictions. It provides Laguna Niguel with the opportunity to plan for the existing and future housing needs
in the community. This Element has been prepared in compliance with the 2021-2029 planning cycle for
cities within the Southern California Association of Governments (SCAG) region. It identifies strategies and
programs that focus on: 1) providing diverse housing sites and opportunities; 2) conserving and improving
the existing affordable housing stock; 3) removing governmental and other constraints to housing
development; and 4) promoting equal housing opportunities.

B.    Scope and Content of the Housing Element
The State Legislature recognizes the role of local general plans and particularly the Housing Element in
implementing statewide housing goals to provide decent and adequate housing for all persons. Furthermore,
the Legislature stresses continuing efforts toward providing affordable housing for all income groups. The
State Department of Housing and Community Development (HCD) also sets forth specific requirements
regarding the scope and content of housing elements prepared by cities and counties.
As mandated by state law, the planning period for this Housing Element extends from 2021 to 2029. The
Housing Element consists of the following major components:

      •      An analysis of the City’s demographic and housing characteristics and trends (Chapter II);
      •      An evaluation of land, financial, and administrative resources available to address the City’s
             housing goals (Chapter III);
      •      A review of potential constraints, both governmental and non-governmental, to meeting the
             City’s housing needs (Chapter IV); and
      •      A Housing Plan for the 2021-2029 planning period, including housing goals, policies and
             programs (Chapter V).
      •      A review of the City’s accomplishments and progress in implementing the 2013-2021 Housing
             Element is provided in Appendix A.

C. Public Participation
Section 65583(c)(5) of the Government Code states that "The local government shall make diligent effort to
achieve public participation of all the economic segments of the community in the development of the
housing element, and the program shall describe this effort." Public participation played an important role in
the formulation and refinement of the City’s housing goals and policies and in the development of a Land
Use Plan that determines the extent and density of future residential development in the community.
City residents had several opportunities to recommend strategies, review, and comment on the Laguna Niguel
Housing Element. In Spring 2021, public meetings to consider the draft Housing Element were held by the
Planning Commission and City Council. Following review by the State Department of Housing and

Draft | May 2021                                                                                             1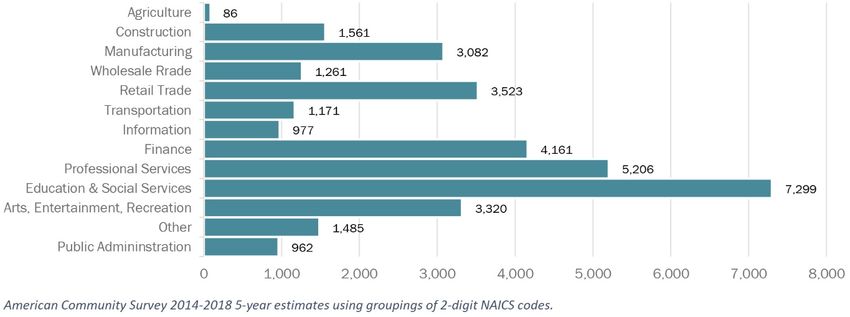
THE CITY OF LAGUNA NIGUEL                                                                        HOUSING

Community Development (HCD), public hearings were conducted by the Planning Commission and City
Council to review and consider adoption of the Housing Element. Meeting notices were posted on the City’s
website, and notification was published in the local newspaper in advance of the meetings. Copies of the
draft Element were made available for review at City Hall and were posted on the City website, and notices
were sent directly to agencies that serve the City’s special needs populations. These service providers
included organizations that represent the housing interest groups.
The following is a list of opportunities for public involvement in the preparation of this Housing Element
update. A summary of materials and public comments from these meetings is included in Appendix C.
        Planning Commission workshop                April 15, 2021
        Planning Commission meeting                 May 25, 2021
        City Council meeting                        ___________
        Planning Commission hearing                 ___________
        City Council hearing                        ___________

D. Consistency with Other Elements of the General Plan
State law requires that all portions of the General Plan be internally consistent. The Laguna Niguel General
Plan contains the following nine elements: 1) Land Use; 2) Open Space and Parks; 3) Circulation; 4) Public
Facilities; 5) Noise; 6) Seismic/Public Safety; 7) Housing; 8) Growth Management; and 9) Community
Service Standards. The City will ensure consistency between the various General Plan elements and ensure
policy direction introduced in one element is reflected in other plan elements. For example, residential
development capacities established in the Land Use Element and constraints to development identified in the
Seismic/Public Safety Element are incorporated into the Housing Element and the discussion of infrastructure
and public services in the Housing Element is based upon information from the Public Facilities element.
This Housing Element builds upon the other General Plan elements and is consistent with the policies and
proposals set forth by the Plan. As the General Plan is amended from time to time, the City will review the
Housing Element for internal consistency, and make any necessary revisions.
SB 1087 of 2005 requires cities to provide a copy of their Housing Elements to local water and sewer
providers, and also requires that these agencies provide priority hookups for developments with lower-
income housing. The Housing Element will be provided to these agencies immediately upon adoption.
Government Code §65302(g)(3) requires that the Safety Element be reviewed upon each revision of the
Housing Element and, if necessary, be revised to include new information regarding flood hazard and
management information.

Draft | May 2021                                                                                          2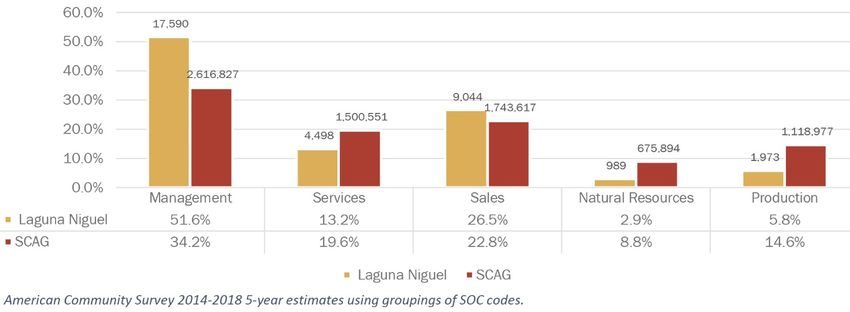
THE CITY OF LAGUNA NIGUEL                                                                            HOUSING

II.     HOUSING NEEDS ASSESSMENT
Laguna Niguel is located in southern Orange County approximately midway between San Diego and Los
Angeles. The City is a master-planned community that offers a range of lifestyle and housing opportunities.
Much of Laguna Niguel’s growth took place prior to its incorporation in 1989. Since incorporation, the city
has grown substantially from a population of approximately 44,400 to about 65,168 residents in 2021. Laguna
Niguel is approximately 14.7 square miles in area and is bounded by Dana Point to the south, San Juan
Capistrano to the east, Mission Viejo to the northeast, Laguna Hills to the north, Aliso Viejo to the northwest,
and Laguna Beach to the west.
This chapter examines general population and household characteristics and trends, such as age, employment,
household composition and size, household income, and special needs. Characteristics of the existing housing
stock (e.g., number of units and type, tenure, age and condition, costs) are also addressed. Finally, the city’s
projected housing needs based on the 2021-2029 Regional Housing Needs Assessment (RHNA) are
examined.
The Housing Needs Assessment utilizes recent data from the U.S. Census, California Department of Finance
(DOF), California Employment Development Department (EDD), Southern California Association of
Governments (SCAG) and other relevant sources. Supplemental data was obtained through field surveys and
from private vendors. In addition, the City’s 2020-2024 Consolidated Plan provides useful information for
this update of the Housing Element.

A. Population Characteristics
      1.    Population Growth Trends
Laguna Niguel was incorporated December 1, 1989 with a population of approximately 44,400. As of 2020
the city’s estimated total population is 65,316 according to the California Department of Finance. Over the
2000-2020 period Laguna Niguel had an annual growth rate of 0.3% compared to 0.7% for the entire SCAG
region (see Table II-1).

                                               Table II-1
                                      Population Trends, 2000-2020 –
                                      Laguna Niguel vs. SCAG Region

Draft | May 2021                                                                                              3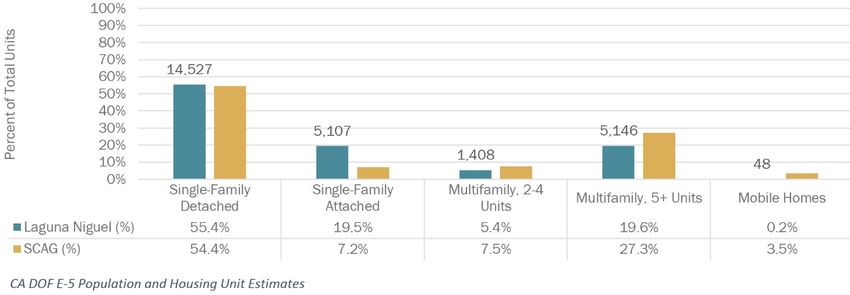
THE CITY OF LAGUNA NIGUEL                                                                         HOUSING

      2.    Age
Housing needs are influenced by the age characteristics of the population. Different age groups require
different accommodations based on lifestyle, family type, income level, and housing preference. Table II-2
shows recent Census estimates of the city’s age distribution by gender. This table shows that the population
of Laguna Niguel is 48.8% male and 51.2% female. The share of the population of Laguna Niguel which is
under 18 years of age is 20%, which is lower than the regional share of 23.4%. Laguna Niguel's seniors (65
and above) make up 17.2% of the population, which is higher than the regional share of 13%.

                                              Table II-2
                                            Age Distribution –
                                             Laguna Niguel

B.    Household Characteristics
      1.    Household Size
Household characteristics are important indicators of the type and size of housing needed in a city. The
Census defines a “household” as all persons occupying a housing unit, which may include single persons
living alone, families related through marriage or blood, or unrelated persons sharing a single unit. Persons
in group quarters such as dormitories, retirement or convalescent homes, or other group living situations are
included in population totals, but are not considered households.
Table II-3 shows recent Census estimates of household sizes in Laguna Niguel for owners, renters, and
overall. The most commonly occurring household size is of two people (37.7%) and the second-most
commonly occurring household is of one person (23.8%). Laguna Niguel has a higher share of single-person
households than the SCAG region overall (23.8% vs. 23.4%) and a lower share of 7+ person households than
the SCAG region overall (0.7% vs. 3.1%).

Draft | May 2021                                                                                           4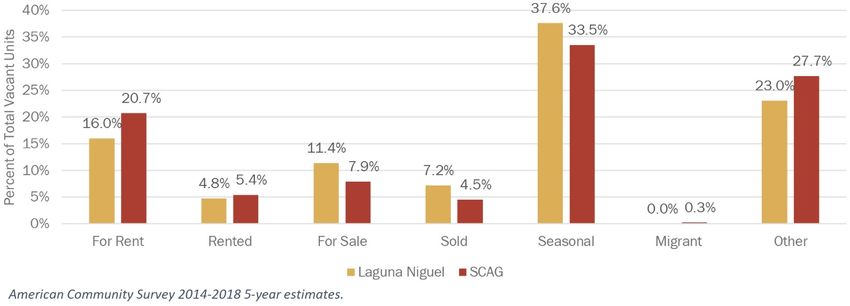
THE CITY OF LAGUNA NIGUEL                                                                        HOUSING

                                               Table II-3
                                             Household Size –
                                              Laguna Niguel

      2.    Housing Tenure
Housing tenure (owner vs. renter) is an important indicator of the housing market. Communities need an
adequate supply of units available both for rent and for sale in order to accommodate a range of households
with varying income, family size and composition, and lifestyle. Table II-4 provides a comparison of owner-
occupied and renter-occupied units in the city as compared to the region as a whole. Laguna Niguel's housing
stock consists of 25,360 total units, 17,760 of which are owner-occupied and 7,600 of which are renter-
occupied. The share of renters in Laguna Niguel is lower than in the SCAG region overall.

                                              Table II-4
                                          Household Tenure –
                                     Laguna Niguel vs. SCAG Region

Draft | May 2021                                                                                          5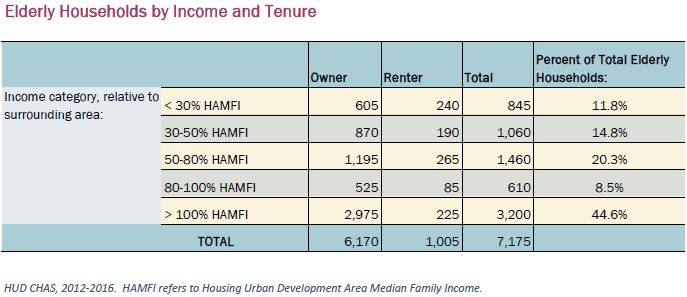
THE CITY OF LAGUNA NIGUEL                                                                         HOUSING

Home ownership rates are closely related to age, with younger persons more likely to be renters (Table II-5).

                                              Table II-5
                                        Household Tenure by Age –
                                             Laguna Niguel

      3.    Overcrowding
Overcrowding is often closely related to household income and the cost of housing. The U.S. Census Bureau
considers a household to be overcrowded when there is more than one person per room, excluding bathrooms
and kitchens, with severe overcrowding when there are more than 1.5 occupants per room. Table II-6
summarizes recent overcrowding data for renters and owners in the City of Laguna Niguel compared to the
region as a whole.

                                              Table II-6
                                       Overcrowding by Tenure –
                                     Laguna Niguel vs. SCAG Region

This table shows that less than 1% of owner-occupied households were overcrowded but about 10% of renter-
occupied households were overcrowded or severely overcrowded in Laguna Niguel.

Draft | May 2021                                                                                           6
THE CITY OF LAGUNA NIGUEL HOUSING
4. Household Income and Overpayment
Household income is a primary factor affecting
housing needs in a community. Recent Census Table II-7
estimates reported that about 3.7% of Laguna Overpayment by Income Category –
Laguna Niguel
Niguel's households are experiencing poverty,
compared to 7.9% of households in the SCAG
region. Poverty thresholds, as defined by the ACS,
vary by household type. In 2018, a single individual
under 65 was considered in poverty with a money
income below $13,064/year while the threshold for a
family consisting of 2 adults and 2 children was
$25,465/year. According to State housing policy,
overpaying occurs when housing costs exceed 30%
of gross household income. Table II-7 displays recent
estimates for overpayment by household income
level in Laguna Niguel. This table shows that the
extremely-low-income and very-low-income house-
holds in Laguna Niguel had the highest rates of
overpayment. Although homeowners enjoy income and property tax deductions and other benefits that help
to compensate for high housing costs, lower-income homeowners may need to defer maintenance or repairs
due to limited funds, which can lead to deterioration. For lower-income renters, severe cost burden can
require families to double up, resulting in overcrowding and related problems.
Extremely-Low-Income Households
State law requires quantification and
analysis of the housing needs of Table II-8
extremely-low-income (ELI) households, Extremely-Low-Income Households by Race and Tenure –
Laguna Niguel
which is defined as less than 30% of area
median income. According to recent
HUD estimates about 2,475 Laguna
Niguel households are within the
extremely-low-income category. ELI
households have a variety of housing
problems including overpayment and
overcrowding. Renters are about twice as
likely to have extremely low incomes than
homeowners.
The resources and programs to address
this need are generally the same as for
other lower-income categories and are
discussed throughout the Housing
Element, including Chapter V, the Housing Plan. Because the needs of ELI households overlap extensively
with other special needs groups, further analysis and resources for these households can be found in Section
IV.A.1.d, Zoning for Affordable Housing and Special Needs Housing, page 33.
Draft | May 2021 7THE CITY OF LAGUNA NIGUEL HOUSING
C. Employment
Employment is an important factor affecting housing needs within a community. The jobs available in each
employment sector and the wages for these jobs affect the type and size of housing residents can afford.
1. Current Employment
Current employment and projected job growth have a significant influence on housing needs during this
planning period. Recent Census estimates (Table II-9) reported that the city had 34,094 workers living within
its borders who work across 13 major industrial sectors. The most prevalent industry is Education & Social
Services with 7,299 employees (21.4% of total) and the second most prevalent industry is Professional
Services with 5,206 employees (15.3% of total).
Table II-9
Employment by Industry –
Laguna Niguel
As seen in Table II-10, the most prevalent occupational category in Laguna Niguel is Management, in which
17,590 (51.6% of total) employees work. The second-most prevalent type of work is in Sales, which employs
9,044 (26.5% of total) in Laguna Niguel.
Table II-10
Employment by Occupation –
Laguna Niguel
Draft | May 2021 8THE CITY OF LAGUNA NIGUEL HOUSING
D. Housing Stock Characteristics
This section presents an evaluation of the characteristics of the community’s housing stock and helps in
identifying and prioritizing needs. The factors evaluated include the number and type of housing units, age
and condition, tenure, vacancy, housing costs, affordability, and assisted affordable units at-risk of loss due
to conversion to market-rate. A housing unit is defined as a house, apartment, mobile home, or group of
rooms, occupied as separate living quarters, or if vacant, intended for occupancy as separate living quarters.
1. Housing Type and Vacancy
According to the California Department of Finance, the housing stock in Laguna Niguel is comprised mostly
of single-family detached homes, which made up about 55% of all units, while multi-family units comprised
about 25% of the total (Table II-11).
Table II-11
Housing by Type –
Laguna Niguel vs. SCAG Region
Table II-12 shows recent Census estimates regarding vacant units in Laguna Niguel compared to the SCAG
region as a whole. In both the city and the entire region, the largest category of vacant units is “seasonal”
which is likely to represent second homes occupied for a portion of the year.
Table II-12
Vacant Units by Type –
Laguna Niguel vs. SCAG Region
Draft | May 2021 9THE CITY OF LAGUNA NIGUEL HOUSING
2. Housing Age and Conditions
Housing age is often an important indicator of housing condition. Housing units built prior to 1978 before
stringent limits on the amount of lead in paint were imposed may have interior or exterior building
components coated with lead-based paint. Housing units that are more than 30 years old are the most likely
to need rehabilitation or to have lead-based paint in deteriorated condition. Table II-13 shows the age
distribution of the housing stock in Laguna Niguel compared to the region as a whole.
Table II-13
Age of Housing Stock –
Laguna Niguel vs. SCAG Region
This table shows that the majority of housing units in Laguna Niguel were constructed prior to 1990 and are
now more than 30 years old. This suggests that there is a growing need for housing repair and rehabilitation
in the city.
The goal of the City’s Code Enforcement program is to address housing concerns before they become serious
problems. It is estimated that approximately 5% of the homes in the City’s older neighborhoods, typically
built in the late 1960s and early 1970s, are in need of structural repairs consisting primarily of new roofs and
window replacements. There are approximately 6,000 dwelling units in Laguna Niguel that were built prior
to 1980; therefore, it is estimated that approximately 300 dwelling units may be in need of some structural
repair, which represents about 1% of the city’s total housing stock.
3. Housing Cost
a. Housing Affordability Criteria
State law establishes five income categories for purposes of housing programs based on the area (i.e., county)
median income (“AMI”): extremely-low (30% or less of AMI), very-low (31%-50% of AMI), low (51%-
80% of AMI), moderate (81-120% of AMI) and above moderate (over 120% of AMI). Housing affordability
is based on the relationship between household income and housing expenses. According to HUD and the
California Department of Housing and Community Development 1, housing is considered “affordable” if the
monthly payment is no more than 30% of a household’s gross income. In some areas, such as Orange County,
these income limits may be increased to adjust for high housing costs.
1 HCD memo of 2/1/2012 (http://www.hcd.ca.gov/hpd/hrc/rep/state/incNote.html)
Draft | May 2021 10THE CITY OF LAGUNA NIGUEL HOUSING
Table II-14 shows affordable rent levels and estimated affordable purchase prices for housing in Orange
County (including Laguna Niguel) 2 by income category. Based on state-adopted standards, the maximum
affordable monthly rent (including utilities) for extremely-low-income households is $723, while the
maximum affordable rent for very-low-income households is $1,204. The maximum affordable rent for low-
income households is $1,926, while the maximum for moderate-income households is $2,559.
Maximum purchase prices are more difficult to determine due to variations in mortgage interest rates,
qualifying procedures, down payments, special tax assessments, homeowner association fees, property
insurance rates, etc. With this caveat, the maximum home purchase prices by income category shown in
Table II-14 have been estimated based on typical conditions.
Table II-14
Income Categories and Affordable Housing Costs, 2021 –
Orange County
Income Category Maximum Income Affordable Rent Affordable Price (est.)
Extremely Low $40,350 $1,009 *
Very Low $67,250 $1,681 *
Low $107,550 $2,689 *
Moderate $128,050 $3,201 $500,000
Above moderate Over $128,050 Over $3,201 Over $500,000
Assumptions: Based on a family of 4 and 2021 State income limits; 30% of gross income for rent or principal, interest, taxes &
insurance; 5% down payment, 4% interest, 1.25% taxes & insurance, $350 HOA dues
Notes:
*For-sale affordable housing is typically at the moderate income level
Source: Cal. HCD; JHD Planning LLC
b. For-Sale Housing
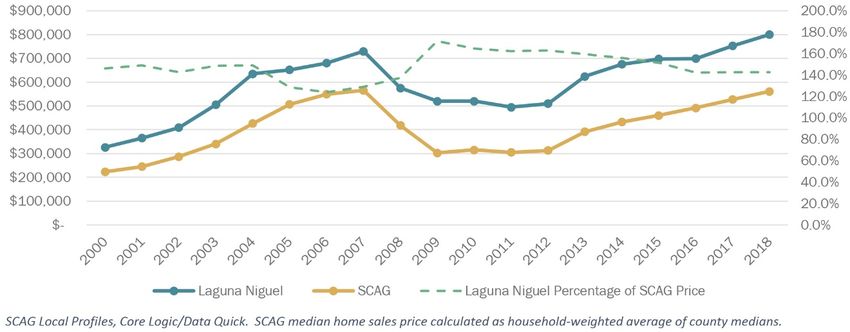
Between 2000 and 2018, median home sales prices in Laguna Niguel increased 145% while prices in the
SCAG region increased 151%. 2018 median home sales price in Laguna Niguel was approximately $800,000.
Prices in Laguna Niguel have ranged from a low of 123.8% of the regional median in 2006 and a high of
171.6% in 2009 (Table II-15). Based on the estimated affordable purchase prices shown in Table II-14 above,
most detached homes are only affordable for above-moderate income households.
Table II-15
Median Sales Price for Existing Homes –
Laguna Niguel vs. SCAG Region
2 Affordable rent and purchase prices are based on county median income.
Draft | May 2021 11THE CITY OF LAGUNA NIGUEL HOUSING
Owner households make up about 70% of Laguna Niguel households. Table II-16 shows the distribution of
monthly mortgage cost in Laguna Niguel compared to the region as a whole. The most commonly occurring
mortgage payment in both Laguna Niguel and throughout the SCAG region is $2000-$3000/month.
Table II-16
Monthly Owner Costs for Mortgage Holders –
Laguna Niguel vs. SCAG Region
c. Rental Housing
As described previously in the discussion of income and overpayment (Table II-7), a large proportion of
renters in Laguna Niguel fall within the lower-income categories. As a result, trends in rental rates have a
major impact on these residents. Table II-17shows recent Census estimates of the percentage of income spent
on rent in Laguna Niguel. Over 57% of Laguna Niguel renters spend 30% or more of gross income on housing
cost, compared to about 55% in the SCAG region. Additionally, about 31% of households in Laguna Niguel
spend 50% or more of gross income on housing cost, compared to about 29% in the SCAG region as a whole.
Table II-17
Percentage of Income Spent on Rent –
Laguna Niguel
Draft | May 2021 12THE CITY OF LAGUNA NIGUEL HOUSING
Census estimates also show that lower-income households spend a higher share of income on housing while
high-income households are more likely to spend under 20% of income on housing (Table II-18).
Table II-18
Percentage of Income Spent on Rent by Income Category –
Laguna Niguel
E. Special Needs
Certain groups have greater difficulty in finding decent, affordable housing due to special circumstances.
Such circumstances may be related to one’s employment and income, family characteristics, disability, or
other conditions. As a result, some Laguna Niguel residents may experience a higher prevalence of
overpayment, overcrowding, or other housing problems.
State Housing Element law defines “special needs” groups to include persons with disabilities (including
developmental disabilities), the elderly, large households, female-headed households with children, homeless
people, and farm workers. This section contains a discussion of the housing needs facing each of these groups.
1. Persons with Disabilities
Recent Census data estimated that the most common types of disability for Laguna Niguel residents are
ambulatory, hearing, cognitive and independent living disabilities (Table II-19). Of those aged 65 and over
in Laguna Niguel, the most common type of disabilities were hearing and ambulatory (Table II-20). In
Laguna Niguel, about 44% of the population with a disability is employed, compared to 76% of those without
a disability.
Housing opportunities for persons with disabilities can be maximized through housing assistance programs,
universal design features such as widened doorways, ramps, lowered countertops, single-level units and
ground floor units, residential care facilities and assisted living developments.
Draft | May 2021 13THE CITY OF LAGUNA NIGUEL HOUSING
Table II-19
Disabilities by Type –
Laguna Niguel
Table II-20
Disabilities by Type for Seniors 65+ –
Laguna Niguel vs SCAG Region
Draft | May 2021 14THE CITY OF LAGUNA NIGUEL HOUSING
Developmental Disabilities
As defined by federal law, “developmental disability” means a severe, chronic disability of an individual
that:
• Is attributable to a mental or physical impairment or combination of mental and physical
impairments;
• Is manifested before the individual attains age 22;
• Is likely to continue indefinitely;
• Results in substantial functional limitations in three or more of the following areas of major life
activity: a) self-care; b) receptive and expressive language; c) learning; d) mobility; e) self-
direction; f) capacity for independent living; or g) economic self-sufficiency;
• Reflects the individual’s need for a combination and sequence of special, interdisciplinary, or
generic services, individualized supports, or other forms of assistance that are of lifelong or
extended duration and are individually planned and coordinated.
The Census Bureau does not record developmental disabilities. According to the U.S. Administration on
Developmental Disabilities, an accepted estimate of the percentage of the population as affected by a
developmental disability is 1.5%. Many of those with a developmental disability can live and work
independently within a conventional housing environment. More severely affected individuals require a
group living environment where supervision is provided. The most severely affected individuals may require
an institutional environment where medical attention and physical therapy are provided. Because
developmental disabilities exist before adulthood, the first issue in supportive housing for the
developmentally disabled is the transition from the person’s living situation as a child to an appropriate level
of independence as an adult.
The State Department of Developmental Services (DDS) estimated that there are approximately 396 persons
in Laguna Niguel with a developmental disability, and most of those live with a family member. DDS
provides community-based services to persons with developmental disabilities and their families through a
statewide system of 21 regional centers, four developmental centers, and two community-based facilities.
The Regional Center of Orange County (RCOC) is one of 21 regional centers in California that provides
point of entry to services for people with developmental disabilities. The RCOC is a private, non-profit
community agency that contracts with local businesses to offer a wide range of services to individuals with
developmental disabilities and their families.
Any resident of Orange County who has a developmental disability that originated before age 18 is eligible
for services. Services are offered to people with developmental disabilities based on Individual Program
Plans and may include: Adult day programs; advocacy; assessment/consultation; behavior management
programs; diagnosis and evaluation; independent living services; infant development programs; information
and referrals; mobility training; prenatal diagnosis; residential care; respite care; physical and occupational
therapy; transportation; consumer, family vendor training; and vocational training. RCOC also coordinates
the State-mandated Early Start program, which provides services for children under age three who have or
are at substantial risk of having a developmental disability.
The mission of the Dayle McIntosh Center is to advance the empowerment, equality, integration and full
participation of people with disabilities in the community. The Center is not a residential program, but instead
promotes the full integration of disabled persons into the community. Dayle McIntosh Center is a consumer-
driven organization serving all disabilities. Its staff and board are composed of over 50% of people with
disabilities. Its two offices service over 500,000 people in Orange County and surrounding areas with
disabilities. The Center’s South County branch is located in Laguna Hills, immediately adjacent to Laguna
Niguel.
Draft | May 2021 15THE CITY OF LAGUNA NIGUEL HOUSING
In addition to these resources, City housing programs that respond to the needs of this population include 1-
Emergency Shelters and Transitional/Supportive Housing, 2-Affordable Housing Development, 3-
Conservation and Improvement of Existing Low- and Moderate-Income Housing, and 4-Promotion of Equal
Housing Opportunity.
2. Elderly
Federal housing data define a household type as 'elderly family' if it consists of two persons with either or
both age 62 or over. Recent Census Bureau estimates reported that of Laguna Niguel's 7,175 such households,
11.8% earn less than 30% of the area median income (compared to 24.2% in the SCAG region) and 26.6%
earn less than 50% of the area median income (compared to 30.9% in the SCAG region) (Table II-21). Many
elderly persons are dependent on fixed incomes or have disabilities. Elderly homeowners may be physically
unable to maintain their homes or cope with living alone. The housing needs of this group can be addressed
through smaller units, accessory dwelling units on lots with existing homes, shared living arrangements,
congregate housing, and housing assistance programs.
Table II-21
Elderly Households by Income and Tenure –
Laguna Niguel
3. Large Households
Household size is an indicator of need for large units. Large households are defined as those with five or
more members. As shown previously in Table II-3, household size data show that the need for large units
with four or more bedrooms is expected to be significantly less than for smaller units.
4. Female-Headed Households
Recent Census estimates reported that about 7.9% of Laguna Niguel's households are female-headed
(compared to 14.3% in the SCAG region), 3.2% are female-headed and with children (compared to 6.6% in
the SCAG region), and 0.9% are female-headed and with children under 6 (compared to 1.0% in the SCAG
region) (Table II-22). While female-headed households represent a relatively small portion of households,
they are more likely to have housing problems such as overpayment or overcrowding. City programs to
facilitate new affordable housing development and conservation of existing affordable homes help to serve
the needs of single-parent households with low- and moderate-incomes.
Draft | May 2021 16THE CITY OF LAGUNA NIGUEL HOUSING
Table II-22
Female Headed Households –
Laguna Niguel
5. Farm Workers
Farm workers are traditionally defined as persons whose primary income is from seasonal agricultural work.
Historically, Orange County’s economy was linked to agriculture. Today, Orange County is a mostly
developed urban/suburban region, with a strong local economy that is not tied to an agricultural base. While
there are still significant active farming areas on the Irvine Ranch to the north and Rancho Mission Viejo to
the southeast, shifts in the county’s economy to manufacturing, technology, and service-oriented sectors have
significantly curtailed agricultural production. Recent Census estimates reported that 12 persons living in
Laguna Niguel were employed full-time, year-round in farming, fishing and forestry occupations. Since there
are no significant agricultural operations within Laguna Niguel, the need for permanent farmworker housing
is of less concern than in other areas where large-scale agricultural operations exist. The needs of lower-
income agricultural workers who are permanent residents are addressed through a variety of affordable
housing programs that serve the needs of all lower-income persons and are not restricted only to farmworkers.
6. Homeless Persons
Throughout the country, homelessness is a serious problem. Factors contributing to homelessness include:
the general lack of emergency shelters and transitional housing, housing affordable to lower-income persons;
an increasing number of persons whose incomes fall below the poverty level; reductions in public assistance
for the poor; and the de-institutionalization of the mentally ill.
The most recent County of Orange “Point-in-Time” survey of the homeless population for which data is
available was conducted in January 2019. That survey estimated that there were approximately 6,860
homeless persons in Orange County, of which 2,899 were sheltered and 3,961 were unsheltered 3. Of
those, 7 unsheltered persons and 3 sheltered persons were reported in Laguna Niguel.
Senate Bill (SB) 2 of 2007 requires that jurisdictions quantify the need for emergency shelter and determine
whether existing facilities are adequate to serve the need. An emergency shelter is defined as “housing with
minimal supportive services for homeless persons that is limited to occupancy of six months or less by a
homeless person. No individual or household may be denied emergency shelter because of an inability to
pay.” If adequate existing facilities are not available, the law requires jurisdictions to identify areas where
new facilities are permitted “by-right” (i.e., without requiring discretionary approval such as a use permit).
A jurisdiction could also satisfy its shelter needs through a multi-jurisdictional agreement with up to two
3 County of Orange, 2019 Point in Time Final Report, July 30, 2019 (http://ochmis.org/wp-content/uploads/2019/08/2019-PIT-
FINAL-REPORT-7.30.2019.pdf)
Draft | May 2021 17THE CITY OF LAGUNA NIGUEL HOUSING
adjacent communities to develop at least one year-round shelter within two years of the beginning of the
planning period. As noted in Chapter IV the City allows emergency shelters in compliance with SB 2.
F. Assisted Housing at Risk of Conversion
This section identifies all residential projects in the city that are under an affordability restriction, along with
those housing projects that are at risk of losing their low-income affordability restrictions within the ten-year
period 2021 to 2031. This information is used in establishing quantified objectives for units that can be
conserved during this planning period.
1. Inventory of Assisted Units
Assisted projects in Laguna Niguel are shown in Table II-23. There are two assisted projects in the city, both
of which are eligible to convert to market rate within the 2021-2031 timeframe.
Table II-23
Inventory of Assisted Units –
Laguna Niguel
Total Units/ Expiration At Risk
Project Type of Assistance Affordable Units Project Type Date 2021-2031?
Alicia Park Apartments 223(a)(7)/221(d)(4)M 56/56 Sec. 8 2023 Yes
Village La Paz Section 8 NC 100/100 Sec. 8 2022 Yes
Sources:
City of Laguna Niguel Community Development Dept.
California Housing Partnership Corporation, 2021
2. Units at Risk
According to the California Housing Partnership Corporation, there are two assisted projects that are at-risk
during 2021-2031 in Laguna Niguel. In general, there are three actions that can result in the conversion of
public-assisted units:
1. Prepayment of HUD mortgages:
a. Section 221(d)(3) or (4)M – property owner receives either below-market interest rate or
market interest rate loans from HUD with a rental subsidy for tenants as well. The program
also allows for long-term mortgages (up to 40 years) that can be financed with Government
National Mortgage Association (GNMA) Mortgage Backed Securities.
b. Section 236 – property owner receives financial assistance from HUD to pay interest costs,
thereby reducing tenant rental costs. Rental subsidies may also be provided to the tenants.
c. Section 223(a)(7) – property owner is provided funds to refinance existing debt and to
complete necessary repairs, resulting in lower debt service and improved mortgage
security. It is available only to mortgages currently insured by FHA.
d. Section 202 – non-profit property owner receives a loan from HUD to pay for development
costs with a rental subsidy for senior tenants.
e Section 811 – property owner receives financial assistance from HUD to pay for
development costs of units for special needs.
Draft | May 2021 18THE CITY OF LAGUNA NIGUEL HOUSING
2. Expiration/opt-out of project-based Section 8 rental assistance contracts
The Section 8/Housing Voucher Choice Program provides rental subsidies to the property owner
of a pre-qualified project. The financial assistance pays the difference between the tenant’s
ability to pay and the contract rent.
An opt-out may occur if the property owner decides to pre-pay the balance of the HUD mortgage.
During this process, HUD may offer incentives to the property owner. Such incentives range
from refinancing the mortgage at a lower interest rate to establishing higher rents. If at any point
during this process the property owner fails to complete a HUD-required step, the Section 8
contract automatically rolls over for another 5-year period.
3. Other
Expiration of other affordability periods may occur when utilizing the following funding sources:
a. Low-income Housing Tax Credits (LIHTC)
b. Bond financing
c. Density bonuses
d. California Housing Finance Agency (CHFA)
e. Community Development Block Grant (CDBG)
f. HOME Program
At-Risk Status
Two assisted properties, representing 156 lower-income rental units, are at risk of conversion as identified in
Table II-23 above. Financial assistance mandates affordable income restrictions and occupancy that will
expire on the date shown.
• Alicia Park Apartments and Village La Paz – The use restrictions for Alicia Park Apartments
and Village La Paz are a result of HUD-issued Project Specific Section 8 Contracts that were
executed at the time the original FHA mortgages were originated. The purpose of the Project
Specific Section 8 contract is to ensure that the project’s units remain affordable to qualified,
low-income tenants for the life of the contract, which is offered at 15- to 20-year terms, and
require renewal every 5 years thereafter.
If the owners of Alicia Park Apartments and Village La Paz choose to opt-out of their Section 8
contracts, it would represent a loss of 156 units of affordable rental housing, a significant
decrease in Laguna Niguel’s available pool of affordable housing units.
The projects that are at risk of conversion contain a significant number of 3- and 4-bedroom units. Therefore,
loss of any large family units as well as the 1- and 2-bedroom affordable units would likely affect the already
burdened low-income rental population.
Cost Analysis
The primary factors used to analyze the cost of preserving low-income housing include:
1. Acquisition costs – depends on size, location, current sales figures.
2. Rehabilitation costs – average cost to rehabilitate - $40,000 (based on data compiled by the State
Department of Housing and Community Development’s Multifamily Housing Programs).
3. New construction costs – depends on size, construction materials, financing costs, and off- and
on-site improvements.
Draft | May 2021 19THE CITY OF LAGUNA NIGUEL HOUSING
4. Rental assistance – depends on the income of the household and Fair Market rents. As of 2021,
Fair Market rents for Orange County are as follows:
• Efficiency - $1,678
• 1-bedroom - $1,888
• 2-bedroom - $2,331
• 3-bedroom - $3,227
• 4-bedroom - $3,716
As shown previously in Table II-14, a very-low-income household of four persons can afford to pay $1,681
per month (including a utility allowance) for housing. This would require a monthly rental subsidy of $650,
or $7,800 per year for a 2-bedroom unit. Therefore, if affordability covenants were to expire on all of the 156
units in the at-risk projects, a total cost of approximately $1,216,800 per year would be required in order to
provide rental housing at comparable affordability levels.
Preservation Resources
Efforts by the City to retain the at-risk housing units must draw upon basic resources as follows:
• Organizational Resources - The following local agencies are potential organizations with
experience and capacity to assist in the preservation of at-risk units:
a. Orange County Community Housing Corp. (Santa Ana)
b. Jamboree Housing Corp (Irvine)
c. Mary Erickson Foundation (San Clemente)
d. National Community Renaissance of California (Rancho Cucamonga)
• Financial Resources – The following is a list of potential financial resources to be considered as
part of the City’s overall financial plan to retain affordable housing units. The City of Laguna
Niguel does not have a Redevelopment Agency.
a. Community Development Block Grant – The City currently receives approximately
$360,000 in CDBG funds from HUD annually.
b. Orange County Housing & Community Development Department – The County receives
annual funding from HUD to administer the Section 8 Housing Voucher Choice Program
and the HOME Program.
c. Affordable Housing Clearinghouse – serves a mortgage brokerage that specializes in
financing affordable housing projects.
G. Low- and Moderate-Income Housing in the Coastal Zone
The western edge of the city is within the Coastal Zone. Government Code Section 65590 et seq. prohibits
conversion or demolition of existing residential dwelling units occupied by low- or moderate-income persons
or families unless provision has been made for the replacement in the same city or county of those dwelling
units with units for persons and families of low- or moderate-income (excludes structures with less than 3
units, or less than 10 units for projects with more than one structure, among other exclusions).
Section 65590(d) further requires new housing development in the coastal zone to provide housing units for
persons and families of low or moderate income, or if not feasible, to provide such units at another location
within the same city or county, within the coastal zone or within three miles thereof.
Prior to the incorporation of Laguna Niguel in 1989, 727 housing units were permitted by the County within
the portion of the Coastal Zone that is now part of the City. One apartment project, Seaview Summit, was
Draft | May 2021 20THE CITY OF LAGUNA NIGUEL HOUSING
built prior to incorporation and included 48 deed-restricted lower-income units. The affordability covenants
on those units subsequently expired and the units converted to market rate. A small number of new single-
family infill homes have been built but no residential units have been demolished or converted within the
Coastal Zone since City incorporation in 1989.
H. 2021-2029 Housing Needs
1. Overview of the Regional Housing Needs Assessment
The Regional Housing Needs Assessment (RHNA) is a key tool for local governments to plan for anticipated
growth. The RHNA quantifies the anticipated need for housing during the period from July 2021 to October
2029. Communities then determine how they will address this need through the process of updating the
Housing Element of their General Plans.
The current RHNA was adopted by the Southern California Association of Governments (SCAG) in March
2021. The future need for new housing was determined by the forecasted growth in households in a
community as well as existing needs due to overpayment and overcrowding. The housing need was adjusted
to maintain a desirable level of vacancy to promote housing choice and mobility and to account for units
expected to be lost due to demolition, natural disaster, or conversion to non-housing uses. Total housing need
was then distributed among four income categories on the basis of the current household income distribution.
After the total housing need was determined for the SCAG region, RHNA allocations to individual
jurisdictions were developed by SCAG based on factors established in State law. The distribution of housing
need by income category for each jurisdiction was adjusted to avoid an over-concentration of lower-income
households in any community.
2. 2021-2029 Laguna Niguel Housing Needs
The total additional housing need for the City of Laguna Niguel during the 2021-2029 planning period is
1,207 units. This total is distributed by income category as shown in Table II-24.
Table II-24
2021-2029 Regional Housing Needs –
Laguna Niguel
Very Low* Low Moderate Above Mod Total
348 202 223 434 1,207
*50% of the Very Low Income need (174 units) is assumed to be ELI units
Source: SCAG 2021
It should be noted that the extremely-low-income category is included within the very-low-income category
in the adopted RHNA. As provided in Assembly Bill (AB) 2634 of 2006, jurisdictions may determine their
extremely-low-income need as one-half the need in the very-low category. A discussion of how the City will
accommodate this need is provided in Chapter III, Resources and Opportunities.
Draft | May 2021 21You can also read