Energy Strategy 2010-2020 - April 2010 Nottingham City Council
←
→
Page content transcription
If your browser does not render page correctly, please read the page content below

Nottingham City Council

Energy
Strategy
2010-2020
April 2010

Contents                                                                                                           Page
1.   Foreword ...................................................................................................... 3

2.   Executive summary .................................................................................... 5

3.   Introduction ................................................................................................. 8
     3.1. Purpose of the Sustainable Energy Strategy
     3.2. Nottingham’s achievements
     3.3. National and local energy generation targets
     3.4. Social and environmental effects of energy use
          3.4.1. Peak oil and energy security
          3.4.2. Fuel poverty and energy costs
          3.4.3. Climate change mitigation
          3.4.4. Climate change adaptation

4.   Vision and objectives for energy in Nottingham ....................................... 23
     4.1. Energy vision for Nottingham
     4.2. Scope of the Strategy
     4.3. Aims and objectives of the Strategy
     4.4. Strategic priorities
     4.5. Achieving the aims and delivering the
          objectives

5.   Energy supply and use in Nottingham ....................................................... 66
     5.1. Historical context, current energy
          use and generation patterns

6.   Financing the strategy ................................................................................. 74

7.   Communication, monitoring
     & review ..........................................................................................................76   76

8.   References and further reading ................................................................... 77

9.   Contributors credits ..................................................................................... 81

page | 2
1. Foreword by Councillors Graham Chapman and
   Katrina Bull
This Strategy and the associated Action Plan identifies the key
technologies and programmes required to enable Nottingham to
play its part in meeting the national and local targets on carbon
reduction and low or zero carbon energy generation. The Strategy
sets the headline targets and key strategic priorities; the Action Plan
details how the City can meet these targets. Implementation of the
Strategy will accelerate Nottingham’s development as the UK’s
leading City in low carbon energy security.
It is clear that rising energy and carbon costs over the coming years will create significant risks
and significant opportunities in Nottingham. As energy prices rise there will also be secondary
impacts with regards to the cost of food, goods and services, inflation, and potentially local
economic activity.

Conversely, there is also the potential to
generate revenue, economic activity and
jobs from investment in, and delivery of,
sustainable energy generation, fuel
supply, low carbon infrastructure,
technology supply chains and energy
services.

Significant and sustained investment will
be required to achieve the Government’s
2020 and 2050 carbon reduction targets
and ensure the City’s public services,
households and economy are protected
from the expected energy price inflation
of the coming decade.

Investment will be required across all sectors and in all areas of energy use, generation and
supply to ensure the necessary improvements in energy efficiency and use of renewables.

As well as increasing energy efficiency and energy generation through the use of technology, we
also need positive, practical community wide behaviour change and educational initiatives. We
need to support community initiatives wherever possible.

In addressing energy supply and consumption issues, the City will reduce carbon emissions and
the impact of fuel poverty. The City has the opportunity to create an energy environment that
protects key services, the economy and households from the impacts of declining energy
security, rising costs and some inevitable climate change, while meeting carbon reduction
targets.

                                                                                             page | 3
Through adopting a robust Energy Strategy that follows the national Low Carbon Transition
Strategy, Nottingham will provide a stable, low carbon energy environment and an attractive
place in which to live and do business even in challenging times.

The Strategy also underpins the City’s developing profile to attract and support businesses in the
emerging low carbon sector with a focus on low carbon building and construction.

For more than a 100 years social and economic development has been set against a background
of cheap energy, underpinned by abundant crude oil and natural gas; this is not the world in
which we will be operating in future years. Nottingham recognises the major challenge ahead.
The aim of the Energy Strategy is to ensure sustained investment of time and money into energy
saving and generation measures, to avoid major repercussions for households, businesses and
services.

“The challenge is not the technical feasibility of a low-carbon economy but making it happen.
Ensuring action will require strong leadership from government and a concerted response from
individuals and businesses”1.

Nottingham as a City is starting the low carbon transition from a
leading position. If any city in the UK can meet its part of the Government’s national
targets, it is Nottingham, but there is still a very long way to go. Nottingham is however
exceptionally well placed to remain the UK’s most energy
self-sufficient city.

Cllr Graham Chapman                       Cllr Katrina Bull

1
    CCC, 2009. Available at: http://www.theccc.org.uk/

page | 4
2. Executive Summary
This Strategy provides an overarching framework for the City’s
plans, programmes and initiatives relating to sustainable energy
supply and use to 2020: cutting emissions, maintaining energy
security, maximising economic opportunities, and protecting the
most vulnerable. The Strategy and the associated action plan will
ensure that Nottingham accelerates the development, use and value
of its energy resource and energy efficiency potential.
The Strategy responds to a number of key drivers; climate change, peak oil and energy security.
These drivers are recognised locally and nationally through policies and challenging targets that
need to be delivered within given timescales.

Targets

The Action Plan prioritises the delivery of:
•   A 26% reduction of carbon dioxide emissions against 2005 levels,
•   20% of the City’s own energy generated from low or zero carbon sources
by the target date of 2020, as set out in the local Sustainable Community Strategy2.

At a national level the Government’s Low Carbon Transition Plan3 and Renewable Energy
Strategy4 in particular provide very challenging targets. The Strategy details how we will meet our
proportional ‘pro rata per capita’ contribution to the national Renewable Energy Strategy targets,
which is estimated in the City at:
•   2% (37GWh) generation from small scale sources
•   12% (342.7GWh) generation from renewable heat sources

Nottingham’s Current Status

Nottingham is starting the low carbon transition from the front, with a considerable lead.
Between 2003 and 2006 the City reduced domestic gas consumption by 16%; the greatest fall of
all Local Authorities in the East Midlands and of all the Core Cities.

In 2006 we generated 3% of our own heat and power from renewables and waste, making
Nottingham the most energy self-sufficient City in the UK.

2
  City of Nottingham Sustainable Community Strategy 2020, Strategic Objective 2, 2020 Headline Targets (page 21).
Available at: http://www.nottinghamcity.gov.uk/onenottingham/CHttpHandler.ashx?id=10663&p=0
3
  The UK Low Carbon Transition Plan (2009). Available at:
http://www.decc.gov.uk/en/content/cms/publications/lc_trans_plan/lc_trans_plan.aspx
4
  The UK Renewable Energy Strategy (2009). Available at:
http://www.decc.gov.uk/en/content/cms/publications/lc_trans_plan/lc_trans_plan.aspx

                                                                                                        page | 5
We also generated 11.45% of our own heat and power from gas CHP (combined heat and power)
and renewables. Nottingham is the leading City in the country in distributed energy generation.
Generation of 11.45% of our own energy from low or zero carbon sources, against the 20%
Sustainable Communities Strategy target is a remarkable achievement and a very strong starting
point for the challenge ahead.

Key Actions

To meet the national and local targets for heat and power will be very challenging, even given
Nottingham’s leading position. This will require the development of all the City’s major renewable
and low carbon energy resources from large scale biomass to a rapid increase in the uptake of
domestic renewable energy systems.

Figure 1: Total targets for energy generation from Low or Zero Carbon sources – including gas CHP

The Action Plan alongside in the Energy Strategy represents a detailed map to achieve our local
and national 2020 targets. National targets for small scale electricity generation and renewable
heat steer us towards biomass fuel and renewable electricity generation.

In particular, to meet national and local targets for heat and power will require;
• More than doubling the size of the City district heating network
• Development of a local biomass processing and transfer site
• Significant capacity of new biomass CHP plant with associated district heating
• Consideration of a City anaerobic digester.

page | 6
Alongside energy generation, Nottingham will need to make a significant cut in energy demand to
provide a 26% reduction in carbon emissions to 1,329k tonnes CO2 per annum by 2020 as
stated in the Sustainable Communities Strategy, but also to enable the achievement of target
energy generation (reduction in demand eases proportional generation targets).

Figure 2: Targets for energy reduction by fuel source

The City Council will lead by example by targeting a 45% reduction in emissions by 2020. The
majority of emission cuts will however come from the domestic sector; reducing energy
consumption and reducing the impact of fuel price increases. The City will be able to achieve a
37.6% reduction in CO2 emissions from domestic energy efficiency by 2020. This will be
achieved through the work of the City Council, Nottingham Energy Partnership and local housing
associations working with householders and communities. A 23.4% reduction in CO2 emissions
is expected from industrial and commercial sector energy efficiency by 2020.

Significant savings of around 20% also need to be made in transport emissions. A further saving
of around 5% will be met from installing all the low or zero energy generation systems detailed in
the Strategy. Over all these saving should provide a total reduction of 28.3% by 2020.

The Challenge

Funding for the major energy generation, supply chain and energy efficiency programmes will be
the greatest challenge. This Strategy has identified the key strategic objectives and numerical
targets, the Action Plan details priorities for investment. These priority actions provide the best
carbon, energy and financial returns and will provide a focus for development over the next 10
years.

                                                                                           page | 7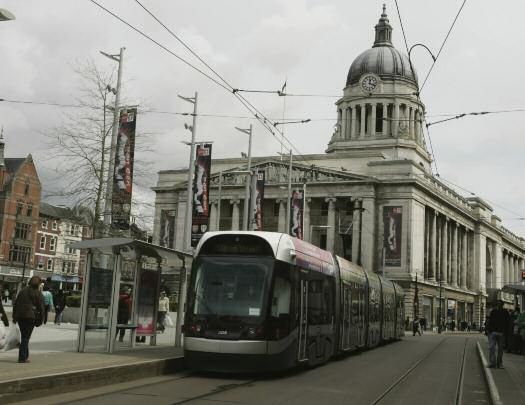
3. Introduction
3.1. Purpose of the Sustainable Energy Strategy
National policy, strategy and targets on energy supply and low carbon transition have all
advanced rapidly in the last 12 months5. There has been a step change in policies relating to
carbon reduction and energy security. This has been underpinned by the interdependent issues
of climate change, power supply security and peak oil. There is now a small window of
opportunity to meet the parallel global challenges of avoiding dangerous climate change,
preparing for peak oil and, against the national picture of potential power supply insecurity
towards 2017, ensuring continuity of affordable energy supply in Nottingham.

Nottingham City Council is the only Local Authority in the UK to have adopted a motion
recognising the need to respond to the forthcoming impact of Peak Oil6. The City is well placed
to take fast decisive action at local authority level to protect citizens, whilst ensuring that we
continue to reduce our carbon emissions.

The City Council has also recently adopted, though the Sustainable Communities Strategy, two
challenging 2020 targets:

•   20% of energy used to be produced within the Greater Nottingham area from renewable or
    low/zero carbon sources7;
•   26% reduction in CO2 emissions to 1,329k Tonnes CO2 per annum by 20208.

The Energy Strategy details how the City can meet these 2 targets.

Nottingham is also signed up to the European Covenant of Mayors9 which requires the city to
have a sustainable energy strategy and action plan by the end of 2009.

5
    In July 2009, the Department for Energy and Climate Change (DECC) published the UK Low Carbon Transition
    Plan. This comprehensive plan sets out how the country will meet the cut in emissions set out in the 2009
    Budget of 34% on 1990 levels by 2020. It aims to plot the UK’s move onto a permanent low carbon footing and
    to maximise economic opportunities, growth and jobs along the way. Alongside this and on the same date,
    DECC published the national Renewable Energy Strategy which maps out how the Government will deliver the
    UK’s target of getting 15% of all energy (electricity, heat and transport) from renewables by 2020, and the
    Department for Transport (DfT) published the Low Carbon Transport Plan which sets out how to reduce carbon
    emissions from domestic transport by up to 14% over the next decade. All of these key documents are
    available at: http://www.decc.gov.uk/en/content/cms/publications/lc_trans_plan/lc_trans_plan.aspx
6
    Nottingham City Council (NCC) (2008). Motion in the name of Councillor Bull – Forthcoming impact of Peak Oil.
    Internal minutes of the meeting of the Nottingham City Council, held at the Council House, Nottingham, on
    Monday 8th December 2008 at 3:15pm, pages 141-143.
7
    City of Nottingham Sustainable Community Strategy 2020, Strategic Objective 2, 2020 Headline Targets (page
    21). Available at: http://www.nottinghamcity.gov.uk/onenottingham/CHttpHandler.ashx?id=10663&p=0
8
    City of Nottingham Sustainable Community Strategy 2020, Strategic Objective 1, 2020 Headline Targets (page
    16). Available at: http://www.nottinghamcity.gov.uk/onenottingham/CHttpHandler.ashx?id=10663&p=0
9
    The Covenant of Mayors is a commitment by EU signatory towns and cities to go beyond the objectives of EU
    energy policy in terms of reduction in CO2 emissions through enhanced energy efficiency and cleaner energy
    production and use. The city of Nottingham became a signatory to the Covenant when the City Council publicly
    adhered to it on 8th December 2008. Further information at:
    http://www.eumayors.eu/covenant_cities/city_341/index_en.htm

page | 8
The timing of the Nottingham Sustainable Energy Strategy, Climate Change Strategy, Waste
Strategy and Local Development Framework planning process enable us to respond quickly and
effectively to the new national and international policies, setting Nottingham on the path to
meeting, and potentially exceeding, its responsibilities and taking a national lead in many areas in
relation to carbon and energy.

3.2. Nottingham’s achievements
Nottingham is already leading the UK in a number of key energy areas, particularly through the
work of the Nottingham Energy Partnership (NEP), EnviroEnergy10 (the district heating operator)
and the forward-thinking energy strategies of major local companies. From 2003-2007 domestic
gas consumption in the city fell by 16%; the largest fall of any local authority in the East Midlands
and of all the Core Cities. This puts Nottingham in the top 8% of local authorities in the UK for
domestic energy efficiency.

Nottingham is by far the most energy self-sufficient city in the UK. The city is also the 8th most
energy self-sufficient local authority.

In 2008, the UK as a whole generated 2.7% of non-transport energy from renewables and
waste11. In 2006, Nottingham City provided almost 155 GWh, just under 3% of non-transport
energy consumption, from renewables and waste; largely due to the ‘Energy from Waste’ plant
incinerator at Eastcroft. A further 39.2 GWh of electricity was exported to the national grid from
the Beeston weir hydro scheme and the City’s gas CHP heat station at Enviroenergy. The second
most energy self-sufficient city, Coventry, generated only 0.74% of its own non-transport energy
from renewables and waste in 2006 (Coventry has a smaller ‘Energy from Waste’ plant).

10
     http://www.enviroenergy.co.uk/
11
     Figures taken from: http://www.decc.gov.uk/en/content/cms/statistics/publications/ecuk/ecuk.aspx

                                                                                                        page | 9
Nottingham City also hosts 38.3MWe
                                                                     of installed gas Combined Heat and
                                                                     Power (CHP) capacity across 4 large
                                                                     and 6 small sites. This represents 51%
                                                                     of the installed CHP capacity in the
                                                                     East Midlands.

                                                                     In 2006 the City’s gas CHP
                                                                     plants generated an estimated
                                                                     191 GWh of power and 372
                                                                     GWh of heat. This means that
                                                                     11.45% of Nottingham’s total
                                                                     energy consumption12 and
                                                                     14.3% of total electricity
                                                                     consumption was generated
                                                                     within the City in 2006. This
                                                                     energy generation was largely from the
                                                                     Alliance Boots complex, Imperial
                                                                     Tobacco, The Queens Medical Centre
                                                                     (QMC) and the City Enviroenergy heat
                                                                     station. The actual percentage could
                                                                     become even higher, as a considerable
                                                                     amount of power generated in the City
                                                                     is currently exported to the National
                                                                     Grid.

These figures are remarkable; they place Nottingham in a leading
position in the UK and make the City a strong competitor with other
leading European ‘low energy’ cities.
Our leading position is bolstered by the City district heating network; the largest and longest
established heat network in the UK. And on top of that our high profile partnerships have enabled
significant success in demand reduction, particularly in domestic energy, and are set to continue
e.g. Nottingham Warm Zone, Community Energy Saving Programme.

Significant improvements in low carbon transport have also been achieved through
implementation of the first two Greater Nottingham Transport Plans, overseen by the Greater
Nottingham Transport Partnership. Modern bus fleets, together with the growing city tram
network evidence Nottingham’s commitment to low carbon transport.

The City Council also worked in partnership to develop the ‘Nottingham Declaration on Climate
Change’13, putting the City’s name firmly at the heart of the local authority Climate Change
agenda.

12
   Total energy consumption includes domestic, industrial and commercial energy, and transport-related energy; this
% reflects our progress as a city against the 20% Sustainable Communities Strategy target.
13
   Available at: http://www.energysavingtrust.org.uk/nottingham

page | 10
Figure 3: The City of Nottingham’s average annual CO2 emissions per capita (in green), represented against that of
other cities (all emissions measured in tonnes of CO2). Source: Local and Regional CO2 Emissions Estimates for
2005-2007 06/11/2009 AEA technology.
page | 113.3. National and local energy generation targets
The UK's energy policy aims to meet the challenge of reducing carbon emissions as well as
providing a secure and safe supply of affordable energy. Renewable energy is seen as one of the
key elements of the national strategy. In particular the national strategy will work towards
decarbonising the energy supply, which will help to meet long term climate change targets. As
part of the EU Climate and Energy package, the UK has committed to sourcing 15% of its energy
(both heat and power) from renewable sources by 202014.
The target of sourcing 15% of energy from renewable sources nationally needs to take into
account the changes to demand for energy. It is expected that even while the population grows,
national energy consumption will decrease from 1695 TWh in 2008 to 1590 TWh by 2020, a total
fall of 6.2% or a per capita fall of 13.7%15. Energy efficiency is therefore also an important part of
the overall national, regional and Nottingham City energy policies.
Nationally the renewable energy targets could be achieved from different sectors. The
Government has decided to take the following16 as the lead scenario:
• 30% of electricity demand met by renewables (2% from small-scale sources and 28% from
large scale renewables);
• 12% of heat demand from renewables;
• 10% of transport demand from renewables.
If the small scale power and heat targets are apportioned per capita (with a 2008 baseline
population), by 2020 Nottingham will need to generate and supply locally around 37 GWh of
electricity per annum from small scale renewable generation and 342.7 GWh of heat from
renewables. Within Nottingham, already in 2006:
• 8 GWh of our electricity came from small scale sources, such as solar electric systems and
the Beeston weir hydro scheme (i.e. 22% of our ‘national’ target)
• around 127 GWh of our annual heat demand was met by renewables and waste, through the
district heating network (i.e. 37% of our ‘national’ target)
While totalling 56 GWh in 2006, electricity generated from the district heating CHP scheme from
renewables and waste is not ‘small scale’. Local small scale generation will need to expand
rapidly to meet our part of the national 2020 targets.
Nottingham as a City is starting the low carbon transition from a leading position. If any city in the
UK can meets its part of the Government’s national targets, it is Nottingham, but there is still a
very long way to go. Nottingham is however exceptionally well placed to remain
the UK’s most energy self-sufficient city.
14
The UK Renewable Energy Strategy (2009). Page 10. Available at:
http://www.decc.gov.uk/en/content/cms/publications/lc_trans_plan/lc_trans_plan.aspx
15
Population projections by the Office for National Statistics (ONS): http://www.statistics.gov.uk
16
The UK Renewable Energy Strategy (2009). Page 8. Available at:
http://www.decc.gov.uk/en/content/cms/publications/lc_trans_plan/lc_trans_plan.aspx
page | 12The Government has set a series of interim targets and carbon budgets from 2011 to 2018 to
ensure the UK is on track to meet the overall 2020 target17. Regionally, there are 2011, 2016 and
2021 targets. The City Sustainable Energy Strategy also provides ambitious, practicable targets
for each of the 5-year carbon periods to 2021 (set by the Committee on Climate Change, CCC18,
in respect of the national 80% CO2 reduction target and ratified in the 2009 budget up to 2020).
Figure 4: The Nottingham Sustainable Energy Strategy provides a blueprint for how we will realise and maximise the
City’s energy resources to 2020.
This City-wide Sustainable Energy Strategy will enable Nottingham to take
and maintain a leading role in the UK in energy security and carbon reduction.
17
The UK’s Climate Change Act (CCA, 2008) creates a new approach to managing and responding to climate
change in the UK. At the heart of the Act is a legally binding target to reduce the UK’s greenhouse gas emissions to
at least 80 % below 1990 levels by 2050, to be achieved through action at home and abroad. To drive progress
towards this target, the Act introduces five year “carbon budgets”, which define the emissions pathway to the 2050
target by limiting the total greenhouse gas emissions allowed in each five year period, beginning in 2008. Alongside
Budget 2009, the Government announced that it agreed with the Committee on Climate Change (CCC)'s approach
on carbon budgets and intended to set the levels of the budgets now for the period 2008-2022. These ‘interim’
budgets require a reduction in greenhouse gas emissions by at least 34% by 2020, relative to 1990 levels. The first
three carbon budgets were designated as 2008-12, 2013-17, and 2018-22. Further details available at:
http://www.hm-treasury.gov.uk/bud_bud09_carbon.htm
18
The Committee on Climate Change (CCC) is an independent body established under the Climate Change Act
(CCA, 2008) to advise the UK Government on setting carbon budgets, and to report to Parliament on the progress
made in reducing greenhouse gas emissions. Further information at: http://www.theccc.org.uk/
page | 133.4. Social and environmental effects of energy use 3.4.1. Peak oil and energy security “Energy reserves are concentrated in some of the most unstable parts of the world. That’s an issue of national security. There is no crisis but we can never be complacent. As we move out of recession, the global grab for energy will resume in earnest, consumption is predicted to rise, and with it, prices”19. “Complete energy independence is an unrealistic goal but there is much we can do to insulate ourselves from the risks, in large part by driving our climate policies even further, quicker. We must be far smarter with the energy we use and invest in home grown energy sources, such as new nuclear and renewables without delay20.” By 2025, the UK will be importing 57% of its oil up from 15% in 201021. There has been no appreciable increase in global conventional crude oil output since 2005 despite increases in drilling rig activity (see Figure 5 and 6). The economic crisis over the last 12 months has also reduced global crude oil output and investment in new exploration. This issue has been recognised by Nottingham City Council in the December 2008 motion22 acknowledging the forthcoming impact of Peak Oil. Figure 5: Global crude oil output between 1997 and 2009 (measured in million barrels per day). Source: EIA, 2009. 19 DECC (2009). Energy Security: A national challenge in a changing world. Report by Malcolm Wicks MP. Available at: www.decc.gov.uk/en/content/cms/what_we_do/change_energy/int_energy/security/security.aspx 20 DECC (2009). Energy Security […] Available at: www.decc.gov.uk/en/content/cms/what_we_do/change_energy/int_energy/security/security.aspx 21 Analytical Annex, Table 19, UK Low Carbon Transition Plan (2009). Available at: http://www.decc.gov.uk/en/content/cms/publications/lc_trans_plan/lc_trans_plan.aspx 22 Nottingham City Council (NCC) (2008). Motion in the name of Councillor Bull – Forthcoming impact of Peak Oil. Internal minutes of the meeting of the Nottingham City Council, held at the Council House, Nottingham, on Monday 8th December 2008 at 3:15pm, pages 141-143. page | 14
Figure 6: Number of active oil rigs worldwide between 1997 and 2009. Source: EIA, 2009.

The International Energy Agency (IEA) now believe that we will pass geological peak oil for
conventional crude oil within 10 years, then all oil, including non conventional sources, within 20
years. The IEA also predict a supply crunch due to industry underinvestment in 5 years with
tightening demand and supply pressures pushing up prices from as soon as 2010. It can also be
seen from Figure 523 that we may already have reached the peak of conventional oil output, given
that the amount of crude oil available worldwide has not increased since 2005, despite demand
and exploration growth.

Actual global crude oil output is limited by political and economic factors well before geological
peak oil is reached. Many credible sources including several governments, independent expert
bodies and major oil companies believe we will reach peak oil well in advance of IEA projections.
We will see the economic impacts of falling global crude oil supply well before 2020; in reality,
with an oil price spike of $147 in 2008, we are already experiencing them.

Spikes in the price of crude oil (see Fig.7), followed by those in energy, food and inflation as
experienced in 2008, will become more frequent and more severe, as global oil supply falls and
competition for energy resources increases. The IEA has pointed out that any recovery of the
global economy will inevitably lead to a recovery in oil demand and consequential steep energy
commodity price rises.

As reflected in the Nottingham City Council’s Peak Oil motion24, these impacts will clearly have
significant effects on the residents and the economy of Nottingham.

23
   Data from the US Energy Information Administration (EIA): http://www.eia.doe.gov/
24
   Nottingham City Council (NCC) (2008). Motion in the name of Councillor Bull – Forthcoming impact of Peak Oil.
Internal minutes of the meeting of the Nottingham City Council, held at the Council House, Nottingham, on Monday
8th December 2008 at 3:15pm, pages 141-143.

                                                                                                      page | 15
Figure 7: Global crude oil price between 1997 and 2009 (measured in $ per barrel). Source: EIA, 2009. In the UK, over the coming 15 years, we also face a far heavier reliance on imported gas by 2020. Varying estimates suggest that the UK will be importing 45-80% of its gas25 up from 31% in 2010. Gas prices and supply security in Europe have proved volatile in recent years with increased friction with Russia, Europe’s largest single gas supplier. While the UK has recently increased pipeline connections to access Norwegian gas and has developed new supply agreements and infrastructure to import liquefied natural gas, we will still feel the sting of a cold wind blowing from Russia, if Eastern European gas supply is again restricted. Peak oil and security of fossil fuel supply represent an urgent cross cutting risk, with social and economic impacts from rising commodity prices, including inflation and potential further economic stagnation. A stable economic environment is essential in the City, while we make the transition to a low carbon economy. This can only be achieved through intense work on energy efficiency, generation and low carbon sector growth. In terms of security of energy supply, the UK is also facing a potential electricity generation gap, as a significant proportion of the UK’s electricity generating capacity needs to be replaced over the next 10 years. This is identified in the supporting documents to the Government Low Carbon Transition Plan26. Under EU legislation27 around one-third of the UK’s coal and oil fired power generating capacity will need to be decommissioned by 2020. Several nuclear power stations are also due for decommissioning in the same timeframe. The intention is to fill this gap by increasing the UK’s gas powered generation in the short term and lifting renewable energy capacity from a current 5.5% to 28% over the next 10 years, largely from wind power. 25 DECC (2009). Energy Security […] Available at: www.decc.gov.uk/en/content/cms/what_we_do/change_energy/int_energy/security/security.aspx 26 Implementation of the EU 2020 Renewables Target in the UK Electricity Sector. RO Reform, June 2009. Available at: http://www.berr.gov.uk/files/file46778.pdf) 27 EU Large Combustion Plants Directive (LCPD) (LCPD 2001/80/EC). Available at: http://eur-lex.europa.eu/LexUriServ/site/en/oj/2001/l_309/l_30920011127en00010021.pdf page | 16
This intensive investment required to increase the UK’s renewable capacity almost five-fold over
a 10-year period gives rise to concerns over spare capacity. By 2017 we can expect only 5-10%
spare capacity, as opposed to 15% today. Unexpected power station shutdowns could have a
more serious impact on the UK grid power supply. If the country cannot build wind capacity at
the rates proposed, and the intended plant closures go ahead, then Nottingham, along with the
rest of the country would need to plan for a far less reliable power supply from the UK grid.

Nottingham is already the UK’s most energy secure City, due to the large
district heat and private wire network. Given the uncertain future energy
security background, we intend to build on our leading position by increasing
the use of private wire power supply, backup generation and distributed
power in the City of Nottingham, as a key strategic aim. Private wire power
supply should be focussed on supporting key infrastructure and public sector
buildings, while homes and businesses will be actively supported to invest in
renewable energy technologies, energy efficiency and increasingly be offered
connection to the City’s district heating network.

3.4.2. Fuel poverty and energy costs

“The era of cheap energy is over”28. With peak oil and a heavier reliance on gas powered
generation, we can expect further retail energy cost rises over the coming years, above those
expected through the need to deliver the UK’s low carbon transition. This will impact all fuel types
including petrol, diesel, gas, electricity, oil, liquid petroleum gas (LPG) and even wood fuel costs
as demand rises for alternatives.

Higher energy prices have had a universal impact but have been particularly severe on low
income households in ‘hard to heat’ homes. These households spend a disproportionate amount
of their income on fuel, and are said to be in ‘fuel poverty’ – a fuel poor household needs to
spend more than 10% of its income on fuel in order to heat the home to an adequate standard.

The Governments Fuel Poverty Strategy set a target to eradicate fuel poverty by 2016. The
unprecedented increase in the price of energy has put this target in doubt.

The latest ‘Annual Report on Fuel Poverty Statistics’ (DECC Oct 2009) includes the following;

*      Since the fuel poverty low of 2004, domestic energy prices have risen by 80% between 2004
       and 2008, driving the trend in fuel poverty in recent years.
*      Projections for England indicate a likely upper bound of around 4.6m households in 2009, up
       from 2.4m in 2006.

These figures represent a 90% increase in fuel poverty in 3 years, with a 21%
fuel poverty rate for England.

28
     John Hutton, Business Secretary - Sept 08

                                                                                          page | 17
Energy prices have now stabilised. The next price
increases will be in response to Government policy
and economic recovery. The Government estimates
that, taken in isolation (i.e. before the impact of
scarcity, competition and energy efficiency
measures), the investment outlined in the national
Renewable Energy Strategy will increase household
electricity costs by 15% and gas costs by 23% by
202029. Non-domestic bills could rise by up to 21%30.
However, Ofgem's review of Britain’s energy markets,
Project Discovery31 takes market factors into account
and models 4 different scenarios, of which their worst
case scenario admits the possibility of the average
annual bill rising from £1,247 in 2009 to £1,995 in
2016, a further 60% increase in domestic fuel bills.
The other scenarios point to a more modest 14% to
25% increase above the level of inflation by 2020.
Whichever model proves to be right we cannot
escape rising energy cost. We can however minimise
the impact through targeted energy efficiency
measures and local generation.
The Government response to rising energy prices and fuel poverty is the extension of existing
energy efficiency programmes and funding of new schemes.
The major existing schemes (CERT – Carbon Emissions Reduction Target - and Warm Front) are
targeted to the basic measures of cavity wall and loft insulation, with heating repairs and
improvements for the most vulnerable. The basic measures will be completed by 2015.
A major problem remains with existing solid wall properties as identified in the Government’s
Household Energy Management Strategy. This strategy outlines the need to insulate 7 million
homes by 2020 with expensive solid wall insulation (i.e. more than 10 times the cost of cavity wall
insulation). There has been much discussion on how to identify methods of funding for much
more costly measures including for microgeneration.
Nottingham has maximised national funding opportunities for domestic energy efficiency work
through the development of local programmes, and we will continue to develop funded
programmes wherever possible:
• The Greater Nottingham Healthy Housing Service has concentrated on the fuel poor over the
last 10 years,
• Nottingham Warm Zone offers the best prices in the East Midlands for insulation,
• Other projects under consideration include a major solid wall insulation programme and a
pilot to test methods of financing renewables and insulation in the private sector.
29
The UK Renewable Energy Strategy (2009). Page 19, Section 5.2. Available at:
http://www.decc.gov.uk/en/content/cms/publications/lc_trans_plan/lc_trans_plan.aspx
30
The UK Renewable Energy Strategy (2009). Page 184, Section 7. Available at:
http://www.decc.gov.uk/en/content/cms/publications/lc_trans_plan/lc_trans_plan.aspx
31
Available at:
http://www.ofgem.gov.uk/markets/whlmkts/discovery/Documents1/Discovery_Scenarios_ConDoc_FINAL.pdf
page | 18Rising energy prices impact on all sectors. The
importance of energy issues in relation to
Nottingham’s public buildings in particular, as
essential social infrastructure, should not be
underestimated. Not all communities will be well
equipped financially or socially to adapt to climatic
and energy cost changes, however it is essential that
key public services are not also eroded by rising
costs, at times when they may be needed most.
As well as offering energy saving
measures to every household in
Nottingham, the City Council will show
leadership in demonstrating carbon
reduction, energy self-reliance and
sustainability within its own buildings and
operations.
3.4.3. Climate change mitigation
Climate change mitigation refers to actions that reduce our contribution to the causes of climate
change. This means reducing our emissions of greenhouse gases (GHGs), such as carbon
dioxide (CO2), through energy efficiency and using alternative forms of transport and energy32.
It is now widely accepted amongst the scientific community that if the world continues emitting
greenhouse gases due to human activity at today’s levels, then average global temperatures
could rise by 4°C by as early as 2060 and up to 6°C by the end of this century33. Alongside
frequent and unpredictable extreme weather events, these temperature rises will bring severe and
permanent changes to regional climates with impacts on global economies and socio-political
instability; resulting in growing conflicts, public health related deaths and migration of peoples. It
is important to note that early action could prevent some of the worst excesses of climate
change.
To avoid the most dangerous impacts of climate change, average global temperatures
must rise by no more than 2°C , and that means that global emissions must
start falling before 2020 and then fall to at least 50% below 1990 levels by 2050.
In recognition of the above, the UK has committed to cut its own greenhouse gas emissions by
34% from 1990 levels by 202035, and potentially by 42% if other countries play their part at the
global climate negotiations. The UK will make an above average contribution within the EU,
32
http://www.ukcip.org.uk/index.php?option=com_content&task=view&id=73&Itemid=186
33
United Nations Environment Programme (UNEP) (2009). Climate Change Science Compendium. Available at:
http://www.unep.org/compendium2009/
34
At the G8 summit held in L’Aquila, Italy, in July 2009, world leaders agreed that the increase in global average
temperatures should not exceed 2 degrees Celsius over pre-industrial levels by 2020.
http://www.unep.org/Documents.Multilingual/Default.asp?DocumentID=593&ArticleID=6245&l=en
35
Climate Change Act, 2008.
page | 19reflecting our relatively high income and by 2050 cut CO2 emissions by 80%. This commitment
has resulted in the Government setting detailed carbon budgets nationally and, effectively, for
large organisations, through the Climate Change Act36.
The City of Nottingham will have to play its part in achieving these challenging cuts, to be fed
directly into the national picture. Action to reduce CO2 emissions at local level will also help to
reduce fossil fuel reliance and enhance energy security, create new economic opportunities and
bring wider environmental benefits.
The direct and indirect dangers of climate change cannot be overestimated37.
The window of opportunity to take effective action to avoid catastrophic
climate change is rapidly closing. The consequences of inaction will endanger
the livelihoods of current generations, and condemn generations to come to
an uncertain future of widespread human adversity, ecological disasters and
political, social and economic instability.
3.4.4. Climate change adaptation
Despite efforts to avoid dangerous climate
change, the levels of greenhouse gases in
the atmosphere are already sufficient to
guarantee some level of climate change.
Indeed we are already locked into around
40 years of unavoidable change38.
The UK Climate Impacts Change
Programme (UKCIP)39 has predicted that
the East Midlands will continue to get
warmer, wetter and windier, with more
storms and flooding in the winter and more
droughts in the summer. This could have
some very severe consequences for the
city of Nottingham e.g. increased
temperatures, evaporation and changing
rainfall patterns would mean less water
available from the River Trent and Derwent
valley reservoir system, exacerbated by an
increased likelihood of summer droughts
and higher water demand for irrigation.
36
Further details available at: http://www.hm-treasury.gov.uk/bud_bud09_carbon.htm
37
In 2006, the Stern Review concluded that the costs of uncontrolled climate change could be in the range of 5% to
20% of global gross domestic product (GDP) per year, averaged over time.
38
United Nations Environment Programme (UNEP) (2009). Climate Change Science Compendium. Available at:
http://www.unep.org/compendium2009/
39
http://www.ukcip.org.uk/index.php?option=com_content&task=view&id=353&Itemid=408
page | 20Figure 9
page | 21The actions we take now, if sufficient, will ensure that towards the end of the next 40 years the climate may start to stabilise. However we will still have to adapt to cope with some level of change, which could potentially affect all systems that support our current lifestyle and on which we directly depend, such as water supply, agriculture and farming, manufacturing, industry, transport, health provision, tourism and recreation, etc. In terms of delivery of a City-wide Energy Strategy, we need to consider if the actions proposed will work in a hotter, wetter, windier and all-in-all more unpredictable environment. Buildings constructed now cannot be built to the average climate of the last 20 years; they must be built to the next 20 years’ climate. This will, for example, require the capacity for comfort cooling to be considered in schools, health centres and offices. Having to retrofit cooling later will increase energy consumption, running costs and carbon emissions in the City and would not be as efficient as having designed buildings and systems that would require minimum cooling from the start. The above highlights the urgent need to place adaptation at the heart of the planning, design and building processes for new infrastructure, across all areas; from the national picture via the Building Regulations, to the regional and local levels via the planning and strategic regeneration frameworks, and through to the various capital investment programmes to deliver development. page | 22
4. Vision and aims for energy in Nottingham
4.1. Energy vision for Nottingham
 To make sure Nottingham is a future-proof city, including:

 •      A city insulated against high energy prices.
 •      Secure, low carbon energy supply and services available for business, public
        and domestic sector.
 •      A city prepared for climate change and peak oil.
 •      A city leading on growth in low carbon jobs, industries, services and
        training.
 •      A city exemplar of integrated low carbon heat, power and transport.
 •      An exemplar of neighbourhood community energy solutions.
 •      A smart city where energy flows are planned, mapped and monitored.

 These key energy ambitions will reinforce and help to deliver the long-term vision of the
 Nottingham Sustainable Community Strategy (p.9, Nottingham’s Long Term Vision, SCS, 2009).

 “We will do this by being radical, bold and daring to be different”.

4.2. Scope of the Strategy
Setting SMART40 targets and identifying key strategic objectives, programmes and technologies
to meet those targets across:

•      Low or zero carbon energy generation;
•      Domestic energy efficiency;
•      Education and behaviour change;
•      Business and public sector energy efficiency;
•      Growth in energy and energy services sector economic activity and employment
•      Transport energy.

4.3. Aims of the Strategy

Aim 1 – Reduce energy use in public sector infrastructure.
Aim 2 – Reduce energy use in domestic properties and tackle fuel poverty.
Aim 3 – Support increased energy efficiency in city businesses.
Aim 4 – Develop alternative energy sources, supply chains and services.
Aim 5 – Support low carbon transport infrastructure.
Aim 6 – Create local jobs and opportunities in energy sector businesses.
Aim 7 – Develop strong external & community partnerships.
Aim 8 – Support local community energy initiatives.

40
     SMART: Specific, Measureable, Attainable, Realistic and Timely.

                                                                                      page | 23
4.4. Strategic objectives
There are a number of key strategic objectives that are essential to ensure the delivery of the
aims of the Sustainable Energy Strategy:
1. The city’s unique strength in energy self-sufficiency will be used to promote Nottingham in
the UK and Europe as the first choice for location of sustainable energy related and green
tech business, innovation and growth.
2. Major capital investments detailed within the Energy Strategy and its associated Action Plan
to be assessed for delivery through innovative partnerships, including with Enviroenergy, the
City’s Energy Services Co (ESCO) and district heating provider. This will enable Enviroenergy
to build a mixed portfolio of generation and income for continuous re-investment in energy
efficiency and generation in Nottingham.
3. To develop the City’s installed low or zero carbon energy generation and distribution capacity
in line with the detailed targets in the Sustainable Energy Strategy.
4. To reduce local authority, domestic and ‘industrial and commercial’ energy consumption in
Nottingham in line with the detailed targets.
5. NCC will work to ensure local planning policy, and local authority capital procurement
supports the timely delivery of the Sustainable Energy Strategy, through developing and
setting rigorous, evidenced, local targets for carbon and energy sustainability in new
development.
6. To develop resource and maintain a prioritised Action Plan and delivery management
structure including key partners and technical experts to deliver the Strategy, with an annual
review cycle for the Action Plan and review cycles aligned with national carbon budgeting
periods for the Strategy.
7. To set transport related carbon emissions reduction and technology targets in the
forthcoming 3rd Local Transport Plan which are aligned with the Energy Strategy and aim to
exceed the national Low Carbon Transition Plan targets by 2020. At this stage an indicative
target of 20% reduction is recommended.
8. To work closely in partnership with business, universities and technology partners to ensure
Nottingham accelerates the process and maximises the impact of demand led innovation in
energy technology and management within the city
9. The City and partners will support the development of local and grass roots organisations
seeking to enable their communities to reduce carbon footprints, energy bills and adapt to
inevitable climate change and peak oil.
page | 244.5. Achieving the aims and delivering the objectives
Table 1: Summary of the key targets for energy efficiency to 2020. Aims 1 to 4 and their associated targets focus on energy efficiency. A
figure of 20% from transport reductions has been allowed for in relation to Aim 5. The statutory target will need to be committed to via the
preparation and adoption of the 3rd Local Transport Plan.
Table 1: Summary of Nottingham Sustainable Energy Strategy’s key targets 1-7 for energy efficiency, 2006 to 2020.
SES Consumption Target 2006 Tonnes 2011 Tonnes 2016 Tonnes 2021 Tonnes
Target (GWh) CO2 (GWh) CO2 (GWh) CO2 (GWh) CO2 41
No.
1 City Council Electricity 45.5 24,923 39.4 21,580 31.6 17,295 28.40 12,212
2 City Council Gas 112 23,078 101 20,798 76.5 15,767 68.9 14,189
3 Domestic Electricity 522.5 286,330 490 268,520 459.7 251,916 435.5 187,265
4 Domestic Gas 1,919.0 395,314 1,296.1 267,003 1,218.9 251,085 1,157.1 238,354
5 Non-domestic Elec. 1,007.9 552,329 982.7 538,520 957.5 524,710 907.1 390,053
(inc. City Council) 42
6 Non-domestic Gas 1,447.4 298,164 1,399.6 288,318 1,351.8 278,471 1,269.3 261,476
(inc. City Council) 42
7 Coal 57.53 18927.37 57.53 18927.37 0.00 0.00 0.00 0.00
Oil 231 64,680 231 64,680 231 64,680 231 64,680
Total 5,185 1,615,745 4,457 1,445,967 4,219 1,370,862 4,000 1,128,402
% saving on 2006 0.0% 0.0% 14.0% 10.5% 18.6% 15.2% 22.9% 30.2%
Nottingham City transport 1,397.20 377,940 TBC TBC TBC TBC 1,117.70 302,352
energy use
% saving 0% 0% TBC TBC TBC TBC 20% 20%
Grand Total 6,583 1,993,685 TBC TBC TBC TBC 5,118 1,430,754
41
Assumes electricity grid intensity has fallen to 0.43kg CO2e/kWh (the current grid marginal factor) with large scale roll out of renewables, nuclear and CCGT.
page | 25
42 Nottingham City ‘industrial and commercial’ figures include ‘Nottingham City Council’.Figure 10: Targets for energy reduction by fuel source Note If the indicative 2020 20% reduction target for transport CO2 emissions in Aim 5 and the 30.2% target for CO2 emissions implied within targets 3, 4, 5, 6, 7 and 8 are delivered, the City will be able to reduce its emissions to 1,431Kt CO2 per annum, a 21% reduction on the Sustainable Communities Strategy 2005 baseline (1810Kt); the SCS target is a 26% saving on 2005 to 1,329Kt CO2 per annum by 2020. Additional carbon savings of around 6.2% on the SCS 2005 baseline will be associated with increasing the amount of low carbon energy installed. This will enable the City to reach a 27% carbon saving against SCS 2005 baseline; this would represent a 33% saving against the 2006 energy strategy baseline. This is possible as not all city emissions sources were counted in the 2005 SCS baseline. page | 26
AIM 1: REDUCE ENERGY USE IN PUBLIC SECTOR
INFRASTRUCTURE
 Strategic Objective 4: To reduce local authority, domestic and ‘industrial and commercial’
 energy consumption in Nottingham in line with the detailed targets.

With rising energy prices, a tighter public purse and a need to show strong community leadership
in carbon reduction, it is essential that public sector buildings and services become lean, clean
energy users.

                                                             National Government and the wider public
                                                             sector are expected to lead the way in carbon
                                                             reduction and energy saving. Targets have
                                                             been set to reduce the carbon emissions from
                                                             the whole Government’s own estate by 30%
                                                             by 202043.

                                                             Ensuring the security of affordable, reliable
                                                             low carbon energy supplies for key public
                                                             services such as health, fire, police and
                                                             schools is essential.

                                                             Many local public services now fall under the
                                                             Governments’ mandatory Carbon Reduction
                                                             Commitment (CRC)44. Nottingham City
                                                             Council is a full participant in the CRC carbon
                                                             trading mechanism and will have its
                                                             performance shown on a league table
                                                             annually.

43
   Sustainable Operations in the Government Estate (SOGI) targets. Available at:
http://www.defra.gov.uk/sustainable/government/gov/estates/index.htm
44
   The CRC Energy Efficiency Scheme (formerly known as the Carbon Reduction Commitment) is the UK's
mandatory climate change and energy saving scheme, due to start in April 2010. It is central to the UK’s strategy for
improving energy efficiency and reducing carbon dioxide (CO2) emissions, as set out in the Climate Change Act
2008. It has been designed to raise awareness in large organisations, especially at senior level, and encourage
changes in behaviour and infrastructure. The scheme amended title serves to better reflect the CRC’s focus on
increasing energy efficiency, and is designed to tackle CO2 emissions not already covered by Climate Change
Agreements and the EU Emissions Trading Scheme. The scheme will cover large public and private sector
organisations, who are responsible for about 10% of the UK’s emissions. This will affect around 20,000 organisations
such as schools, large NHS trusts and local authorities.
Further information available at: http://www.decc.gov.uk/en/content/cms/what_we_do/lc_uk/crc/crc.aspx

                                                                                                         page | 27
The City Council also has a duty to report on national indicator 185 (NI185) which represents the
local authority’s own emissions45.
➢ Target 1: Reduction in electricity use from City Council’s own estate.
➢ Target 2: Reduction in gas use from City Council’s own estate.
Both Targets 1 and 2 are reflected in the City Council’s internal Local Authority Carbon
Management Plan (LACM), and are summarised in the following table:
Table 2: NCC’s electricity and gas consumption for 2006 and predicted/targeted for future
years. Source: NCC.
1. Nottingham City Council’s 2. Nottingham City Council’s Gas
Year
Electricity consumption (GWh) consumption (GWh)
2006 45.48 112.03
2011 39.38 100.96
2016 31.56 76.54
2021 28.40 68.88
45
National Indicator NI 185: CO2 reduction from local authority operations:
http://www.decc.gov.uk/en/content/cms/what_we_do/lc_uk/loc_reg_dev/ni185_186/ni185_186.aspx
page | 28AIM 2: REDUCE ENERGY USE IN DOMESTIC PROPERTIES AND
TACKLE FUEL POVERTY
Strategic Objective 4: To reduce local authority, domestic and ‘industrial and commercial’
energy consumption in Nottingham in line with the detailed targets.
Between 2003 and 2007 Nottingham’s domestic gas consumption fell by 16%, one of the largest
falls in domestic gas consumption of any local authority in the UK and the largest fall for a local
authority in the in the East Midlands. Nottingham is currently in the top 8% of local authorities for
domestic energy efficiency improvement.
Electricity use in the city fell by 3.48%,
a little less than the UK average of
4.5%.
In 2006 domestic energy consumption
represented 36% of Nottingham’s total
energy use.
In 2007 average energy use in the city’s
domestic properties was 16,488kWh
gas and 4,119kWh electricity per
annum. This is significantly lower than
the national and regional averages46.
This is due in part to the success of
long running energy efficiency
programmes such as those run by
Nottingham City Homes and the
Greater Nottingham Healthy Housing
Service (GNHHS); the latter funded by
City and County NHS and delivered by
the Nottingham Energy Partnership.
The most cost effective way of saving
energy and carbon is through physical
energy efficiency measures supported
by behaviour change and education.
➢ Target 3: Reduction in domestic electricity consumption by 2021.
➢ Target 4: Reduction in domestic gas consumption by 2021.
46
2007 national average of 17,530kWhs gas and 4,832kWhs electricity, and regional average of 17,823kWhs gas and
4,602kWhs electricity.
page | 29Savings from 2006 to the end of 2011 are based on the current and planned programmes being
delivered in Nottingham by NEP, including the WarmZone, CESP47 and GNHSS. Savings
post-2011 are extrapolated from the supporting documents for the national Heat and Energy
Saving Strategy consultation48 (and using a per capita proportional allocation for savings of
0.47% based on 2008 City population versus UK 2008 population).
Table 3: Nottingham’s domestic electricity and gas consumption for 2006 and
predicted/targeted for future years. Source: NEP, 2009.
3. Nottingham’s Average electricity 4. Nottingham’s Average gas
domestic electricity consumption per domestic gas consumption per
consumption (GWh) household (MWh) consumption household (MWh)
(GWh)
2006 522.5 3.95 1,919 17.03
2011 490 3.82 1,296 10.12
2016 459.7 3.46 1,219 9.16
2021 435.5 3.16 1,157 8.38
These targets represent a 20% reduction in power consumption per household and a 51%
reduction in gas consumption per household by 2020.
Reduced energy consumption will fall into 3 main areas within the action plan:
• Energy efficient new build
• Energy efficient retrofit
• Behaviour change
47
On 11/09/08 the Prime Minister announced a package of initiatives designed to help people to reduce their fuel
bills whilst also ensuring that the most vulnerable receive help this winter. One element of this package was the
Community Energy Saving Programme. In early 2009, the Government publicly consulted on policy proposals for
CESP, and then re-published on 10/07/09 its response to the consultation on 30/06/09. The scheme basically aims to
deliver around £350m of energy efficiency packages in domestic properties across the whole of the UK.
The Community Energy Saving Programme (CESP). Relevant documents, including the Government’s response to
the consultation on CESP policy proposals and background to the programme, are available at:
http://www.decc.gov.uk/en/content/cms/consultations/open/cesp/cesp.aspx
48
http://hes.decc.gov.uk/download?filename=hes-partial-ia-delivery-mechanisms-for-supplier-
obligation-20090128.pdf pages 20-21.
page | 30You can also read