Development Uplift and Infrastructure Study for Kensal Opportunity Area - Royal Borough of ...
←
→
Page content transcription
If your browser does not render page correctly, please read the page content below
Development Uplift and
Infrastructure Study for Kensal
Opportunity Area
September 2015

Prepared for:
The Royal Borough of Kensington & Chelsea

Contents
  Contents                                                                            2
  1.     Scope of Commission                                                          4
  1.1. Background                                                                     4
  1.2. C&W’s Brief & Scope of Work                                                    6
  1.3. Level of Analysis                                                              6
  1.4. Documentation                                                                  6
  2.     Development Densities                                                        9
  2.1. PTAL Impact                                                                    9
  2.2. Scenario 1: The Site Without Crossrail                                        10
  2.3. Scenario 2 - The Site With Crossrail (The Potential for 4,000 Homes)          16
  2.4. Scenario 3 (i & ii) - The Site With Crossrail (Maximum Development Quantum)   17
  2.5. Summary of Scenarios                                                          18
  3.     Crossrail Impact                                                            19
  3.1. Development Densities – The Impact of Transport Infrastructure Upgrades       19
  3.2. Development Values                                                            25
  3.3. Europe                                                                        28
  3.4. Developer Perceptions & Response                                              34
  4.     Block Planning                                                              36
  4.1. Methodology & Assumptions                                                     36
  4.2. Scenario 1                                                                    38
  4.3. Scenario 2                                                                    39
  4.4. Scenario 3 (High)                                                             40
  5.     Economic Impact Assessment                                                  42
  5.1. Methodology                                                                   42
  5.2. Overall                                                                       42
  5.3. Benefits from Employment Floorspace                                           43
  5.3.1. Permanent Jobs from the Employment Floorspace                               43
  5.3.2. GVA from the Employment Floorspace                                          44
  5.3.3. Construction Jobs                                                           44
  5.3.4. Construction GVA                                                            44
  5.4. GVA / Benefits from the Residential Units                                     45
  5.4.1. Council Tax Revenues                                                        45
  5.4.2. New Homes Bonus                                                             45
  5.4.3. Increased Spend from the Additional Population                              46
  5.5. GVA Summary                                                                   47
  6.     Timescale of Delivery & Deliverability                                      48
  6.1. Timescale                                                                     48
  6.2. Deliverability                                                                48
  7.     Cost & Requirements of a Station & Associated Infrastructure                50
  7.1. Bridges Feasibility Cost Estimate                                             50
  7.1.1. Road Bridge – Single Span                                                   50
  7.1.2. Road Bridge – Double Span                                                   51
  7.1.3. Pedestrian Bridge – Footbridge Over Canal                                   51

    C&W | The Royal Borough of Kensington & Chelsea
7.1.4.   General – Site Fill                                              52
7.1.5.   Other Developments Costs & Exclusions & Assumptions              52
7.1.6.   Inflation                                                        52
7.2.     Station Feasibility Stage Cost Estimate                          53
7.3.     Overall Costings                                                 54
8.       Development Uplift                                               56
8.1.     Impact on Existing Assets                                        57
8.2.     Impact on the Typical Development Pipeline                       57
8.3.     Long Term Planned Development                                    62
9.       Funding Mechanisms                                               65
9.1.     Funding from Development on ‘the site’                           65
9.1.1.   Forms of Funding                                                 65
9.1.2.   Pay Back Mechanisms                                              67
9.2.     Funding from the 1km Study Area                                  69
9.3.     Indicative Phasing Plan for Payments & Infrastructure Delivery   70
10.      Conclusion                                                       71
10.1.    Part 1                                                           71
10.2.    Part 2                                                           71
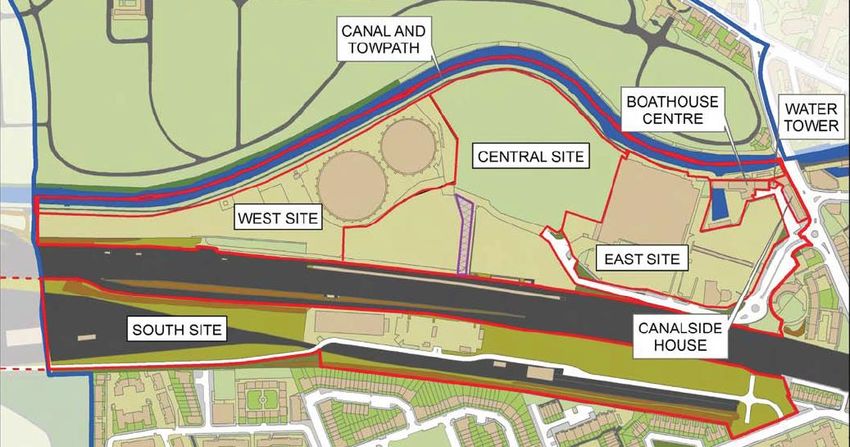
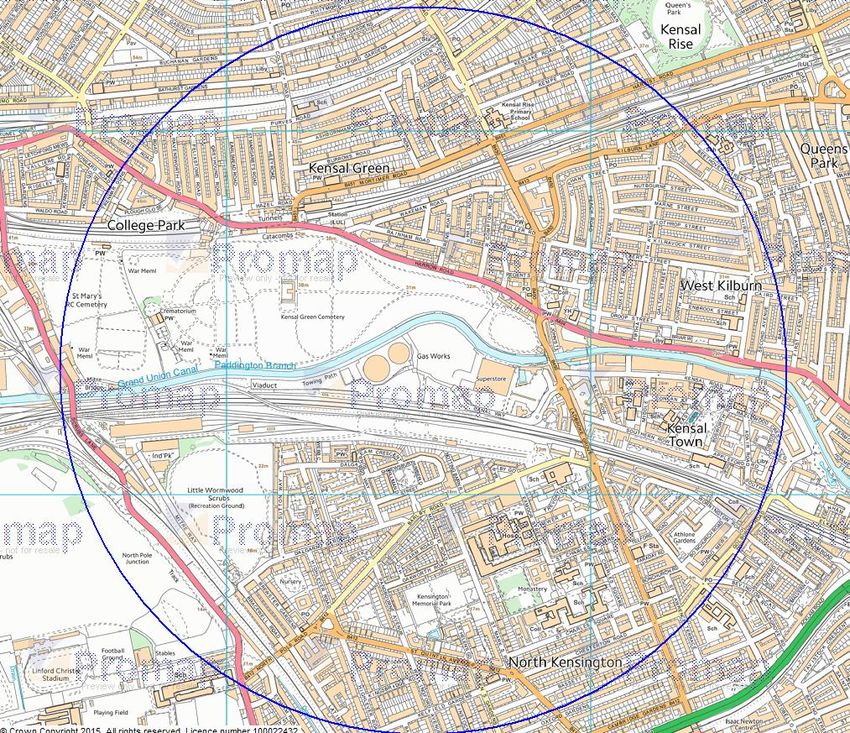
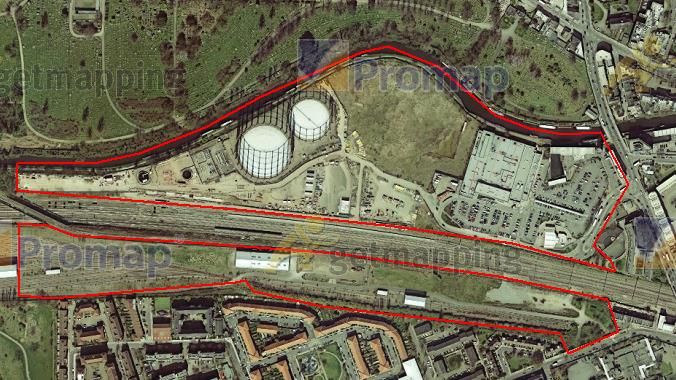
1.      Scope of Commission
1.1. Background
The Royal Borough of Kensington & Chelsea (RBKC) commissioned Cushman & Wakefield (C&W) to provide a
report on the financial appraisal of development scenarios in the Kensal Opportunity Area, ‘the site’, with specific
emphasis on the land known as the North Pole Depot.
C&W understand (and has sought to check through the available mapping data) that the sites as shown in Figure 1
& 2, total circa 17.4 ha and consists of:
•       Kensal North: Kensal Gasworks and adjacent land (circa 11.6 hectares)
•       Kensal South: The portion of North Pole Depot which sits within the RBKC (circa 5.8 hectares)
Figure 1 - Red Line Plan of the Site

Figure 2 - Red Line Plan of the Site Split by Ownership

4   |Page
The purpose of the analysis is ultimately to inform the RBKC’s ongoing efforts to secure a Kensal Portobello Crossrail
station and to help provide further evidence to Transport for London (TfL) that a Crossrail station in this location is
beneficial for both the borough and the surrounding authorities. This station would be a ‘turn back’ station in the north
part of the borough near to the boundaries with the London Borough of Brent (LBB), City of Westminster and the
London Borough of Hammersmith & Fulham (LBHF). The location of the proposed Crossrail station is illustrated on
Figure 3 and in the context of the full, planned Crossrail route in Figure 4.

Figure 3 - Location of the Proposed Kensal Crossrail Station

Figure 4 - Proposed Kensal Crossrail Station in the Context of the Crossrail Line

The site is relatively isolated and subject to significant infrastructure constraints. The North Pole Depot area which
falls within the southern site area has been identified as essential for the development of High Speed 2 (HS2)
(although this has been the subject of examination as part of the RBKC’s response to the HS2 Bill in July 2015) whilst
part of the area is hoped to be the location for a potential Kensal Portobello Crossrail Station. To this end, the
development of the site will need to link with the surrounding communities so that residents on both sides of the
existing railway line can access and benefit from a new Crossrail station.

5|P a g e
1.2. C&W’s Brief & Scope of Work
C&W’s brief was to model 2 to3 development scenarios in order to analyse development uplift and development
value uplift both with and without a Crossrail station. Each scenario is to assume that the existing 295 bus service
would be extended by one stop further along Canal Way. The development scenarios are:
1) A development of a reasonable number of units that the market could expect without a Crossrail station on
the site (but with the improvements and extensions to bus services).
2) 4,000 homes with a Crossrail station on the site.
3) If C&W’s calculations suggest 4,000 homes is unlikely to come forward or that 4,000 plus units is a
reasonable assumption, C&W will also model the maximum quantum of development that the market would
comfortably expect on a site like this with a Crossrail station.
1.3. Level of Analysis
This assessment is based on scenarios which are at a very early stage of development and would require detailed
due diligence and viability testing prior to coming forward; importantly, they would also require agreement between
various landowners as the RBKC has very limited land ownership within the site. However, we consider the scenarios
are advanced enough for this level of assessment and in order to understand the scale of the difference in outputs
between the various scenarios and relationship to the development of the proposed station.
It should be noted that, in particular, the costings utilised in this assessment are high level with significant potential
for change in areas such as infrastructure and site servicing.
For the avoidance of doubt, no advice within this report is to be taken as C&W’s formal opinion of value. The
commentary relates to scenarios and analysis which is based on information provided by third parties and high level,
hypothetical scenarios (although, we consider these to be broadly deliverable in planning terms). No values referred
to in this report are covered by the RICS Valuation – Professional Standards January 2014 (Red Book).
1.4. Documentation
In completing this report, as well as utilising general property databases and information sources, we have relied
upon the following:
London’s Top Property Growth Areas. January 2013. http://www.homesandproperty.co.uk/property-
news/new-homes/londons-top-property-growth-areas
Property Prices near London Crossrail Set to Outperform Local Markets. April 2015.
http://www.propertywire.com/news/europe/uk-crossrail-property-prices-2015040810359.html
GVA Property Impact Report
GVA Crossrail Property Impact Study, October 2012.
Mayor of London, The London Plan. The Spatial Development Strategy for London Consolidated with
Alterations Since 2011. March 2015.
London Plan Density Matrix Review, June 2006.
Mayor of London, The London Plan. Spatial Development Strategy for Greater London. July 2011.
6 |Page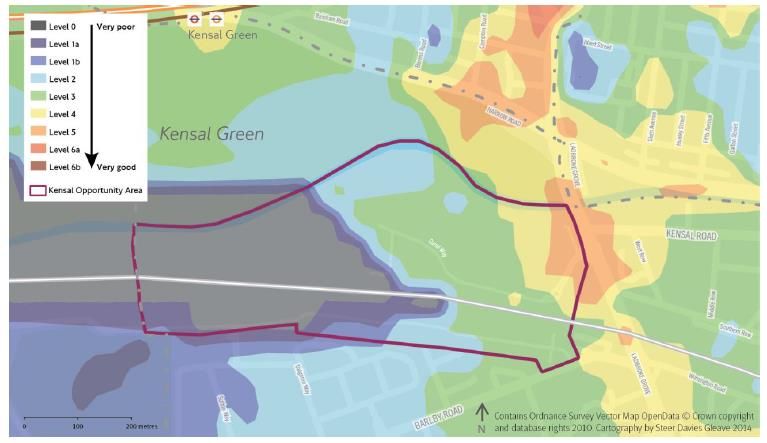
WebCAT, TfL. https://tfl.gov.uk/info-for/urban-planning-and-construction/planning-with-
webcat/webcat?lat=51.52801&lon=-
0.2168&type=Ptal&locationId=ChIJffW5YjwQdkgRxHOeEfR49S0&input=W10+4RA&scenario=2011+%28B
ase+year%29
The RBCK Core Strategy, Strategic Sites Allocations, Adopted 8 December 2010: Section 2, Delivery
Strategy.
Nine Elms and North East Battersea. Outline Feasibility Studies and Business Cases for Tram and Tube
Options. Steer Davies Gleave. February 2008. http://persona.uk.com/NLE/B-Core_docs/C/NLE_C1.pdf
Taylor Wimpey plans mixed-use Battersea Park East scheme. Out-Law.com. February 2014. http://www.out-
law.com/en/articles/2014/february/taylor-wimpey-plans-mixed-use-battersea-park-east-scheme/
Evening Standard. Homes within Walking Distance of Crossrail Stations ‘see value boosted by up to
£170,000’ (based on Groundsure Crossrail Report, 2015). June 2015.
http://www.standard.co.uk/news/london/homes-in-walking-distance-of-crossrail-stations-see-value-boosted-
by-up-to-170000-10346840.html
Knight Frank. Residential Research. Crossrail – Analysing Property Market Performance from Reading to
Shenfield. 2015.
Estates Gazette. Transport Must Drive Regeneration. July 2015. http://www.egi.co.uk/news/transport-must-
drive-regeneration/
London’s Infrastructure: Investing for Growth. London First. March 2015.
Additionality Guide: Fourth Edition, HCA, 2014.
Employment Densities Guide, Drivers Jonas Deloitte & HCA, Second Edition, 2010.
Construction Jobs Guidance Note, OffPAT, 2009.
Economic Impact of a Crossrail Station in North Kensington. A Report Note by Regeneris Consulting.
James Buckley. Crossrail 2 Could Add £32bn to Resi Values.
http://www.costar.co.uk/en/assets/news/2014/June/Crossrail-2-could-add-32bn-to-resi-values/
Track to the Future. 2014. Carter Jonas.
http://www.carterjonas.co.uk/~/media/Publications/Track%20to%20the%20Future%20REPORT%20June%
202014.ashx
TfL. July 2004. Jubilee line raises land value by estimated £2.8 billion (bn) at Canary Wharf and Southwark
Tube stations. http://www.labourland.org/downloads/articles/jle-land-value-press-release.pdf
Response of Residential Property Values to the Replacement of Limited-stop Bus Service with Bus Rapid
Transit- An Analysis of New York City’s BX12 Select Bus Service. Curley,M. May 2012.
Local Government in England: Capital Finance. April 2014. SN/PC/05797.
http://researchbriefings.files.parliament.uk/documents/SN05797/SN05797.pdf
Brent Council Approves Plans to Convert Kensal Rise Library into Flats. July 2014. Myron Jobson.
http://www.kilburntimes.co.uk/news/heritage/brent_council_approves_plans_to_convert_kensal_rise_library
_into_flats_1_3689204
Kensington and Chelsea Adopted Core Strategy 2010 (Strategic Site Allocations)
7|P a g e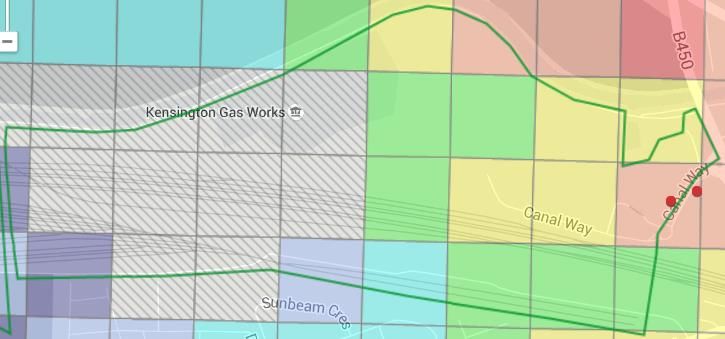
Community Infrastructure Levy Charging Schedule – Mayor of London. Agreed by the Mayor 29 February
2012, Takes Effect from 1st April 2012.
http://www.london.gov.uk/sites/default/files/CIL%20charging%20schedule%20April%202012.pdf
Mayoral CIL. London.gov.uk. http://www.london.gov.uk/priorities/planning/mayoral-community-
infrastructure-levy
Housing Zones: Prospectus. https://www.gov.uk/government/publications/housing-zones-prospectus
Housing Zones. https://www.london.gov.uk/priorities/housing-land/increasing-housing-supply/housing-
zones
Bedford Sets Out to Accelerate Growth. February 2006.
http://www.planningresource.co.uk/article/542912/bedford-sets-accelerate-growth
http://www.wandsworth.gov.uk/news/article/12088/northern_line_extension_inquiry_begins
NLE: EZ and borough s106/CIL contribution. 4 March.
http://moderngov.lambeth.gov.uk/documents/s54296/Borough%20NLE%20contribution%20v12%20Lambet
h%20clean.pdf
LIF. Prospectus. DCLG. February 2013:
https://www.gov.uk/government/uploads/system/uploads/attachment_data/file/88479/20130220_-
_Local_Infrastructure_Fund.pdf
Housing Review – Estate Comparison Document – 20140424 (Treverton)
RBCK CIL Instalments Policy February 2015
The Mayor of London CIL Instalments Policy
RBKC CIL Regulation 123 List (April 2015)
8 |Page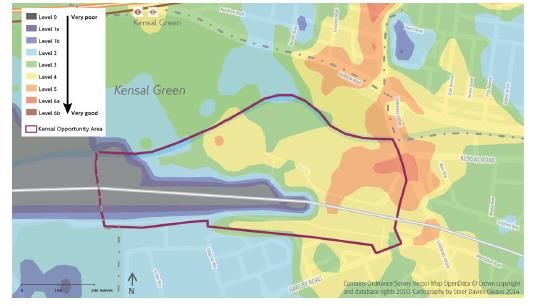
2. Development Densities
2.1. PTAL Impact
TfL’s ‘Public Transport Access Level’ (PTAL) scorings provide a benchmark for public transport site accessibility.
PTAL scorings are typically used across London in order to help determine site densities and allocations.
Development becomes progressively more viable with rises in the PTAL score (with other conditions remaining the
same).
The PTAL value combines information about how close public transport services are to a site and how frequent these
services are. The highest level of connectivity has a PTAL of 6b and the lowest has a PTAL of 0.
The PTAL score takes into account:
Walk times to bus stops within 640 metres of the point of interest and to stations within 1 km;
The number of separate PT services available at each PT access point (e.g. different bus services at a given
bus stop);
A mode-specific factor for the reliability of each of the PT services available; and
The service frequency for each PT mode, and hence average waiting time at the PT access point.
However, PTALs do not measure or reflect the following:
The journey times offered by PT services, influencing the number of employment or shopping opportunities
available within defined isochrones;
The need for, and ease of, changing modes and services; interchange incurs delays and other penalties
which will reduce the attractiveness of the PT services available at any given PT access point;
The capacity/crowding of the PT available services, either in terms of boarding at the PT access point or
along the whole route;
The different attractiveness of different PT modes for different types of journey; and
The spatial and over-time distribution and purpose (work, shopping, leisure etc.) of potential travel demand
from the point of interest.
The London Plan and various other policy documents refer to accessibility indicators in relation to optimising housing
output and potential development sites; the London Plan states that higher density provision should be focused on
areas with good PTALs. It emphasises that sites with better connectivity provide opportunities for development at
higher range of densities and sustainable development reducing the need to use private transport. As such the 2006
London Plan Density Matrix Review includes density guidelines in habitable rooms per hectare (hr/ha) and units per
hectare (u/ha), see Figure 5. Note that the 2011 London Plan states that residential density figures should be based
Central – areas with very dense development, a mix of different uses, large building footprints and
typically buildings of four to six storeys, located within 800 metres walking distance of an International,
Metropolitan or Major town centre.
Urban – areas with predominantly dense development such as, for example, terraced houses, mansion
blocks, a mix of different uses, medium building footprints and typically buildings of two to four storeys,
located within 800 metres walking distance of a District centre or, along main arterial routes
Suburban – areas with predominantly lower density development such as, for example, detached and
semi-detached houses, predominantly residential, small building footprints and typically buildings of two
to three storeys.
9|P a g e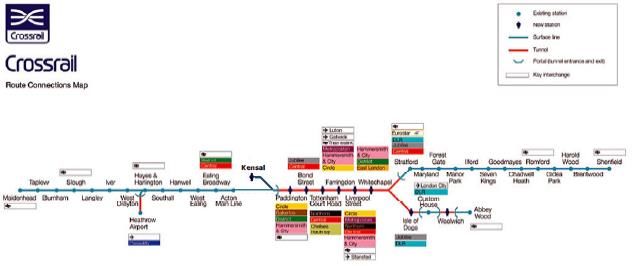
on net residential area, which includes internal roads and ancillary open spaces. The recommended densities shown
in Figure 5 are reflective of the type of development that surrounds the site in question and are related to setting,
existing building form and massing and the PTAL index. The settings are defined as follows in the 2011 London Plan:

Figure 5 - Recommended Revised Density Matrix, London Plan Density Matrix Review June 2006.

2.2. Scenario 1: The Site Without Crossrail
PTAL Areas
C&W has reviewed the PTAL scorings for the site using the Connectivity Assessment Toolkit, WebCAT, which
provides PTAL maps calculated using a grid of points at 100m intervals across Greater London. The 2011 (base
year) PTAL output map is provided in Figure 6. It shows that the PTAL score for the site ranges between 0 and 5.
The high PTALs on the eastern edge of the site are due to the access provided by bus services along Ladbroke
Grove. PTAL calculations use a maximum walk distance of 640m for bus stops and 960m for rail station; this
methodology combined with the physical barriers that constrain the Kensal Canalside OA (rail infrastructure and
canal), leads to varied and low PTALs across parts of the Kensal Canalside OA.

10   |Page
The WebCAT tool also provides a 2021 and 2031 PTAL forecast which indicate in the case of the Kensal Site that
there is no change envisioned in terms of PTAL scores based on major public transport network improvements
including schemes held in TfL’s committed and funded transport investment programme as well as improvements in
bus services based on the base year network with 3% uplift. The forecast scenarios do not include the impact of an
extended and improved bus service into the site or any significant improvement in transport provision through new
stations/ lines such as a Crossrail.

Figure 6 - WebCAT PTAL Map (2011 Base Year) & Scores Calculated

C&W has calculated the PTAL areas at the site based on Figure 5 above (see Table 1).

Table 1 - C&W’s Calculations of Areas & PTAL Scores Excluding the Bus Route Extension / Improvements
       PTAL areas based on WebCAT (excluding bus service
                          extension)*
          PTAL Scoring Range                      Area ha
                  0-1                              c. 7.0
                  2-3                              c. 5.5
                  4-6                              c. 4.9
                TOTAL                              c. 17.4

11 | P a g e
*This area calculation is based on our interpretation and manual measurement of the WebCAT PTAL Output Map,
Figure 6, and so is not exact.
A more up to date PTAL map is included in the Steer Davies Gleave (SDG) February 2015 Report which also has
the benefit of additional maps which incorporate the impact of bus service improvements and extension. However,
the difficulty in interpretation and manual measurement of the maps is heightened for the SDG maps which lack
guidelines.
Figure 7 shows a similar outcome to the map above produced by C&W using WebCAT with current PTALs varying
from a high of 4 on the eastern edge of the site to a low of 0, with the majority of the site between 0 and 3. However,
it shows a significantly smaller proportion of the site as within the 4-6 PTAL scoring range.
Figure 7 - SDG Report Current Year PTAL Map
As before C&W has calculated the PTAL areas at the site based on Figure 5 (see Table 2).
Table 2 - C&W’s Calculations of Areas & PTAL Scores Excluding the Bus Route Extension / Improvements
PTAL areas based on SDG map (excluding bus service
extension)*
PTAL Scoring Range Area ha
0-1 c. 7.0
2-3 c. 8.7
4-6 c. 1.5
TOTAL 17.4
*This area calculation is based on our interpretation and manual measurement of the SDG Map, Figure 7, and so is
not exact.
12 |PageThe SDG Report identifies that demand for bus services is likely to increase in line with current trends and that this will be kept under review through TfL’s bus service planning process. However in line with the WebCAT output for its medium to short term scenario (up to 2021), the 2015 report says that in the short to medium term (to 2026) PTALs are expected to remain similar to today given that no significant transport interventions are planned for completion in this period. Nonetheless, the SDG Report includes recommended interventions in its longer term (post 2026) analysis (the impact of these recommended transport interventions are not included in the WebCAT calculations). It found that the existing highway access into the site is not sufficient to serve a 4,000 homes development with an extended Sainsbury’s store and that whilst the rail and Underground networks could accommodate some new demand, improvements to bus services would be required to serve the new development (including the extension of existing services as shown in green in Figure 8). This finding is on the assumption that a Crossrail station as Kensal would not be realised, although the report states that these findings would still likely apply (but would need to be reviewed accordingly) in this scenario. The report also highlights that the redevelopment of Old Oak Common (OOC), to the west of Kensal Canalside, will make necessary significant transport infrastructure improvements including a major new interchange, between HS2 (when complete), Crossrail 1 and other National Rail services which are not included at this stage of analysis. Figure 8 - Map Illustrating the SDG Report Recommended Transport Service Interventions The SDG Report recognises that in the long term (post 2026) bus service provision to the site could be enhanced by increasing frequencies on routes that serve the area and by extending a route or routes further into the site (the report 13 | P a g e
recommends that the extension to the 295 service further west into the site as the development progresses is
essential, and that the provision of a new service to OOC should a new east-west route be implemented is desirable).

The report finds that the implementation of the interventions shown in Figure 8 would have a notable overall positive
impact on PTALs across the site. The current year PTAL map is reproduced in Figure 9 to show the potential future
year PTAL map assuming an extension of bus route 295 further into the site (and the provision of two new bus stops),
and including the proposed pedestrian footbridge over the canal, as well as the proposed bus route to OOC along
the new east-west link road (and two new bus stops). This shows a marked improvement in PTALs compared to the
current situation, with the majority of the site having a PTAL of between 3 and 6a. This increase is due to the additional
public transport provision within the site. It also shows a further improvement in PTALs in the area south of the site.
Whilst some areas at the western end of the site continue to have a low PTAL, these areas include the largest
concentration of railway uses (i.e. tracks and depots) with the least potential for development.

Figure 9 - SDG Future Year PTAL Map Including the Extended Bus Service and 2 Additional Stops, as well
as a New Footbridge and the Bus Service along East-West Link

As before C&W has calculated the PTAL areas at the site based on Figure 5 (see Table 3).

Table 3 - C&W’s Calculations of Area & PTAL Scores Including the Bus Service Extension / Improvements
     PTAL areas based on SDG map (including bus service extension)
           PTAL Scoring Range                            Area ha
                    0-1                                   c. 4.1
                    2-3                                   c. 5.0
                    4-6                                   c. 8.3
                  TOTAL                                   c. 17.4
*This area calculation is based on our interpretation and manual measurement of the SDG Map, Figure 9, and so is
not exact.

14   |Page
Density Calculations
As stated above, C&W has made interpretations on appropriate densities based on the 2011 London Plan and the
calculations of PTAL scorings and areas.
Calculations are on the assumption of a ‘Suburban’ setting with dwelling size requirements at the lower end of
dwelling size range (2.7 – 3.0 habitable rooms per unit) for the site without Crossrail. We have utilised this lower end
dwelling size given the site’s relatively central London location but recognise that this could be subject to change
(which would reduce the number of units which is deliverable). However, we do not consider that the bus service
improvements would be of the scale to allow for the site to move to an ‘urban’ categorisation and therefore improve
densities.
Table 4 indicates that the site could achieve between 968 and 1,685 units without Crossrail based on the WebCAT
PTAL areas (which exclude the bus line extension/improvements).
Table 4 - C&W’s Calculations on Reasonable Densities Excluding Bus Service Extension / Improvements
Without Crossrail (using WebCAT areas excluding bus service extension)
unit per ha Units
PTAL Area ha
min max min max
0-1 c. 7.0 50 75 350 525
2-3 c. 5.5 50 95 275 523
4-6 c. 4.9 70 130 343 637
TOTAL c. 17.4 968 1,685
Table 5 indicates that the number of units than can be expected without Crossrail and excluding the bus service
improvements / extension based on the SDG areas is in the range of 894 to 1,553 units. This is similar to the outcome
based on the WebCAT areas above.
Table 5 - C&W’s Calculations on Reasonable Densities Excluding Bus Service Extension / Improvements
Without Crossrail (using SDG areas excluding bus service extension)
unit per ha Units
PTAL Area ha
min max min max
0-1 7.0 50 75 350 525
2-3 8.7 50 95 436 827
4-6 1.5 70 130 108 201
TOTAL 17.4 894 1,553
As we would expect maximum densities increase slightly if these calculations are based on the PTAL maps provided
in the SDG Report which include the impact of improvements / extension to bus services. Table 6 shows that the
number of units than can be expected without Crossrail and including the bus service extension / improvements is
1,036-1,862 units.
15 | P a g eTable 6 - C&W’s Calculations on Reasonable Densities Including Bus Service Extension / Improvements
Without Crossrail (using SDG areas including bus service extension)
unit per ha Units
PTAL Area ha
min max min max
0-1 4.1 50 75 205 307.5
2-3 5.0 50 95 250 475
4-6 8.3 70 130 581 1079
TOTAL 17.4 1,036 1,862
Unit Numbers
This scenario is based on a development on both sides of the railway line; the 1,449 units modelled differs from the
figure of 2,500 units identified as achievable in C&W’s 2014 study as:
C&W was provided with the previous figure of 2,500 units by the RBKC and did not undertake any analysis
as part of the 2014 study on whether these supplied unit numbers were achievable.
C&W/ RBKC have revised the assumptions on site areas which impacts the number of units that are
achievable at the site.
Prior to commencing the 2015 study, C&W has been provided with the SDG report on forecast PTALs at the
site (with an extended bus route, new footbridge only, but without Crossrail and without a new road bridge).
C&W has therefore been able to develop interpretations on appropriate densities and therefore achievable
unit numbers without Crossrail, using the London Plan and PTAL scorings.
The 2,500 units was based on the assumption that both a road and pedestrian bridge would be built to enable
development on both sides of the rail line (although C&W consider that a new pedestrian/ road bridge would
have minimal impact on PTAL levels).
It should be noted that historically (led by the RBKC), a circa 700 unit scheme has been masterplanned on the Kensal
North site only.
2.3. Scenario 2 - The Site With Crossrail (The Potential for 4,000 Homes)
C&W’s experience is that build out rates are typically accelerated by the introduction of significant transport
infrastructure improvements such as Crossrail. This has been observed at locations nearby to secured Crossrail
stations and developers have been attracted by the reduced risk of lower demand for the units at less accessible or
connected sites and the developer’s concern of ‘flooding’ the market is significantly reduced. In addition C&W
considers that this perception among developers goes beyond accessibility / connectivity and is related to the
perceptions on the influence and strength of significance of Crossrail in terms of its value and demand impact. Section
3.3 provides further analysis into developer perceptions and responses to transport infrastructure investment.
Density Calculations
C&W has made interpretations on appropriate densities using the density guidelines in the 2011 London Plan and
the assumption of an ‘Urban’ setting with dwelling size requirements at the lower end of the dwelling size range (2.7
– 3.0 habitable rooms per unit) for the site with Crossrail. We consider that the relatively central location of the site
within London and the type of occupiers which a new station is likely to correspond best with this average unit size.
16 |PageC&W has assumed a PTAL scoring range of 4 to 6 based on the case studies in Section 3.1 of this report as to what
we would anticipate from the example of other major sites in London given their transport connections. Table 6
illustrates the various unit numbers which can typically be delivered given different levels of u/ha; as already noted
in the ‘without Crossrail’ scenario, we consider that the 70-260 u/ha range is most appropriate for the site (based on
the site being appropriate for units at the lower end of the dwelling size range). This range has been applied to the
area of the site to give a total number of units of 1,218-4,524; this is obviously a wide range with room for
interpretation.
Unit Numbers
In order to test the point in relation to whether 4,000 units are deliverable on this site, a figure previously used by the
RBKC and supplied by the Council for the purpose of this analysis, we have ‘goal seeked’ the u/ha level that would
need to be seen in order to achieve this number of units on the site. Table 7 also shows this to be 230 u/ha.
Table 7 - C&W’s Calculations on Appropriate Densities with Crossrail and Required Density to Bring
Forward 4,000 Units
With Crossrail (including bus service extension)
PTAL Scoring u/ha No. of Units
Range Area ha
Min Max Min Max
45 185 783 3,219
17.4 55 225 957 3,915
4-6
70 260 1,218 4,524
230 4,000
Table 7 in Section 3.1 of this report reviews the impact of new significant transport infrastructure improvements on
residential density and benchmarks this 230 dwellings per hectare against other comparable sites. The findings
supports the case that a density of 230 u/ha and therefore 4,000 units is achievable at the site.
2.4. Scenario 3 (i & ii) - The Site With Crossrail (Maximum Development
Quantum)
Without masterplanning the site it is not possible for C&W to physically illustrate that higher densities above the 230
u/ha calculated above are achievable at the site. However, there are comparable examples which could support the
development of higher densities. C&W has based its assumptions on the most comparable high density
developments/ examples from Table 8 (in Section 3). These comparable high density schemes which are adjacent
to major infrastructure improvements could support the following assumptions for a high density scheme.
i) 260 u/ha (4,524 homes)
Based on the example of Vauxhall Nine Elms Battersea (VNEB) which as an Opportunity Area (with
previously mid to low rise densities), is comparable in a number of respects and provides a density based
on a wider development area rather than a less reliable or comparable indication based on an individual
building site.
ii) 285 u/ha (4,872 homes)
This is based on the planned scheme at Custom House / Freemasons which is adjacent to a planned
Crossrail Station.
17 | P a g e2.5. Summary of Scenarios
In all the above scenarios residential density has been calculated as gross site area ha / number of residential units.
The rationale for these scenarios is for there to be a base option without Crossrail (Scenario 1) and for this to be
compared to C&W’s consideration of the likely maximum achievable density (Scenario 3) and the density level
‘historically’ assumed by the RBKC (Scenario 2).
Based on the analysis above and the Crossrail impact analysis in Section 3 which follows, we consider that the three
development scenarios which should be modelled are as follows:
1. Scenario 1 (without Crossrail): 1,449 homes at an overall development density of 71 u/ha
2. Scenario 2 (with Crossrail): 4,000 homes at an overall development density of 230 u/ha
3. Scenario 3 (with Crossrail):
i) 4,524 homes at an overall development density of 260 u/ha (C&W has not modelled this scenario)
ii) 4,872 homes at an overall development density of 285 u/ha
Section 4 provides commentary on C&W’s modelling of these three scenarios.
18 |Page3. Crossrail Impact
As noted in Section 2, it is important to recognise that the potential impacts of Crossrail on densities come in two
parts. There is both an impact in planning policy terms through the improvement of the PTAL score (and therefore
densities) but also an impact in terms of the ‘regeneration effect’ and how developers may respond to the impetus
provided. Disaggregating these impacts is difficult, particularly as in strongly performing residential areas of London
(such as this), it is typically difficult to evidence a cap on densities from anything other than planning policy in the
current market (and indeed, for a reasonably long period). However, there is a real impact that transport improvement
can provide in relation to the developers perception of increases in demand (and changes in the type of units
demanded).
3.1. Development Densities – The Impact of Transport Infrastructure Upgrades
C&W has reviewed a number of regeneration areas within London and major residential led development sites in
order to review the density levels achieved being proposed/ delivered (see Table 8 below). The areas covered are:
Woolwich; gained a Crossrail station post original route/ station allocations and has a number of major
brownfield land, residential led regeneration schemes.
Custom House; is subject to a Crossrail station and has a number of residential led regeneration schemes.
Southall; is subject to a Crossrail station and has a number of residential led regeneration schemes.
Romford; is subject to a Crossrail station and has a number of residential led regeneration schemes.
Clapham Junction; 5 years of station improvements and further improvements to come, and has a number
of residential led regeneration schemes.
Vauxhall Nine Elms Battersea (VNEB); the agreed location for a Northern Line Extension (NLE) and is subject
to a large number of residential led regeneration schemes on large areas of brownfield land.
Kidbrooke; developer (Berkeley Homes) has funded and delivered a new station facility (albeit, with no
significant alteration in the service as we understand it). This area has been ‘repositioned’ by the developer
and although in an area less attractive to developers than Kensal, Berkeley Homes is delivering a reasonably
dense scheme within a short timeframe.
19 | P a g eTable 8 - Examples of Major Residential Led Schemes around Major Transport Improvements
Existing Developme Calculations of No. of
Size
Development Developer Densities nt Development Residential Current PTAL Rating
(ha)
u/ha Timeframe Density Units
c. 402 u/ha
Royal Arsenal The (adjusted for net
Brownfield
Warren Waterfront residential area)
Berkeley / low 15.5 3,722 5-6a which is expected to be further improved with the completion of Crossrail
Masterplan 2010
density
(08/1121/O) c.1,029 hr/ha
(adjusted)
Royal Arsenal The
Brownfield
Warren Waterfront c.388 u/ha or 698
Berkeley / low 6.3 2,032 5-6a which is expected to be further improved with the completion of Crossrail
Masterplan 2013 u/ha (adjusted)
density
(13/0117/O)
Royal Arsenal Phase 3 - Brownfield c.231 u/ha
Laboratory Square Berkeley / low 1.02 234 5 which is expected to be further improved with the completion of Crossrail
(11/1632/F) density c.653 hr/ha
Royal Arsenal Phase 4 -
Brownfield
Over Station
Berkeley / low c. 405 u/ha 1.47 592 6 which is expected to be further improved with the completion of Crossrail
Development (west)
density
(11/2382/O)
394
Armourers Court, The PTAL of the site is 6a. When Crossrail is operational in 2018 it will increase the
c. 480 u/ha including
Arsenal Way PTAL to the maximum level of 6b
affordable
Woolwich Central
c.418 u/ha
Phase 4 - Grand Depot
1.38 516 4 to 6
Rd
c.1,082 hr/ha
(14/2000/O)
Southmere Village- Gallions c. 99 u/ha
Phased
Tavy Bridge Phase 3 Housing 2.98 296 4 which is expected to be further improved with the completion of Crossrail
development
(12/00876/FULM) Association c.302 hr/ha
20 |Pagec.196 u/ha
Minoco Wharf
Phased
(11/00844/LTGOUT & Ballymore c.655 hr/ha or 17.2 3,385 1, 2 (the PTAL rating at the detailed area of the scheme records a PTAL of 2).
development
11/00856/OUT) 443-472 hr/ha
(adjusted)
Minoco Wharf c.293 u/ha
Phased
(07/01143/OUT & Ballymore 10.2 c.3,000
development
07/01141/LTGDC) c.728 hr/ha
Low
Custom House & density /
c.285 u/ha 5.3 1,500
Freemasons low rise
residential
c.111 u/ha or
c.308 u/ha
The (adjusted)
The site currently records a PTAL rating of 1b or 2 although this may increase with
Silvertown Quays Silvertown Mostly 10 years
27.4 3,033 the proposals for direct links between the site and Pontoon Dock station, the RVD
(14/01605/OUT) Partnership vacant from 2015 453 hr/ha or 536
footbridge to Custom House and enhanced bus services.
(Chelsfield, including hr/ha (adjusted) or
First Base) phasing 1,189 hr/ha
(adjusted)
Silvertown
Quays The current PTAL rating is 2 but the introduction of the new DLR station in 2005, a
Silvertown Quays 10 years
Limited Mostly new pedestrian bridge and Crossrail will increase the PTAL rating to 3. However,
(03/2006 & including 4 c. 210 u/ha 24 4,930
(SQL) vacant Crossrail is approximately 1.5 km from the site, which is beyond the average distance
10/00860/RENEW) phases
/Chelsfield & of 940m to access a station.
First Base
Southall Gas Works 1 to 4 which is expected to increase to between 3 and 5 or higher upon completion of
Berkeley - c. 131 u/ha 28.5
(P/2008/3981-s & 3,750 the development, new rail services/bus services and Crossrail. The supporting
ST James (adjusted) - 33
54814/APP/2009/430) planning documentation notes that Crossrail will strengthen connections to the east.
Southall Gas Works -
Berkeley -
Quality Food /Iceland c. 80 u/ha 40 4
ST James
Site
Southall Gas Works - Berkeley -
c. 144 u/ha 106 4
Gurdwara Site ST James
21 | P a g eSouthall Gas Works - Berkeley -
c. 92 u/ha 48 3,2
Crescent Site ST James
Southall Gas Works - Berkeley -
c. 160 u/ha 125 3
Merrich Rd (north) ST James
Southall Gas Works - Berkeley -
c. 160 u/ha 213 3
Merrich Rd (south) ST James
Southall Gas Works - Berkeley -
c. 140 u/ha 274 3
MBC (west) ST James
Reflections- Oldchurch
Taylor
Hospital Site (east) c.144 u/ha 3.42 493 Expected to be further improved with the completion of Crossrail.
Wimpey
(P1638.09 & P1406.12)
Oldchurch Park -
Oldchurch Hospital Site Taylor 4 to 6 and expected to be further improved with the completion of Crossrail which will
c.170 u/ha 2.15 366
(west) Wimpey improve accessibility to the west end
(P0975.10)
2,000 units
(2015 -
March
Clapham Junction 2018), &
3,000 (2019 There are proposals to safeguard this area for delivery of Crossrail 2. Improved bus
Battersea Riverside (at
+) & 1,500 5,000 services are being negotiated for within the Riverside Development Zone. Network
central Zone, Riverside
affordable Rail's longer term expansion plans are key here.
Zone and Station Zone)
on top of
St James
that).
c. 400 u/ha
Battersea Gasholders
The site currently has a public transport accessibility level (PTAL) of 3, which will
Site, 101 Prince of 2.1 839
c. 1,3000 hr/ha increase following the introduction of the NLE.
Wales Drive
(adjusted)
22 |PageThe public transport accessibility level range from excellent (PTAL 6) in and around
Vauxhall to poor (PTAL 0-2) in the south and west end of the OA. This is expected
to improve with the NLE to 5-6, with a wide area around the power station set to have
a PTAL of 6 with two northern line stations (as shown below).
VNEB PTALs Without (Top) and With (Bottom) the NLE (SDG Report)
Low rise
VNEB 5-8 storey c. 260 u/ha 12,500
buildings
c.159 u/ha
Battersea Park East The PTAL rating is 5 to 6a across the site and this is expected to increase to 6a with
Low rise 1.82 290
(VNEB) the NLE.
c. 764 hr/ha
23 | P a g eDensity Calculations for New Covent
Garden Market
Site
Den No of
Site Area
sity Units
ha
Northern 387
4.2 1,625 PTAL scores range from six on the ‘Northern’ site and from one to two on the
New Covent Garden site u/ha ‘Entrance’ site but drops as low as zero on the Main Market site. The Northern Site is
Market Nine Elms Entrance 320 less than 500 metres from the Vauxhall transport interchange, providing mainline rail,
1.34 429
site u/ha Victoria line Underground services, and a range of bus connections.
Garden 208
0.52 108
Heart u/ha
Thessaly
132
Road/Coll- 2.11 280
u/ha
ege sites
Vauxhall Square
1,148 hr/ha 520 6
c. 1,285 u/ha
Vauxhall Sky Gardens 0.18
239 6
6
or 3,315 hr/ha
Marco Polo House,
Queenstown Road, c. 365 u/ha 1.25 456 5
Battersea
Or 1,148 hr/ha or
c. 166 u/ha (332
u/ha at Phase 3,
215 u/ha at Phase
200 units pa 5, 141 u/ha at
(with Phase 6)
Kidbrooke Village 3
Berkeley affordable
Phases 3,5 & 6 Access to the development benefits from new improvements to Kidbrooke station.
on top of c.450 hr/ha (945
that) hr/ha at Phase 3,
657 hr/ha at
Phase 5, 440
hr/ha at Phase 6)
24 |PageC&W considers that Table 8 supports the assumptions on PTAL scorings in Section 2 and overall development
densities of 230 u/ha or potentially higher across the site. C&W does not consider that development densities would
be consistent across the site rather that densities would vary depending on the PTAL scoring and planning
considerations.
C&W considers that Woolwich provides the best example as an area of major brownfield land which has seen a large
number of residential schemes since it gained a Crossrail station. The table above shows a number of examples of
residential schemes in Woolwich, all of which are based on densities of over 230 u/ha except one scheme. These
examples show densities of up to c.480 u/ha for residential led schemes in Woolwich.
Custom House, as an alternative example of a site with Crossrail and major residential led schemes, supports these
density levels with a number of developments over 500m from the proposed station with densities in the range of 111
to 293 u/ha and the majority over 230 u/ha.
Southall examples show lower development densities however we consider that it is a less central location and that
Kensal as an area in the west of London and within the RBKC, provides a significantly more attractive opportunity for
developers.
The Kidbrooke example shows density levels of 141 to 332 u/ha supporting the case that major transport
improvements, funded in this case by the developer, can ‘reposition’ an area less attractive to developers and deliver
relatively high densities within a short timeframe.
As such the examples in Table 8 show significant increases or forecast improvements in densities compared to
existing density levels across a number of residential schemes near major transport improvements and
developments. VNEB provides an additional example of major residential development on a large brownfield area
with density levels at residential developments at VNEB range from 260 u/ha to 400 u/ha.
The examples also include commentary on the impact of Crossrail and other major transport infrastructural
improvements on PTAL scorings. They illustrates a significant improvement in PTAL scorings for all stations with
Crossrail supporting the assumptions in Section 2 of this report.
3.2. Development Values
The most likely significant catalyst of change to accessibility and value of the site in the foreseeable future is the
potential development of a Portobello Road Crossrail station.
There is a large body of research which shows the significant impact of major new infrastructure on property values
and development viability. Rail investments such as Crossrail result in changed levels of accessibility, which drives
demand for development around rail stations and alters the type of development undertaken. This provides the
opportunity for market values and development activity increase.
Data reviewed by C&W gives an indication of potential value uplift and should be viewed as our best estimates given
limited case study evidence. Further details are set out in Table 9 but in summary:
General Infrastructure
There is a premium for retail and commercial space within the immediate proximity of a transport node of up
to 400 metres. The literature also suggests that residential property increases in value due to improvements
in rail infrastructure up to a range of 1,000 metres although it can sometimes be detrimental to locate
residential uses within immediate proximity to a transport node if not properly masterplanned.
Increased connectivity will enable high density development and is a key factor for retail and office uses.
25 | P a g e Previous research into the time and cost savings of commuters rail in the South East Research suggests
that for every 60 seconds saved in commute times, it will add £1,300 to apartments (circa £2,000 for detached
housing).
While there may be additional benefits in terms of increases in property and land values, these are to some
extent dependent on other factors being present in the local economy, including supportive local economic
conditions relating to the labour and property markets, a supportive political environment that is conducive
to inward investment and the availability of both private and public funds for investment.
The London Assembly heard in July 2015 that transport schemes should drive regeneration using the
example of the Bakerloo Line Extension (Estates Gazette, 2015).
The French experience with regard to regeneration indicates that there is a window of opportunity stretching
from about three years prior to a new service launch for approximately four years after opening, during which
the major benefits can be expected to arise (Greenguage21). Beyond that period, the newly enhanced
services become ‘taken for granted’. Rail Infrastructure upgrades enabled greater densities; areas with the
benefit of high speed rail grew quicker and exhibited more resilient local office, retail and residential markets.
Research suggests that infrastructure improvements have a positive impact on value of land and property;
unsurprisingly this is particularly prominent where a suburb with poor connectivity is opened up and linked to
an area of high economic activity.
Crossrail
The GVA Crossrail Property Impact Study (October 2012) indicates a potential capital uplift of up to 20% to
25% for residential and 10% for commercial values immediately around Crossrail stations. It forecast that for
every 250m distance from the Station entrance, there would be a decrease in price or impact of 1.9% of
additional property values increase.
JLL forecast that the price of homes near stations along the Crossrail 1 route will increase by up to 57%
between 2013 and 2018.
Groundsure’s recently published 2015 study, based on land registry data, found that the most significant
price increases have been around Crossrail stations at less central locations between 2013 and 2015.
However, Knight Frank’s 2015 Residential Research found the overall price performance to be generally
stronger around central stations. The research showed average property prices within a 10-15 minute walk
from new Crossrail stations had already outperformed prices in the wider area by some 5% (averaged over
each station). Residential property prices within a 10 minute walk of the central stations had risen, on
average, by 57% since July 2008 compared to 43% growth in the prime central London market over the
same period, according to Knight Frank’s own index. The research identified western and eastern stations
where price growth has lagged surrounding areas as areas of opportunity for further price uplifts, especially
where large scale regeneration and development is underway such as Woolwich and Southall.
Recent research undertaken by Hamptons International has discovered a stark rise in property transactions
in close proximity to Crossrail stations. Transactions within 500m of future Crossrail stations grew by 23% in
2013 and by 21% within a mile, significantly exceeding the London average of 13% for 2013.
In cost-benefit terms, the Department for Transport classify anything with a cost benefit ratio of over 2:1 as
a good investment. The case for Crossrail in 2007 resulted in an original benefit-cost ratio rising from 1.9 to
a range of 3.1 to 7:1. To put this in context the Channel Tunnel Rail Link had a ratio of 0.5:1. (London First)
26 |PageOther Transport Interchanges
The impact that the HS1 rail network had on residential price increases across the network ranged from 5%-
25% and was linked to commuting times to London. The extension has enabled three major development
sites.
The Boston Subway, Southern New Jersey Line, Portland Eastside and Dublin metro lines all recorded an
increase in residential prices of circa 10%. Recorded increases in land values were as high as 25%.
.
27 | P a g eTable 9 - Examples of Residential and Commercial Value Uplift around Major Transport Developments / Investments
Case Source Impact on Value Impact
Study
3.3. Europe
Crossrail 1 Groundshore Between 2013 and 2015 Taplow has seen a 73% increase in the value of homes within 800m of the Crossrail station whilst
2015 Gidea Park has experienced a 49% rise in values, Custom House 46%, Hayes and Harlington 46% and Southall 45%
(Groundsure). During this period the average London property increased by around 17%.
GVA Crossrail
Property Custom House, Crossrail - The GVA Study reported that between 2009 and 2012 there was 8 applications within 1km of
Impact Study the station which would together provide circa 9,000 residential units, 32,000 sq m of office space, and 4,100 sq m of retail
2012 space. These applications all identified Crossrail as key to development. The study projects that the average house price
near Custom House Crossrail Station will grow as below:
Knight Frank
Residential
Research:
Crossrail –
Analysing
Property
Market
Performance
from Reading
to Shenfield
2015
Woolwich, Crossrail - The GVA Study predicts that the average house price near Woolwich Crossrail Station will grow as
below:
28 |PageKnight Frank’s analysis showed that average residential prices have already risen by 25% around Woolwich station (since
2008), a slight underperformance compared to the 32% uplift in Greenwich over the same period. However, Knight Frank
expect this trend to change once the extensive new development around the station is completed. There are currently 163
new residential units under construction within a 15 minute walk of the new station, and planning has been approved for
2,700 more, with 400 being built directly above the new station.
Southall, Crossrail - The 2012 Study forecasts that the average house price near Southall Crossrail Station will grow as
below:
29 | P a g eKnight Frank identified a lagging in prices around Southall Station against the local authority average and highlighted a
subsequent opportunity for price growth around the Station.
London C&W / The JLE is a prime example of other supportive and positive factors in the local economy being present i.e. around Canary
Jubilee London Wharf, allowing the JLE to maximise on these benefits and their impacts.
Line Transport
Extension studies
(JLE) Chesterton Residential Positive impact but variable – highest impact for apartments.
(2000 and Commercial Positive perception from estate agents, developers and investors and high occupancy levels.
2002)
Riley (2001) Land Aggregate increase in value of AED 78bn against a project cost of AED 21bn.
Dockland Groundsure The Isle of Dogs has been transformed from industrial brownfield land to London’s second financial centre (Canary Wharf)
Light and a robust office market with the development of the Docklands Light Railway (DLR), and the later arrival of the Jubilee
Railway Line extension. The housing market subsequently responded, with high-end developers attracted by the opportunity to build
(DLR) and significant schemes including Pan Peninsula and Baltimore Wharf.
Jubilee
Line C&W consider that it was not until the arrival of the jubilee line extension that residential values were significantly impacted.
Extension, We consider that this was because the jubilee line provided a significantly large and influential transport infrastructure
Isle of compared to the DLR which was of a smaller scale and impact.
Dogs
A 2004 TfL report suggested that the uplift in values attributed to the Jubilee Line Extension is in the region of £2.8bn in the
proximity of Canary Wharf and Southwark Underground Stations.
£2bn around Canary Wharf Underground station;
£800m around Southwark Underground station.
East Residential Completion on these transport upgrades led to price increases of up to 15% more than the market average.
London
Line
Extension/
London
Orbital
Overgroun
d
30 |PageCrossrail 2 Residential & Crossrail 2 and the NLE to Clapham Junction could increase residential capital values along the route by up to £32bn existing
& Northern Commercial office capital values increase by up to £5.8bn, according to Carter Jonas’ ‘Track to the Future’ research report. The average
Line value impact may be up to 50% over existing values.
Extension
(NLE)
High C&W Real A study undertaken by C&W in December 2010 explored the potential impact of HS2 on values with a focus on Birmingham
Speed 2 Estate NEC site. C&W forecast that High Speed 2 will significantly increase business travel rather than commuting between
Information Birmingham and London. Therefore it expected potential uplift to be most pronounced for commercial and office space rather
Pack than residential.
December
2010 Economic impact studies of high speed rail lines suggest that it will increase GDP by 1-3% within the region. Whilst these
benefits may sound modest at certain high speed station sites there may be large increases in commercial activity and
commensurate increases in land values at a local level, with uplifts in excess of 50% having been observed. However it
should be noted that this growth has been largely attributed to displacement of other businesses than net gains of new
employment (Leading edge, 2009).
C&W reported that the impact that the HS1 rail network had on residential price increases across the network ranged from
0.1% - 14.4% which was linked to commuting times to London and the extension enabled three major development sites.
C&W predicted that the creation of an economic hub on the Birmingham NEC site with HS2, will have a localised impact on
commuting patterns and reported that it expected to see an increase in commuting and house prices in the immediate area.
Kensal is different from HS2 in that HS2 connects two economic regions together. Kensal will connect a ‘London suburb’ to
a ‘central’ business district/ central London and therefore the impact for residential values is likely to be more significant.
South Axis, Debrezion Residential +4% generally, but negative if too close (205 – 500m) to stations.
Amsterda (2006) Commercial +14% increase within 400m of stations. Basically limited to reasonable walking distance.
m HSL
South
Services
T2 Boucq (2007) Residential No increase before opening, progressive increase in prices for 4 years after opening.
Tramway –
Hauts De
seine
Departmen
t, France
31 | P a g eDublin Mayor, Lyons Residential +7-17% between 500m and 2,00m of stations Area Rapid Duffy and Transit Richard (2009) (DART) Asia Talpel Hwang Lin Land +25% MRT (2003) Tokaldo Cervero Land (for Up to +27% within 50m of stations. Line, (1998) commercial) Japan Guangzho C&W (2009) Land +15-25% on commencement with another +15-25% once the line opened against a benchmark market uplift of 5% pa. u Line 2 (China) Shanghai C&W (2009) Residential +50% (in sales prices) within 1 year of completion against an average increase of Shanghai residential property which was MRT Line 17%in 2003. 5 (China) Shenzhen C&W (2009) Residential +100% (in sales prices) within 1 year of completion against an average increase of Shanghai residential property which MRT Line was 17% in 2003. 1 (China) Hong Kong C&W (2008) Residential +24.3% (in sales prices) average increase within a radius of 400m around MRT station. +31.5% within 100-200m. MRT Tongzhou Gu (2006) Residential 1.8% every 1,000m from stations. Metro North America San Apta (2002) Single family +AED 2,900 depreciation per 1.6km (mile) from stations Francisco and Gruen & homes. +15-26% Bay Area Associates Apartment +AED 272/sq ft within 0.4km (¼ mile) and +AED 110/sq ft with 0.8 km (½ mile). Rapid (1997) rents comm. Transit land values. (BART) San Landis and Residential +38% (in sales prices) for property immediately adjacent to station (35km away) Francisco Cervero Bay Area (1995) Rapid Transit (BART) 32 |Page
Portland      Duecker and     Residential     +10.6% within 500m of stations, 2 years after the operation in the East Burnside area.
 Eastside      Stratham
 Metropolita   (1994)
 n Area
 Express
 Washingto     Benjamin and    Residential     -2.4-2.6% (in rental values) every 0.2 km (1/10th of a mile) from the Metro stations.
 n DC          Sirmans
 Metro         (1996)
 Toronto       Hack (2002)     Commercial      +30% within 500m of station which is +10% over the city average.
 Subway /                      Residential     +20% (max) for properties “close” to the stations.
 Rapid
 Transit
 Southern      Both (1991)     Residential     +10% for properties near commuter rail stations.
 New
 Jersey
 Line
 (PATCO)
 Philadelphi
 a
 Boston        Armstrong and   Residential /   +10% for properties within 0.8km (½ mile) of stations.
 Subway        Rodruguez       Commercial      +6.7%.
               (2006)          Single family
                               residential
 Dallas        Cwer and        Residential /   +31%within 0.4km (¼ mile) form LRT station compared with +19.5% at other stations.
 Area Rapid    Weinstein       Commercial
 Transit       (2002)
 (DART)
 Santa         Weinberger      Land (for       +23% within walking distance of stations.
 Clara         (200)           commercial
 California                    use)
 Light Rail
 Transit
 Atlanta       Nelson and      Residential     No uplift.
 Light Rail    McClesky
 (MARTA)       (1989)
 Miami         Gatzlaff and    Residential     No uplift.
 Metrorail     Smith (1993)

33 | P a g e
You can also read