The Drivers of Economic Inequality - A primer OXFAM AMERICA
←
→
Page content transcription
If your browser does not render page correctly, please read the page content below
OXFAM AMERICA
RESEARCH BACKGROUNDER

The Drivers of
Economic Inequality
A primer
V. Nicholas Galasso
CONTENTS
Oxfam America’s Research Backgrounders .............................................. 3
Author Information and Acknowledgments ................................................ 3
Citations of this paper ................................................................................ 3

Acronyms and Abbreviations ..................................................................... 5

Introduction ................................................................................................ 6

1 Inequality from a global and country perspective ................................. 7
1.1 Snapshots of global inequality ............................................................. 7
1.2 Inequality over time—from class to location ........................................ 8
1.3 How has global inequality changed in recent decades? ...................... 9
1.4 Economic growth & inequality in China & India ................................. 12
1.5 Trending income inequality within China & India ............................... 14
1.6 Inequality within countries .................................................................. 15
1.7 Top incomes ...................................................................................... 22
1.8 Summary ............................................................................................ 24

2 The drivers of economic inequality .................................................... 26
2.1 Introduction ........................................................................................ 26
2.2 Horizontal inequalities ........................................................................ 26
2.3 Geography ......................................................................................... 28
2.4 Technology ........................................................................................ 30
2.5 Financial and trade globalization ....................................................... 32
2.6 Weak wage setting institutions ........................................................... 35
2.7 Political inequality and capture .......................................................... 36
2.8 Other drivers ...................................................................................... 37

Research Backgrounders Series Listing .................................................. 39

1                                                                          The Drivers of Economic Inequality
OXFAM AMERICA’S
RESEARCH BACKGROUNDERS
Series editor: Kimberly Pfeifer

Oxfam America’s Research Backgrounders are designed to inform and foster
discussion about topics critical to poverty reduction. The series explores a range
of issues on which Oxfam America works—all within the broader context of
international development and humanitarian relief. The series was designed to
share Oxfam America’s rich research with a wide audience in hopes of fostering
thoughtful debate and discussion. All Backgrounders are available as
downloadable PDFs on our website, oxfamamerica.org/research, and may be
distributed and cited with proper attribution (please see following page).

Topics of Oxfam America’s Research Backgrounders are selected to support
Oxfam’s development objectives or key aspects of our policy work. Each
Backgrounder represents an initial effort by Oxfam to inform the strategic
development of our work, and each is either a literature synthesis or original
research, conducted or commissioned by Oxfam America. All Backgrounders
have undergone peer review.

Oxfam America’s Research Backgrounders are not intended as advocacy or
campaign tools; nor do they constitute an expression of Oxfam America policy.
The views expressed are those of the authors—not necessarily those of Oxfam.
Nonetheless, we believe this research constitutes a useful body of work for all
readers interested in poverty reduction.

For a full list of available Backgrounders, please see the “Research
Backgrounder Series Listing” section of this report.

Author information and acknowledgments
V. Nicholas Galasso, Ph.D., Research and Policy Advisor, Oxfam America

Citations of this paper
Please use the following format when citing this paper:

Galasso, V. Nicholas, “The Drivers of Economic Inequality: A Backgrounder for
Oxfam’s Inequality Campaign,” Oxfam America Research Backgrounder series
(2014): www.oxfamamerica.org/publications/the-drivers-of-economic-inequality-
the-primer.

The Drivers of Economic Inequality                                                   2
For permission to publish a larger excerpt, please email your request to
permissions@oxfamamerica.org.

3                                                 The Drivers of Economic Inequality
ACRONYMS AND
ABBREVIATIONS
BRICSAMIT           Brazil, Russia, China, South Africa, Mexico, Indonesia, Turkey

FDI                 Foreign Direct Investment

GATT                General Agreement on Tariffs and Trade

GDP                 Gross Domestic Product

HI                  Horizontal Inequalities

IFIs                International Financial Institutions

IMF                 International Monetary Fund

LICs                Low Income Countries

MDGs                Millennium Development Goals

MICs                Middle Income Countries

OECD                Organisation for Economic Co-operation and Development

PPP                 Purchasing Power Parity

VI                  Vertical Inequalities

WTO                 World Trade Organization

The Drivers of Economic Inequality                                               4
INTRODUCTION
This paper is intended to offer a background of the state and drivers of global
economic inequality. The paper is divided into two major parts. The first is
descriptive and the second explanatory. The first part provides a snapshot of
global economic inequality, along with a discussion of how economic growth and
poverty reduction in China (and to a lesser extent India) altered the global
distribution of income and wealth. The second major part provides a short
analysis of the major drivers of inequality. The overview of the drivers is not
exhaustive, however, as there are other contributing factors outside of the reach
of a paper such as this.

It can be a herculean task to wrap one’s head around economic inequality. It
involves taking into account population growth, economic dynamics,
geographies, political institutions, and social discrimination - simultaneously. This
paper intends to offer a concise account of trends (both globally and within
countries) over recent decades to inform Oxfam staff on these issues.

5                                                   The Drivers of Economic Inequality
INEQUALITY FROM A GLOBAL
AND COUNTRY PERSPECTIVE

1.1 SNAPSHOTS OF GLOBAL INEQUALITY
It is difficult to conceptualize economic inequality. In part, this is because
inequality is such a relative experience. Throughout this section, inequality is
treated in two ways: First, through a global lens and then through a country lens.
Global inequality refers to inequality among individuals of the world,
without reference to the countries where people live. Basically, imagine lining
up everyone on the planet by their income and wealth status. Inequality can also
be measured at a country level. Entire countries can be compared to one
another, or we can look inside specific countries and focus on national
distributions. Figure 1 offers three different ways to think about global inequality.1

1
    Anthony Shorrocks, Jim Davies, and Rodrigo Lluberasis, "Global Wealth Report," (Zurich,
    Switzerland: Credit Suisse Research Institute, 2013); Branko Milanović, The Haves and the
    Have-Nots : A Brief and Idiosyncratic History of Global Inequality (New York: Basic Books, 2011);
    Dalton Conley, You May Ask Yourself : An Introduction to Thinking Like a Sociologist (New York:
    W.W. Norton & Co., 2011).

The Drivers of Economic Inequality                                                                 6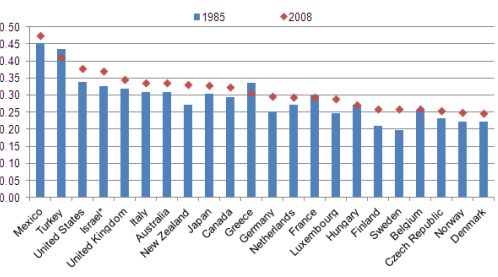
Figure 1a. Snapshots of global inequality

Source: Credit Suisse Wealth Report (2013)

7                                            The Drivers of Economic Inequality
Figure 1b. Snapshots of global inequality

Source: Milanovic (2012)

Figure 1c. Snapshots of global inequality

Source: Conley (2011)

The Drivers of Economic Inequality          8
1.2 INEQUALITY OVER TIME—FROM CLASS TO
LOCATION
Global inequality is higher than any one country’s inequality level.2 Further, the
trend of high global inequality appears to have hardly moved in decades. One
estimate suggests that between 1998 and 2008 the global Gini shifted from 76.3
to 75.9 percent. Alas, despite the absolute decrease of extreme poverty over this
period, global inequality is largely unchanged.3

How did the world become so unequal?

Inequality between people and countries grew substantially from the early 1800s
to the middle of the 20th century. Before this divergence began, individuals
throughout the world had more similar living standards.4 Two hundred years ago,
Western countries were roughly 90 percent richer than the rest. This may sound
like a lot; however, by 2000 this gap skyrocketed 750 percent.5 The Industrial
Revolution caused the widening to occur by sparking rapid median income
growth in Western Europe and its offshoots, compared to mean incomes
elsewhere.6

We should think of inequality before the 1820s as mostly an outcome of class
structures within countries, since differences in wealth and earnings between
people living in different countries were closer. By contrast, inequality today is
mostly a consequence of where someone is born or lives.7

2
    This understanding is derived from the Gini Coefficient. The Gini is a standard measure of
    inequality. It ranges on a scale between 0 and 100 (sometimes it is written as ranging between 0
    and 1). Zero indicates total equality and one hundred (or ‘1’) indicates total inequality (meaning
    all the income, wealth, or whatever is being measured is consolidated by a single actor).
    According to PovcalNet, the range of country Gini levels is from 19.4 to 74.3 percent, with an
    average of 42.2 percent. Only two countries have Gini levels higher than 70 percent (Jamaica
    and Namibia).
3
    Christoph Lakner and Branko Milanović, "Global Income Distribution from the Fall of the Berlin
    Wall to the Great Recession," (Washington, D.C.: The World Bank, 2013).
4
    Lant Pritchett, "Divergence, Big Time," Journal of Economic Perspectives 11, no. 3 (1997).
5
    Western countries reflected in this figure include Austria, Belgium, Denmark, Finland, France,
    Germany, Italy, Netherlands, Norway, Sweden, Switzerland, the UK, Japan, Australia, New
    Zealand, Canada and the US. See Angus Maddison, "Contours of the World Economy and the
    Art of Macro-Measurement 1500-2001," in Ruggles Lecture, IARIW 28th General Conference
    (Cork, Ireland 2004).
6
    The US, Canada, Australia, and New Zealand.
7
    For an overview of historical changes in global inequality, see Branko Milanović, "Global
    Inequality and the Global Inequality Extraction Ratio: The Story of the Past Two Centuries," The
    World Bank; Francois Bourguignon and Christian Morrisson, "Inequality among World Citizens:
    1820-1992," American Economic Review 92, no. 4 (2002); Angus Maddison, "Measuring and
    Interpreting World Economic Performance 1500-2001," Review of Income and Wealth 51, no. 1
    (2005).

9                                                               The Drivers of Economic Inequality
1.3 HOW HAS GLOBAL INEQUALITY CHANGED IN
RECENT DECADES?
The great global divergence between the early industrializing nations and the rest
of the world grew throughout the 19th and early 20th centuries, plateauing around
1950. Between 1960 and 1980, global inequality remained stable. Poor countries
were not catching up to rich countries, nor were rich and poor countries
converging.8 However, this trend began changing by the early 1980s. Growth
took off in rich countries, raising median incomes faster than in poor countries.
This would suggest global inequality was set to become worse in coming
decades. Instead, global inequality held constant between rich and poor
countries. The reason for this is China’s economic reforms, which led to
significant growth. The result was that this growth pulled hundreds of millions out
of extreme poverty, thereby offsetting the inequality inducing rise of median
incomes in rich countries.
Previously, it was thought that the offsetting effect of China’s growth (with
contributions from other developing countries) was causing global inequality to
decline. However, these calculations do not account for the growth of top
incomes during the past 20 years. Factoring in top incomes is difficult because
measures of economic inequality are determined through national level surveys.
The results tend to underestimate inequality because the rich are less
represented in such surveys.9 For instance, Lakner and Milanović estimate the
global Gini moved from 76.3 to 75.9 percent between 1988 and 2008 (as shown
above). However, if their estimate of top incomes is removed from the sample,
the figures become 72.5 percent for 1988 and 69.6 percent for 2008.10
Therefore, accounting for top incomes is a crucial factor in assessing global
inequality trends. Without such estimates, it appears as though global inequality
has fallen. However, including top income estimates suggests global inequality
has hardly moved.
1990 to the present
Although global inequality remained largely unchanged, we have seen important
shifts in the arrangement of the global distribution. Today, millions of people who
were living in low-income countries (LICs) in the 1980s now occupy the middle of
the global income ladder (again, this is mostly because of China). Figure 2
demonstrates income growth for percentiles of the global distribution between
8
Milanović, The Haves and the Have-Nots : A Brief and Idiosyncratic History of Global Inequality.
9
James E. Foster, Suman Seth, Michael Lokshin, and Zurab Sajaia, "A Unified Approach to
Measuring Poverty and Inequality Theory and Practice," World Bank,
http://elibrary.worldbank.org/doi/book/10.1596/978-0-8213-8461-9.
10
Milanović, "Global Income Distribution from the Fall of the Berlin Wall to the Great Recession."
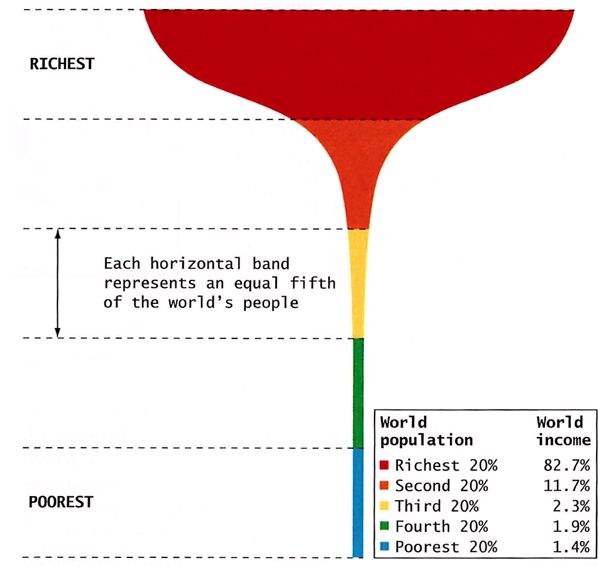
The Drivers of Economic Inequality 101988 and 2008. Each percentile represents the total mean growth rate between
the two data points. As we can see, the largest growth occurred between the 50th
and 60th percentiles. Growth was lower than the average around the 75th
percentile, and then reverts back to higher than the average at the top 1 percent.
As Milanović says, those in the 50th to 60th, and top 1 percent, are winners of
globalization, whereas those in the 75th (made up of low income earners in
advanced economies) are the losers.11
Figure 2. Percentage change of real incomes, 1988-2008
Source: Milanović, 2012
What nationalities are represented by the changes in the global distribution in
Figure 2? From which countries, for instance, do those occupying the bulging 50th
to 60th percentiles hail? What about the top 1 percent? As Figure 3 (below)
shows, the Chinese experienced the largest growth, as average incomes tripled
over this period. With contributions from India and some other developing
countries, the middle of the global distribution is now mostly occupied by the
Chinese. However, as Figure 3 demonstrates, Chinese income growth was
strongly pro-rich (in fact, the growth of China’s upper deciles had the biggest
impact on changes to the global distribution). Therefore, while millions left
extreme poverty in China over these two decades, economic inequality rose
significantly. The growth of China’s rich also changed the country composition of
the global distribution. Whereas the richest Chinese only made it to between the
11
Milanović, The Haves and the Have-Nots : A Brief and Idiosyncratic History of Global Inequality.
11 The Drivers of Economic Inequality65th and 70th percentiles in 1988, today China’s top decile reaches as far as the
80th to 85th percentiles.12
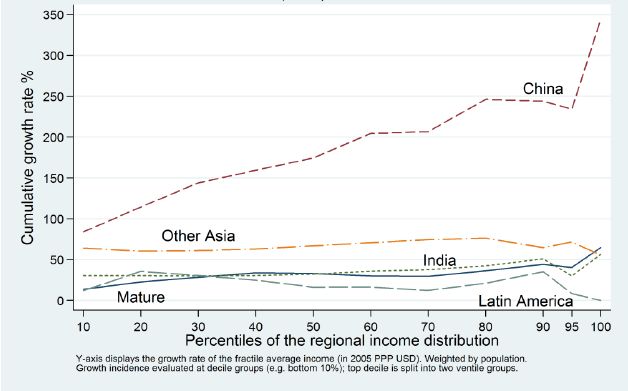
Turning to other regions, income growth in Latin America has been marginally
lower than the global average, whereas sub-Saharan Africa saw virtually no
growth (not shown). In sum, China and Other Asia saw the largest growth. India
and advanced economies (Mature) also experienced above average growth.
Figure 3. Global growth incidence curve by region, 1988-2008
Source: Lakner and Milanović, 2013
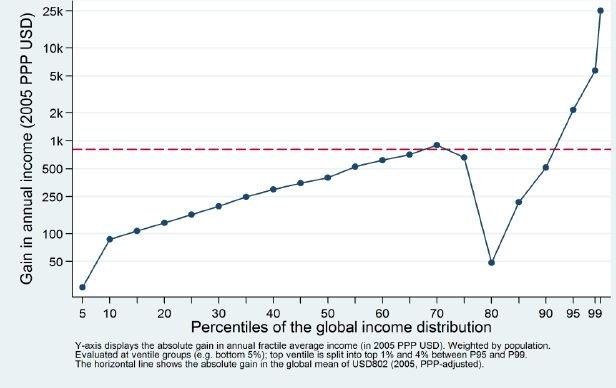
The other bulge in the global income distribution is at the top 1 percent, which
indicates that those already at the top also did quite well. It is important to
recognize that growth in Figure 2 is measured in relative terms between the two
dates for every percentile (1988 and 2008). Therefore, the absolute gains made
by the top 1 percent are magnitudes larger than those below. For instance, the
per capita income of the top 1 percent in 1988 was $PPP 39,000, whereas the
median income was $PPP 600. As Figure 4 shows, the average per capita
income of the top 1 percent increased by $PPP 25,000 while the absolute gain at
the global median was only $PPP 400. Overall, 44 percent of the growth between
1988 and 2008 went to the top 5 percent of the world population.
12
Milanović, "Global Income Distribution from the Fall of the Berlin Wall to the Great Recession."
The Drivers of Economic Inequality 12Figure 4. Absolute income gains, 2008-2013
Source: Lakner and Milanović, 2013
1.4 ECONOMIC GROWTH AND INEQUALITY IN
CHINA AND INDIA
After significant market reforms in the late 1970s, China’s economy began to
grow rapidly, producing real increases in average incomes in the world’s most
populous country. The effect was to offset income growth in rich countries,
thereby curbing any increases to global inequality during the 1980s. The impact
of rising average incomes in China during this period cannot be overstated. If not
for China’s rising incomes, global inequality would likely have become much
worse. India, the world’s second most populous country, would eventually
contribute to China’s curbing role with its own economic expansion and rising
average wages.
In 1980, China and India accounted for approximately 2 percent of global Gross
Domestic Product (GDP), with other developing countries making up about 16
percent. By 2005, China and India nearly quadrupled their share to 7 percent,
while other developing countries declined to 15 percent.13 The past three
decades have seen China’s trade volume increase eightfold, edging out
13
Maurizio Bussolo, Rafael E. De Hoyos, Denis Medvedev, and Dominique Van der Mensbrugghe
"Global Growth and Distribution : Are China and India Reshaping the World?," World Bank,
Development Economics Prospects Group, http://www-
wds.worldbank.org/external/default/WDSContentServer/WDSP/IB/2007/11/12/000158349_20071
112111936/Rendered/PDF/wps4392.pdf.
13 The Drivers of Economic InequalityGermany in 2009 to become the world’s largest exporter.14 Wages in China’s
manufacturing sector have also increased dramatically over the past decade.
Between 2002 and 2009, average manufacturing wages rose rapidly, from $0.60
to $1.74 an hour.15 Calculated monthly, between 2005 and 2010, average wages
increased from $150 to $350 per month, to $4200 per year.16 So long as growth
remains steady, the wage gap between China and upper-middle-income
economies should continue to close. China’s 12th Five Year Plan predicts that if
its economy grows at 7 percent per year, wages will expand equally fast and may
double in the next decade, to $700 per month. If China’s currency continues to
appreciate, its real wages could approach $1000 per month, putting it on par with
high-middle-income countries such as Turkey and Brazil. The same estimates
predict that steady growth could even see real wages as high as $2000 a month,
leveling Chinese workers with counterparts in Taiwan and South Korea.17
Although less impressive than China, India’s growth is also remarkable,
averaging around 4 percent per year since 1980. Much of this growth is from its
dynamic service sector, which grew annually at 1.4 percent between 1978 and
1993, and then to 3.9 percent between 1993 and 2004.18 Between 1978 and
2000, the service sector increased its share of GDP from 38 to 49 percent.19
Estimates suggest that incomes in India will catch up from one tenth of average
incomes in rich countries to one sixth by 2030.20
Although poverty is still widespread, the years of strong growth have significantly
affected extreme poverty levels in both countries. China saw the number of
people living below $1.25 per day decrease from 835 million to 157 million
between 1981 and 2009.21 India’s gains in poverty reduction have been more
recent. Between 2005 and 2012, the percentage of the rural population living on
14
Ardo Hansson, Louis Kuijs, Alvaro Vincelette Manoel, and Andronova Gallina "China : Global
Crisis Avoided, Robust Economic Growth Sustained," The World Bank,
http://elibrary.worldbank.org/content/workingpaper/10.1596/1813-9450-5435.
15
U.S. Bureau of Labor Statistics, International Labor Comparisons.
http://www.bls.gov/fls/china.htm#manufacturing
16
Oxford Analytica, March 28, 2011. In 2010-2011, China’s minimum wage grew by 25% in 30
municipalities.
17
V. Chandra, J. Y. Lin, and Y. Wang "Leading Dragon Phenomenon: New Opportunities for Catch-
up in Low-Income Countries," Asian Development Review 30, no. 1 (2013).
18
Pranab K. Bardhan, "Poverty and Inequality in China and India: Elusive Link with Globalisation,"
Economic and Political Weekly 42, no. 38 (2007).
19
Mohammad Amin and Aaditya Mattoo, "Human Capital and the Changing Structure of the Indian
Economy," World Bank, Development Research Group, Trade Team,
http://dx.doi.org/10.1596/1813-9450-4576.
20
Bussolo, "Global Growth and Distribution : Are China and India Reshaping the World?".
21
The World Bank, POVCAL.
The Drivers of Economic Inequality 14less than $1.25 per day decreased by 9.55 percent. Within cities, the number is
down 7.23 percent.22
Inequality within China and India is a different story. Despite impressive gains in
average incomes and poverty reduction, inequality has risen along with growth.
In both countries, the benefits of growth have been unevenly distributed by
geography, economic sector, and even within households.23
1.5 TRENDING INCOME INEQUALITY WITHIN CHINA
AND INDIA
Before the reforms of the late 1970s, more than 80 percent of the Chinese
population lived in absolute poverty. Since reform, its Gini index has risen from
29.1 percent in 1981 to 42.1 percent in 2009. Much of China’s inequality is
explained by differences in regional development and the contrast between
urban and rural areas. Geographic inequalities also layer upon ethnic
inequalities, as China’s minority populations live primarily in the rural northeast,
south-central, and southwest regions of the country (whereas China’s urban
centers lie along its eastern coastline). The majority Han population is
considerably more urban than China’s ethnic minorities. Urban household
income per capita is 2.5 times that of rural counterparts. Unfortunately, ethnic
minorities are more likely to be poor and have less access to education, health,
and economic opportunities.24
India has historically been a highly unequal society. Its caste system inhibits
social mobility, and landlessness is a primary determinant of poverty.25 As in
China, geography correlates significantly with inequality. A major issue
confronting policymakers is how better to incorporate excluded Indian states into
the development process.26 Uneven economic growth has only made India’s
social stratification worse. Unlike China and Vietnam, India’s export expansion
has been in capital and skill-intensive industries. Therefore, the benefits of
22
The World Bank, "New Estimates Reveal Drop in Extreme Poverty 2005-2010,"
http://go.worldbank.org/4K0EJIDFA0.
23
Sachin Chaudhuri and Martin Ravallion, "Partially Awakened Giants: Uneven Growth in China
and India," Dancing with giants : China, India, and the global economy (2007).
24
Emily Hannum, "Ethnic Disparities in China: Geography, Rurality, and Socioeconomic Welfare,"
in Indigenous Peoples, Poverty, and Development, ed. Gillette Hall and Harry Anthony Patrinos
(New York: Cambridge University Press, 2012).
25
K. Deininger, S. Jin, and H. K. Nagarajan "Land Reforms, Poverty Reduction, and Economic
Growth: Evidence from India.(Report)," Journal of Development Studies 45, no. 4 (2009).
26
Amitabh Kundu and K. Varghese, "Regional Inequality and ‘Inclusive Growth’ in India under
Globalization: Identification of Lagging States for Strategic Intervention " in working papers series
(Oxfam India, 2010 ).
15 The Drivers of Economic Inequalitygrowth have yet to reach the county’s large number of unskilled workers.27
Between 1994 and 2005, India’s Gini increased from 31 to 33 percent.28
1.6 INEQUALITY WITHIN COUNTRIES
Although global inequality barely moved in recent decades, inequality within
countries continued to rise. In middle-income countries (MICs), millions escaped
extreme poverty but now hover just above the poverty threshold. In the advanced
economies, income inequality came down over the second half of the 20th century.
Yet, the trend is reversing - even among northern Europe’s social democracies.
The trend is not totalizing, however, and inequality has declined or is showing
signs of decline in certain countries in recent years. Vietnam, South Korea, Mexico,
and Brazil are among a small number of countries that have reduced, or are
moving in the direction of lowering income inequality within their borders.
The figures below depict growing income inequality among some of the most
populous middle-income countries in the world (Russia, a high-income country, is
included, too).29 The data present the changing distributions of national income
accruing to the top 10 percent and the bottom 40 percent of earners. These are
national snapshots and hide more nuanced facts concerning income inequality.
For instance, a more fine-grained analysis would include trending income
inequalities between rural and urban earners, or across social identifiers such as
gender and ethnicity.
27
P. Bardhan, "Poverty and Inequality in China and India: Elusive Link with Globalisation,"
ECONOMIC AND POLITICAL WEEKLY 42, no. 38 (2007).
28
World Bank Poverty and Inequality Database.
29
Country classifications are based on the World Bank’s Country and Lending Group categories.
See http://data.worldbank.org/about/country-classifications/country-and-lending-groups. With the
exception of the Russian Federation, all countries in the charts are classified as middle-income
countries. The Russian Federation is classified as a high-income economy.
The Drivers of Economic Inequality 16Figure 5. Indonesia (lower-middle income country)
35
30
Income
share
held
by
25
highest
10%
Income
share
20
held
by
lowest
40%
15
1984
1990
1996
2002
2008
2011
Source: Author’s calculations using World Bank data (2013)
Figure 6. China (Upper-middle income country)
37
32
Income
share
held
by
27
highest
10%
22
Income
share
17
held
by
lowest
40%
12
1981
1987
1993
1999
2005
Source: author’s calculations using World Bank data (2013)
Figure 7. India (Lower-middle income country)
30
Income
share
25
held
by
highest
10%
20
Income
share
held
by
lowest
40%
15
1994
2005
2010
Source: author’s calculations using World Bank data (2013)
17 The Drivers of Economic InequalityFigure 8. Pakistan (lower-middle-income country)
30
28
Income
share
held
by
26
highest
10%
24
Income
share
22
held
by
lowest
40%
20
2002
2005
2006
Source: author’s calculations using World Bank data (2013)
Figure 9. Nigeria (lower-middle income country)
40
35
30
25
Income
20
share
held
15
by
highest
10
2004
2010
Source: author’s calculations using World Bank data (2013)
Figure 10. Russian Federation (high-income country)
40
35
Income
share
30
held
by
25
highest
10%
20
Income
share
held
by
15
lowest
40%
10
2002
2003
2004
2005
2006
2007
Source: author’s calculations using World Bank (2013)
The Drivers of Economic Inequality 18Inequality is rising in many advanced economies, even where equality was
strong during the 20th century. Figure 11 represents changing ratios of
disposable income between the top 10 percent of earners and the bottom 10
percent in select Organisation for Economic Co-operation and Development
(OECD) economies.
Figure 11. P90/P10 Disposable income decile ratio, OECD
6.5
6
5.5
United
States
5
Denmark
4.5
4
France
3.5
Israel
3
Netherlands
2.5
2
2000
2005
2008
2010
Source: author’s calculations using OECD P90/P10 Disposable Income Decile Ratio Statistics
Gini coefficients also point to growing income inequality across the wider OECD.
According to the OECD data, inequality increased in 19 out of 24 countries from
the mid 1980s to late 2000s. for instance, inequality is higher today in Canada,
Denmark, France, Germany, Norway, and Sweden. Across advanced
economies, the average income of the richest 10 percent is nine times that of the
poorest. In Italy, Japan, and Korea the gap between the richest and poorest 10
percent has grown to 10 to 1. In Israel, Turkey, and the U.S. it is 14 to 1. The gap
is 25 to 1 in Mexico and Chile.30 Figure 12 compares the Gini of select OECD
countries between 1985 and 2008.
30
OECD, "Divided We Stand: Why Inequality Keeps Rising," (2011).
19 The Drivers of Economic InequalityFigure 12. Income inequality changes across OECD, mid 1980s and late
2000s
Source: OECD Statistics, Divided We Stand
http://www.oecd.org/newsroom/societygovernmentsmusttacklerecordgapbetweenrichandpoorsaysoecd.htm
Figure 13 divides the mean disposable income of the top earning decile against
the bottom 4 deciles to produce what is called a Palma ratio for select OECD
countries. Comparing 1995 and 2008 data points, income inequality between the
top 10 percent and bottom 40 percent has worsened in all 14 countries
measured, with the exception of Italy and the Netherlands. However, post-2008
data suggest that despite shifting downward, inequality is rising again in both
countries.31 A Palma ratio of 1 indicates that the top 10 percent captures the
same amount of national income as the bottom 40 percent. This ratio has been
argued as an ideal equity threshold.32 As figure 13 shows, Denmark, Norway,
Sweden, and Finland remain under this threshold, whereas Germany and France
are only slightly above. Although these countries remain either under or just
above, inequality is trending higher across all of these historically equal
countries.
31
See Loris Vergolini, "Income Inequalities in Italy: Trend Over Time." Presentation, Inequality
and Crisis in Europe Paris 8, Saint-Denis, April 6, 2012,
http://inequalitywatch.eu/IMG/pdf/Inequalities_Italy.pdf and
http://www.oecd.org/els/soc/49499779.pdf
32
Michael W. Doyle and Joseph E. Stiglitz, "Eliminating Extreme Inequality: A Sustainable
Development Goal, 2015–2030," http://www.ethicsandinternationalaffairs.org/2014/eliminating-
extreme-inequality-a-sustainable-development-goal-2015-2030/.
The Drivers of Economic Inequality 20Figure 13. Palma—Mean disposable income, working age population
1.8
1.6
1.4
1.2
1
0.8
0.6
1995
0.4
2008
0.2
0
Source: author’s calculations using OECD Statistics
Some countries have seen inequality decline. The rate and depth of decline,
however, vary significantly, and for some it is too soon to suggest a real trend.
For instance, Brazil, one of the most unequal countries in the world, has seen
income inequality contract since the early 2000s. However, it is unclear whether
inequality will continue to shrink as its economy slows. The following figures track
the contraction of income between the top 10 percent and the bottom 40 percent
in Brazil, Mexico, the Philippines, and Vietnam.
Figure 14. Brazil (upper-middle income country)
45
35
25
Income
15
share
held
by
highest
5
2001
2005
2007
2008
2009
2002
2003
2004
2006
Source: author’s calculations using World Bank data
21 The Drivers of Economic InequalityFigure 15. Mexico (upper-middle income country)
40
Income
share
30
held
by
highest
10%
20
Income
share
held
by
lowest
40%
10
2005
2006
2008
2010
Source: author’s calculations using World Bank data
Figure 16. Philippines (lower-middle income country)
40
30
Income
share
held
by
highest
20
10%
10
2000
2003
2006
2009
Source: author’s calculations using World Bank data
Figure 17. Vietnam (lower-middle income country)
30
Income
share
25
held
by
highest
10%
20
Income
share
held
by
lowest
40%
15
2002
2004
2006
2008
Source: author’s calculations using World Bank data
The Drivers of Economic Inequality 221.7 TOP INCOMES
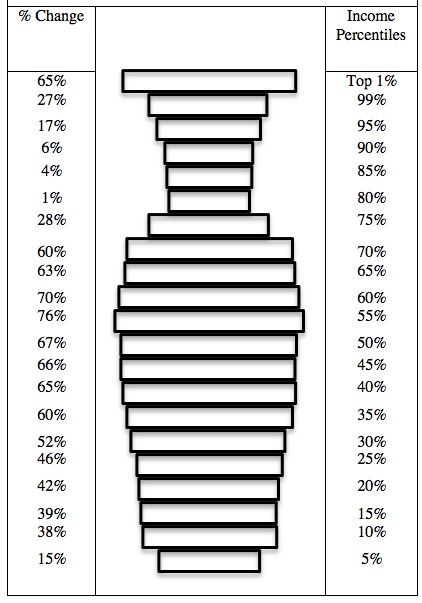
Globally, income is highly concentrated at the very top. In contrast to Figure 1,
which offers snapshots of the entire global income distribution, Figure 18
magnifies the very apex.
Figure 18. The apex of the global wealth pyramid
Source: Forbes Global Wealth Report (2013)
Growth of top incomes by country
In advanced economies, we now know a lot about the shares of national income
held by the top 1 percent and fewer. In contrast, we know very little about top
incomes in developing countries. As discussed earlier, it is difficult to assess the
shares of income and wealth among the rich through surveys. To get around this,
the economists associated with the World Top Incomes database began to
examine the government tax records of the richest percentiles in advanced
economies.33 Similar exercises are underway in developing countries, but this is
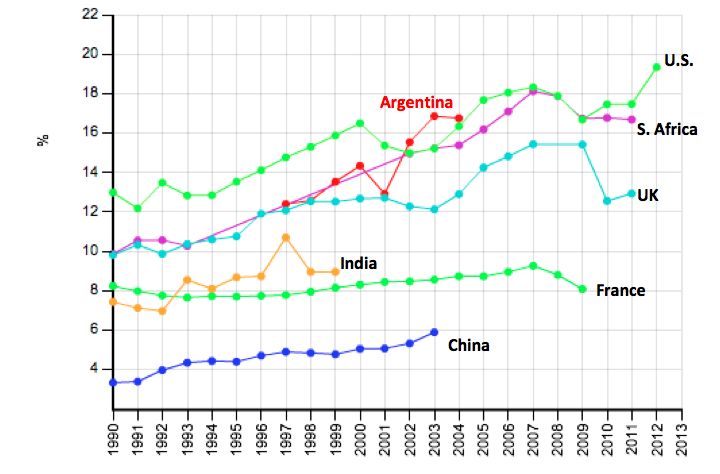
a more difficult task. Figure 19 demonstrates the trend of concentrating incomes
among the top one percent in seven countries. As shown, good data exists for
the US, the UK, and France. The data are less complete, however, for Argentina,
South Africa, India, and China.
33
Facundo Alvaredo, Anthony B. Atkinson, Thomas Piketty, and Emmanuel Saez, The World Top
Incomes Database, http://topincomes.g-mond.parisschoolofeconomics.eu/, August 21, 2014.
23 The Drivers of Economic InequalityFigure 19. Top 1 percent share of national income
Source: Facundo, Atkinson, Piketty, and Saez, World Top Incomes Database
Growth of billionaires
Since Forbes began tracking in 1987, the number of billionaires has dramatically
increased from 140 to more than 1,600. As Oxfam calculated in January 2014,
the richest 85 people possess the same amount of wealth as the bottom half of
humanity.34 Forbes later recalculated our figure to account for changes in
billionaire wealth. Their revised estimate is that only 66 people hold the same
amount of wealth as the poorest half.35 Figure 20 charts both changes to the
number of individual billionaires and the amount of wealth held among this
cohort. Clearly, an enormous amount of wealth continues to accrue to a very few
number of people. To think about it differently, trillions are accruing annually to a
list of individuals that grows by a few dozen—if that—each year.
34
Ricardo and V. Nicholas Galasso Fuentes-Nieva, "Working for the Few: Political Capture and
Economic Inequality," in Oxfam Briefing Paper 178 (Oxfam International, 2014).
35
Kasia Moreno. “The 67 People As Wealthy As The World's Poorest 3.5 Billion,” Forbes, 25 March
2014, http://www.forbes.com/sites/forbesinsights/2014/03/25/the-67-people-as-wealthy-as-the-
worlds-poorest-3-5-billion/
The Drivers of Economic Inequality 24Figure 20. Growth of billionaires and billionaire wealth
$5,000.00
1200
Total Net Worth (Billions)
Number of Billionaires
$4,500.00 1100
$4,000.00 1000
$3,500.00 900
$3,000.00 800
$2,500.00 700
$2,000.00 600
500
$1,500.00
400
$1,000.00 300
$500.00 200
$- 100
1987
1990
1993
1996
1999
2002
2005
2008
2011
Total Net Worth Number of Billionaires
Source: Forbes
1.8 SUMMARY
This section presented a short history and current picture of income inequality
among countries and individuals. From this data, we can ascertain that inequality
between the economies of Western Europe and other regions grew rapidly and
significantly from the early 1800s until the middle of the 20th century. Inter-
country inequality remained roughly stable until the emergence of globalization in
the early 1980s. At this point, growth took off in advanced economies and
average incomes began rising in the West. Inequality between countries did not
increase, however. The start of market liberalization in China meant the average
income of the world’s most populous country rose, too. The effect curbed any
worsening of inter-country inequality. Conversely, inequality within countries
shifted in the opposite direction. In countries at all levels of development, certain
population segments gained greatly while others gained less, or not at all.
Unfortunately, it continues to be difficult to measure income inequality. For this
reason, the data reported by large international financial institutions (IFIs) and
country governments should be taken as best approximations of income
distributions. Many countries, especially in the developing world, have
administered income surveys for less than 30 years. This makes it difficult to
track changes accurately in the distribution over sufficient periods of time.
Further, for many countries it makes more sense to measure consumption than
income, as poor people often live outside money economies. In addition, a lack
of standardization among differing country surveys complicates international
25 The Drivers of Economic Inequalitycomparisons. The rich are also harder to reach and less inclined to reveal the
extent of their income and wealth. This leads many to assume that current
inequality estimates are conservative and that inequality is worse than the data
suggest.
For the US, the most significant change has been within the top decile. The
income differential between the apex of the distribution and the 90th percentile is
greater than the difference between the 90th percentile and everyone below.
Saez calculates that in 2010, the average income for families in the .01 percent
was $23,846,950. The average family income for those between .1 and .01
percent drops significantly, to $2,802,020.00, whereas the average for the 1
percent was $1,019,089.36 The average family income of those at the 90th
percentile was $246,934 whereas the bottom 90% averaged $29,840.37 From
1976 until 2011, the total share of income accruing to the top 1 percent more
than doubled, from 9 percent to more than 20 percent.38 Other upper percentiles
in the US also made gains, though none as significant as the top 1 percent. For
instance, the 95-99 percent only saw a 3 percent gain during the same period.
Between the boom years of 2002 and 2006, three-quarters of all economic gains
accrued to the top 1 percent of the population. In the post-crisis recovery, the top
1 percent captured 93 percent of the gains.39
Now that we have a sense of how global inequality has changed, and what it
looks like today, the next section explores the drivers of economic inequality.
36
Emmanuel Saez, "Striking It Richer: The Evolution of Top Incomes in the United States (Updated
with 2012 Preliminary Estimates)," (2013).
37
See Chrystia Freeland, Plutocrats : The Rise of the New Global Super-Rich and the Fall of
Everyone Else (New York: Penguin Press, 2012).
38
Thomas Piketty and Emmanuel Saez, "Income Inequality in the United States, 1913-1998," The
Quarterly Journal of Economics 118, no. 1 (2003).
39
Saez, "Striking It Richer: The Evolution of Top Incomes in the United States (Updated with 2012
Preliminary Estimates)."
The Drivers of Economic Inequality 26THE DRIVERS OF
ECONOMIC INEQUALITY
2.1 INTRODUCTION
This section offers an account of the drivers of economic inequality. To help with
clarity, the drivers are disaggregated into different buckets. Admittedly, there are
drawbacks to this approach. Primarily, although considering these issues
separately helps categorize them, it also obscures important nuances. For
instance, sources of inequality do not operate in isolation from one another.
Instead, they should be considered as highly interdependent, overlapping, and
reinforcing. Economic inequality is not the result of simple cause and effect,
rather it is the product of a complex web of phenomena involving the interplay of
social, geographic, economic, historical, and political forces.
2.2. HORIZONTAL INEQUALITIES
In many contexts, economic inequality is a product, and reflection, of horizontal
inequalities. The term “horizontal inequalities” (HI) refer to inequality among
salient groups, which may be culturally defined or constructed based on an array
of social identity features. This is distinct from conceptualizing inequality as a
rank among individuals or households, known as vertical inequalities (VI). For
instance, the language of the Millennium Development Goals (MDGs) focuses on
the sheer number of individuals living in poverty. Some critique this approach
because it does not address the group dimension of poverty. It is often
identifiable groups rather than discrete individuals who are disproportionately
excluded from societies’ resources.40
How are such groups defined? People can be grouped in many ways. In fact,
most people hold a multiplicity of identities and thus are members of many
groups simultaneously. Classification can be based on self-identification or can
result from legal categorization by a political authority (such as citizenship).41
Often, when referring to HI, we are describing groups that share a cultural
identity. Of course, the ties that bind groups together may also rest on ethnicity
40
Frances Stewart, "Horizontal Inequalities: A Neglected Dimension of Development," in QEH
Working Paper Series–QEHWPS81 (Queen Elizabeth House, University of Oxford, 2002).
41
Frances Stewart, Graham Brown, and Luca Mancini "Why Horizontal Inequalities Matter: Some
Implications for Measurement " in CRISE Working Paper No. 19 (Queen Elizabeth House,
University of Oxford, 2005).
27 The Drivers of Economic Inequality(such as a common history or language), religion, gender, geography, age, and
even class.
Rigid boundaries are paramount for classifying groups. Since HI tend to persist
over not only many years, but also generations, we must ensure we are focused
on groups whereby identity is easily knowable and difficult to transcend.
Therefore, the groups we are interested in are those where membership is
recognizable to both those inside and outside the group. This is not to suggest
that moving from one group to another is impossible, only that it is difficult. For
instance, it is challenging to transcend gender and citizenship.
HI describe how groups are structurally differentiated from each other based on
status and access to the range of a society’s resources. Figure 21 provides a
taxonomy of the economic, social, political, and cultural dimensions of HI groups’
experience.42
Figure 21. Typology of horizontal inequalities
• Economic HIs include inequalities in access to and ownership of assets—
financial, human, natural-resource-based, and social, and also inequalities in
income levels and employment opportunities, which depend on such assets
and the general conditions of the economy.
• Social HIs include inequalities in access to a range of services, such as
education, healthcare, and housing, as well as to the benefits of educational
and healthcare outcomes.
• Political HIs include inequalities in the distribution of political opportunities
and power among groups, including control over the army, the cabinet, local
and regional governments, parliamentary assemblies, the police, and the
presidency. They also encompass inequalities in people’s capacity to
participate politically and express their needs.
• Cultural status HIs include disparities in the recognition and standing of
different groups’ language, religion, customs, norms, and practices.
Source: Stewart (2010)
HI perpetuate through explicit or structural differential treatment among groups.
For instance, black Americans and women were long excluded from access to
economic opportunities and political decision-making (among other arenas).
These exclusions, exacerbated by socio-biological preconceptions concerning
42
Taken from Frances Stewart, "World Development Report 2011 Background Paper,"
(Washington, D.C.: World Bank, 2010).
The Drivers of Economic Inequality 28race and gender, still perpetuate HI between blacks, women, and white men,
despite the political emancipation of the former two.
A paramount concern of HI is their propensity to evolve into civil unrest and
violent conflict. To be clear, most multi-ethnic and multi-religious societies are
peaceful.43 However, societies plagued by economic and political inequalities
along group lines may instigate deep resentments leading to violence. This is a
serious ramification facing societies with deep HI.
2.3 GEOGRAPHY
Geography is arguably the most important determinate of inequality. In terms of
the global distribution among individuals, the country to which you are born, or
migrate, has more influence over your income and wealth status than any
amount of hard work, skills, or effort. Indeed, in many ways the lottery of life boils
down to where, and to whom, you are born.
Geography plays an important role in driving inequality within countries, too. For
instance, country regions may be characterized by differences in productivity
levels, allocation of government resources, and sheer distances to markets.
Government favoritism of certain regions over others can deepen inequalities
across groups, especially through unequal access to social services, educational
opportunities, and government revenues. Furthermore, differences in natural
resource endowments between regions can worsen inequalities.
The impact of geography on within country inequality is most evident between
urban and rural regions. A recent study of 65 countries (including lower middle
income, middle income, and some of the poorest countries in the world) suggests
urban-rural inequality accounts for 40 percent of mean country inequality, and
much of the variation in inequality across countries. Therefore, developing
countries with large levels of inequality most likely have significant urban-rural
disparities.44 Figure 22 demonstrates the fundamental shift in population between
rural and urban places in 100 Middle Income Countries (MICs).
43
James D. Fearon and David D. Laitin, "Ethnicity, Insurgency, and Civil War," American Political
Science Review 97, no. 1 (2003).
44
Alwyn Young, "Inequality, the Urban-Rural Gap, and Migration.(Report)," Quarterly Journal of
Economics 128, no. 4 (2013).
29 The Drivers of Economic InequalityFigure 22. Urban and rural population (percent of total population); Average
of 100 lower and upper-middle-income countries
60.00
55.00
50.00
45.00
Urban
Rural
40.00
1980
1982
1984
1990
1992
1994
2000
2002
2004
2010
2012
1986
1988
1996
1998
2006
2008
Source: author’s calculation from World Bank data
Natural resource endowments between regions are an important way in which
geography can worsen within country inequalities. For instance, mining activity in
Peru increased nearly twentyfold over the past two decades. Between 1993 and
2000, the value of mining exports more than doubled to $3.2 billion; and then
rose sevenfold between 2000 and 2010 to $21.7 billion. Mining now makes up 14
percent of Peru’s GDP. This dramatic expansion increased inequality between
producing and non-producing districts (the lowest administrative level in Peru).
Producing districts now enjoy better standards of living and larger household
consumption than otherwise similar districts.45 Conversely, extractive revenues
may bypass the producing regions and become invested in non-producing ones,
thereby worsening inequality in the opposite way. This tends to occur in countries
with centralized political systems, as central governments distribute revenues on
the basis of national government priorities or biases, not on where the revenues
originate. For instance, the capital region in Niger appropriates resource
revenues, yet invests little in the producing regions.46
The combination of regions differentiated by natural resource and ethnicity can
be a recipe for political unrest and violence. 47 Ethnically divided societies with
45
Norman Loayza, Jamele Rigolini, and Alfredo Mier y Teran, Poverty, Inequality, and the Local
Natural Resource Curse (Washington, D.C.: The World Bank, 2013).
46
Michael Ross, Paivi Lujala, and Siri Aas Rustad, "Horizontal Inequality, Decentralizing the
Distribution of Natural Resource Revenues, and Peace " in High-Value Natural Resources and
Post-Conflict Peacebuilding, ed. Paivi Lujala and Siri Aas Rustad (New York, NY: Earthscan,
2012).
47
Thorvaldur Gylfason and Gylfi Zoega, Inequality and Economic Growth : Do Natural Resources
Matter? (Munich: CESifo, 2002).see also Tullio Buccellato and Michele Alessandrini, "Natural
Resources: A Blessing or a Curse? The Role of Inequality," (Centre for Financial & Management
Studies, 2009).
The Drivers of Economic Inequality 30extractive industries experience higher levels of inequality and conflict than
homogenous societies.48 Distinct groups may fight one another or actively
engage in rent seeking to win control over revenues, in turn exacerbating HI.49
The presence of natural resource wealth can also push regions to seek
independence from the rest of the country. For instance, Ross, Lujala, and
Rustad cite 10 instances of secessionist movements between 1960 and 2005 by
regions with significant oil, gas, and mineral resources.50
2.4 TECHNOLOGY
Rising inequality can be a consequence of technological change, as
technological shifts favoring skilled over unskilled workers sometimes create
wage inequalities between the two groups. Research on the link between
technological changes and inequality can be traced at least to the economist
Simon Kuznets, famous for the Kuznets curve. However, this stream of literature
expanded in the 1990s due to new wage and inequality data from the 1970s and
1980s in advanced economies. Its core argument is that technological change,
especially the introduction of the computer, caused wage inequality to rise. New
technologies increased the productivity and demand for skilled workers, thereby
increasing their wages relative to unskilled workers’.
The technology hypothesis is useful for understanding wage inequality in
developing countries too, as technology transfers have created wage differentials
between skilled and unskilled workers. This effect is closely intertwined with
financial globalization, which is discussed in the next section, especially since
foreign direct investment (FDI) spurs technological diffusion and adaptation.51
Independently, technology engenders its own skills bias that returns higher
wages to skilled workers. FDI magnifies this disequalizing process by targeting
investment in higher skills and higher technologically dependent sectors. One
recent study calculates an average annual increase of the Gini coefficient at .42
percent between 1981 and 2003 for 51 countries. Of this, technology made a
48
See Benedikt Goderis and Samuel W. Malone, "Natural Resource Booms and Inequality: Theory
and Evidence," Scandinavian Journal of Economics 113, no. 2 (2011); Ruikang Marcus Fum and
Roland Hodler, "Natural Resources and Income Inequality: The Role of Ethnic Divisions,"
Economics Letters Economics Letters 107, no. 3 (2010).
49
Alberto Alesina and Edward L. Glaeser, Fighting Poverty in the Us and Europe : A World of
Difference (Oxford: Oxford University Press, 2004).
50
Ross, "Horizontal Inequality, Decentralizing the Distribution of Natural Resource Revenues, and
Peace ". Countries include Angola, Burma, Democratic Republic of the Congo, Indonesia (two
instances), Morocco, Nigeria, Papua New Guinea, Sudan, and Yemen.
51
Daron Acemoglu, "Patterns of Skill Premia," ROES Review of Economic Studies 70, no. 2
(2003). On technology diffusion, see Global Economic Prospects 2008: Technology Diffusion in
the Developing World. World Bank, 2008.
31 The Drivers of Economic Inequalitysignificant contribution of .74 percent annually.52 Clearly, technological change is
a significant driver of inequality.
Technology’s inequality-increasing effects may compound HI and the inequality
impact of geography. For instance, industries requiring higher skills tend to
emerge in urban rather than rural areas. Similarly, the rising wage gap between
skilled and unskilled workers often translates into a tension between
manufacturing and agricultural jobs, which tend to follow the geographic divide.
Becoming a higher-skilled worker may also require access to skills training or
education. These opportunities are often restricted by factors involving
geography and group identity (especially gender).
In advanced economies, technological change and globalization are often
presented as the most fundamental drivers of inequality in recent decades.
However, this simplified story faces empirical skepticism. First, if technological
change drives inequality, then the data should reflect a smooth increase as
technology slowly changed labor demand for higher skilled workers. Instead,
inequality ballooned in the 1980s. Second, even though there was widespread
adoption of new technologies across high-income countries, wage inequality
worsened much more in the U.S., and to a lesser extent in the UK, than in other
advanced economies.
A revised hypothesis emerged to meet these critiques. This hypothesis is based
on a categorization of jobs as being either routine, non-routine manual, or non-
routine cognitive. According to this approach, computers are good at routine jobs.
Therefore, high-wage, routine manufacturing jobs were eventually replaced by
new technologies. This hollowed out the well-paid, routine work occupied by
many in the middle classes of advanced economies. Computers are not good,
however, at non-routine manual and non-routine cognitive jobs. Therefore, in the
wake of new technologies in the workforce, what are left are high-wage, high-skill
non-routine and low-wage, low-skill non-routine jobs. According to the argument,
computers were used in the 1980s to enhance routine jobs, not replace them. In
the 1990s, new technologies increasingly replaced routine work, pushing forward
rising wage polarization since that time. Still, despite these seemingly persuasive
explanations, this approach fails to capture the experience of advanced
economies other than the US, and to some extent the UK.
Without a doubt, technology is an important component of inequality. However, in
a vacuum it offers little explanatory power. It excludes salient underlining and
interacting causes, such as HI , local histories, other forms of social exclusion,
and government intervention to address displacements by new technologies.
52
F. Jaumotte, S. Lall, and C. Papageorgiou, "Rising Income Inequality: Technology, or Trade and
Financial Globalization?," IMF Economic Review 61, no. 2 (2013).
The Drivers of Economic Inequality 32You can also read