Working Paper No. 82 Publishing and Promotion in Economics: The Tyranny of the Top Five James J. Heckman and Sidharth Moktan#
←
→
Page content transcription
If your browser does not render page correctly, please read the page content below
Publishing and Promotion in Economics:
                       The Tyranny of the Top Five‡
                 James J. Heckman∗ and Sidharth Moktan#

                                    Working Paper No. 82
                                              March 19, 2019

                                                   ABSTRACT

This paper examines the relationship between placement of publications in Top Five (T5)
journals and receipt of tenure in academic economics departments. Analyzing the job histories of
tenure-track economists hired by the top 35 U.S. economics departments, we find that T5
publications have a powerful influence on tenure decisions and rates of transition to tenure. A
survey of the perceptions of young economists supports the formal statistical analysis. Pursuit of
T5 publications has become the obsession of the next generation of economists. However, the T5
screen is far from reliable. A substantial share of influential publications appear in non-T5
outlets. Reliance on the T5 to screen talent incentivizes careerism over creativity.

‡
  This research was supported by a grant from the Institute for New Economic Thinking to the Center for the
Economics of Human Development. An early version of this analysis was presented in a round table, “The Curse of
the Top Five,” at the AEA meetings on January 7th, 2017. Participants included the authors, George Akerlof,
Angus Deaton, Drew Fudenberg, and Lars Peter Hansen. For a video of the session, see https://www.aeaweb.org/
webcasts/2017/curse. James Heckman receives compensation for his role as Editor at the Journal of Political
Economy, which is one of the “Top Five” journals discussed in this paper. A conflict of interest management plan is
in place in accordance with University of Chicago conflict of interest policies. We thank George Akerlof, Dan
Black, Tom Ferguson, Jorge Luis Garçıa, Rob Johnson, Ganesh Karapakula, Rasmus Landersø, Meera Mody,
Magne Mogstad, Tanya Rajan, and Harald Uhlig for comments. We thank Patrick Chen and Aakash Rao for
outstanding research assistance.
∗
  James J. Heckman is the Henry Schultz Distinguished Service Professor at the University of Chicago, Director of
the Center for the Economics of Human Development at the University of Chicago, Director of the Human Capital
and Economic Opportunity Working Group sponsored by INET, and a Research Professor for the American Bar
Foundation.
#
 Sidharth Moktan is a Predoctoral Fellow at the Center for the Economics of Human Development at the University
of Chicago.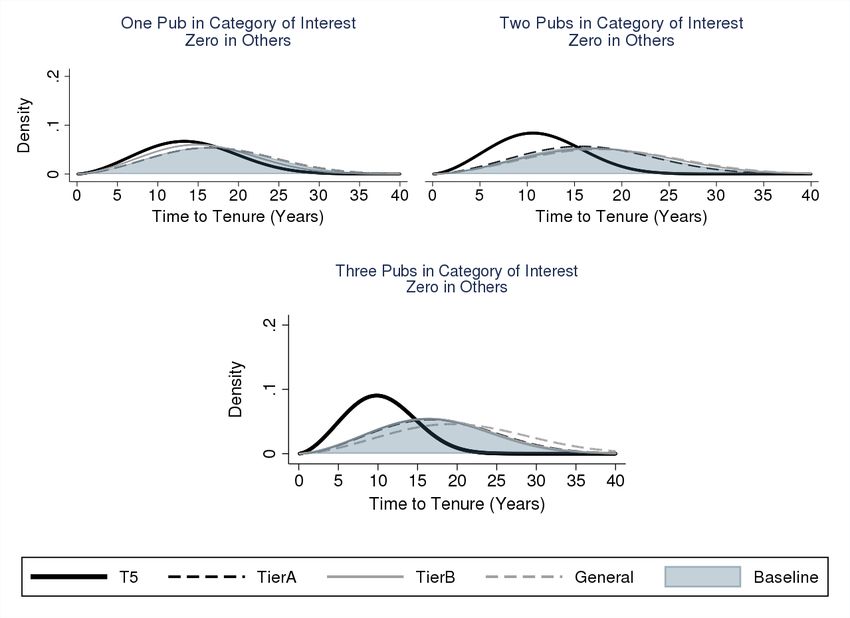
JEL Codes: A14, I23, J44, O31

Keywords: Tenure and promotion practices, career concerns, economics publishing, citations
Contents

1 Introduction                                                                                 4

2 Empirical Evidence on the Potency of the Top Five                                            9
  2.1 Data . . . . . . . . . . . . . . . . . . . . . . . . . . . . . . . . . . . . . . . .    10
      2.1.1 Categorizing the Journals . . . . . . . . . . . . . . . . . . . . . . . .         12
  2.2 Probability of Receiving Tenure . . . . . . . . . . . . . . . . . . . . . . . . .       14
      2.2.1 The Power of the T5 by Department Rank . . . . . . . . . . . . . . .              15
      2.2.2 The Power of the T5 By Quality of T5 Publications . . . . . . . . .               17
  2.3 Duration Analysis of Time-to-Tenure . . . . . . . . . . . . . . . . . . . . . .         19
      2.3.1 Pooled Estimates of Hazard Rates and Time-to-Tenure . . . . . . . .               21
      2.3.2 Estimates of Hazard Rates by Department Rank . . . . . . . . . . . .              23
  2.4 Heterogeneity in the Probability and Rate of Receiving Tenure By Gender .               24
      2.4.1 Heterogeneity in Time-to-Tenure . . . . . . . . . . . . . . . . . . . .           25
      2.4.2 Heterogeneity in the Probability of Receiving Tenure . . . . . . . . .            28
  2.5 Sensitivity of Estimates to Inclusion and Exclusion of Finance and Economet-
      rics Journals . . . . . . . . . . . . . . . . . . . . . . . . . . . . . . . . . . . .   30

3 Junior Faculty Perceptions of Current Tenure and Promotion Practices                        31
  3.1 Survey Results . . . . . . . . . . . . . . . . . . . . . . . . . . . . . . . . . .      32

4 The T5 as a Filter of Quality                                                               37
  4.1 Comparison of Citations Between T5 and Non-T5 Journals . . . . . . . . . .              37
      4.1.1 Comparisons Against the Aggregate T5 Distribution . . . . . . . . .               39
  4.2 Which Journals Publish Influential Research Papers? . . . . . . . . . . . . .           42
  4.3 The T5 are Not the Journals with the Top Five Impact Factors in Economics               46
  4.4 Where Influential Economists Publish . . . . . . . . . . . . . . . . . . . . . .        47
  4.5 The Forgotten (by the Top 5) Classics . . . . . . . . . . . . . . . . . . . . .         51

5 Openness and Incest                                                                         54
  5.1 Corruption or Inside Information? . . . . . . . . . . . . . . . . . . . . . . . .       57

6 Summary and Discussion                                                                      59
List of Figures
1 Length of First Tenure-Track Employment by Tenure Outcome . . . . . . . . 11
2 Evolution of Average Publication Portfolios by Tenure Outcome and by De-
partmental Ranks . . . . . . . . . . . . . . . . . . . . . . . . . . . . . . . . . 13
3 Predicted Probabilities for Tenure Receipt in the First Spell of Tenure-Track
Employment (Logit) . . . . . . . . . . . . . . . . . . . . . . . . . . . . . . . 15
4 Predicted Probabilities for Tenure Receipt in the First Spell of Tenure-Track
Employment, By Department Rank (Logit) . . . . . . . . . . . . . . . . . . . 16
5 Raw Probabilities for Receipt of Tenure in the First Spell of Tenure-Track Employ-
ment, by Quality of Overall Publications for Faculty Whose First Spell Ended by
2008 (Quality Proxied by Average Citations Received Through 2018 by First Spell
Publications); Sample Restricted to Faculty With 3 or More Journal Publications
by End of First Spell . . . . . . . . . . . . . . . . . . . . . . . . . . . . . . . . 18
6 Relative Hazard Rates of Tenure Receipt Associated With Publications in
Di↵erent Outlets . . . . . . . . . . . . . . . . . . . . . . . . . . . . . . . . . 21
7 Densities of time-to-tenure (Weibull Distribution) . . . . . . . . . . . . . . . 22
8 Relative Hazards of Tenure Associated With Di↵erent Levels of T5 Publica-
tions (By Department Rank) . . . . . . . . . . . . . . . . . . . . . . . . . . . 23
9 Densities of Time-to-Tenure (Weibull Distribution), by Gender (Publication
Rewards Held Constant across Genders) . . . . . . . . . . . . . . . . . . . . 25
10 Conditional Probabilities of Receiving Tenure During the First Spell of Tenure-
Track Employment Given T5 Publications and Gender . . . . . . . . . . . . 28
11 Ranking of Performance Areas Based On Their Perceived Influence On Tenure
and Promotion Decisions . . . . . . . . . . . . . . . . . . . . . . . . . . . . . 33
12 Minimum Number of T5 Publications Required for Tenure . . . . . . . . . . 34
13 Probability That Candidate with T5 Publications Receives Tenure or Promo-
tion Instead of Candidate with non-T5 Publications, ceteris paribus . . . . . 36
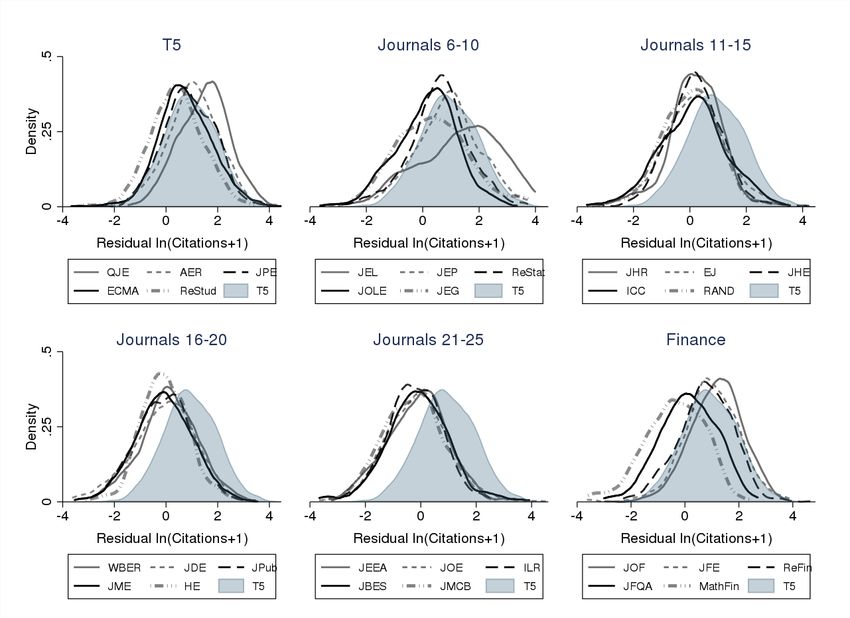
14 Distribution of Residual Log Citations for Articles Published between 2000–
2010 (Measured Through July, 2018) . . . . . . . . . . . . . . . . . . . . . . 40
15 Proportion of RePEc’s Most Cited Articles Published in Di↵erent Journals in
the Last 10 and 20 Years (Adjusted for Publication Volume) . . . . . . . . . 51
16 Density Plot for the Number of Years Served by Editors between 1996-2016 . 54
2List of Tables
1 Potential States of Employment for Untenured Tenure-Track Faculty in Period
t + 1 Relative to State in t . . . . . . . . . . . . . . . . . . . . . . . . . . . . 19
2 Publication Volume-Unadjusted Proportion of Influential Articles Published
By Individual Journals Between 2000–2010 . . . . . . . . . . . . . . . . . . . 43
3 Publication Volume-Adjusted Proportion of Influential Articles Published By
Individual Journals Between 2000–2010 . . . . . . . . . . . . . . . . . . . . . 45
4 2, 5, 10, 15, and 20 Year Impact Factors For 25 Economics Journals Con-
structed Using Citations Data From 2017, Ordered by 5 Year Impact Factor 47
5 Journals that Account For Largest Share of Field-Specific Publications Between 1996-
2017 By RePEc’s Top 50 Authors Within Di↵erent Fields (Adjusted For Publication Volume) 49
6 Journals That Received The Highest Number of Citations From Articles Published
Between 2010–2017 In the Top 2 Journals Within Di↵erent Fields of Specialization
(Rankings Uses Citations to Articles Published Between 1996-2017; Rankings are
Adjusted For Publication Volume of Cited Journal) . . . . . . . . . . . . . 50
7 20 Most Cited Non-T5 Articles in RePEc’s Ranking of Most Cited Articles . 53
8 Incest Coefficients: Publications in Top 5 between 2000-2016 by Author Af-
filiation Listed During Publication . . . . . . . . . . . . . . . . . . . . . . . . 56
31 Introduction
This paper examines how academic economics incentivizes young scholars and thereby shapes
the values and goals of the next generation of professional economists. Talking with young
economists entering academia and with their peers about their career prospects, one cannot
fail to note their obsession with publication in the Top Five journals, henceforth T5. Faculty
meetings about hiring, promotion, tenure, and prize committee discussions assess candidates
by the number of T5 articles they have published or have in the pipeline and the rapidity
with which they were generated. Research proposals are often appraised by their potential
to generate T5 publications.
The T5 journals are: The American Economic Review, Econometrica, the Journal
of Political Economy, the Quarterly Journal of Economics, and the Review of Economic
Studies. These “general interest” journals publish papers on a broad range of topics. They
are classified in the T5 based on aggregate proxies of journal influence. Assessing researchers
based on proxy measures is now common across fields. The use of Impact Factors1 is one such
example. Originally devised as an advisory system for library purchasing decisions, it has
now morphed into an assessment system widely used in many fields.2 Proxies of aggregate
journal performance such as the Impact Factor do not assess the creativity or value of any
individual paper, but only assess the scale of subscribership of the publication in which a
paper appears and the company it keeps.
Publication in the T5 journals has become a professional standard. Its pursuit shapes
research agendas. For many young economists, if a paper on any topic cannot be published
in a T5 outlet, the topic is not worth pursuing. Papers published in non-T5 journals are
commonly assumed to have descended into their “mediocre” resting places through a process
of trial and failure at the T5s and are discounted accordingly. This mentality is not confined
1
Impact Factors are assessed by Web of Knowledge, a scientific citation indexing service produced by
the Institute for Scientific Information that advises library acquisitions.
2
See Bertuzzi and Drubin (2013)
4to the young. Habits formed early are hard to break. Pursuit of the T5 has become a way of
life for experienced economists as well. Falling out of the T5 is a sign of professional decline.
Decisions about promotions, recognitions, and even salaries3 are tied to publication counts
in the T5. Relying on the T5 to assess productivity rewards pursuit of publication counts in
the “proper” places and not the development of coherent bodies of research.
To a certain degree there is a strong case for relying on the T5 signal. The profession
has grown in size and has become more specialized. There is a demand for certification of
quality which publication in the T5 is used to meet. Publication in a highly-rated general
interest journal is now considered a proxy for the likelihood that a candidate publishes highly
cited general interest papers. In this paper, we demonstrate that readership and citation of
a paper and aggregate citations to a journal in which the paper appears are far from the
same thing.
The T5 standard has become increasingly difficult to attain. Card and DellaVigna
(2013) document that the amount of space available in T5s has remained roughly constant
during the period 1990–2012.4 At the same time, the number of submissions to the T5 and
the length of submitted papers have greatly increased5 with concomitant growth in rejection
rates and delays in the refereeing process.6 Editors now tend to use more referees than in
the past. The acceptance rates at T5 journals declined from 15% in 1980 to 6% in 2012.7
Economists with established reputations and in highly ranked departments are in-
creasingly not publishing in T5 or field journals8 and are increasingly posting papers online
in influential working paper series, which are highly cited, but not counted as T5s. This
practice likely dilutes the quality of the T5 signal.
The declining acceptance rate and the reliance on the reports of multiple referees (and
3
See Table 7 of Gibson et al. (2014). Economics faculty in the University of California system face
salary penalties for not publishing in the T5.
4
See Online Appendix Figure O-A31 for a summary of Card and DellaVigna (2013)’s data.
5
Card and DellaVigna (2013)
6
Ellison (2002)
7
Card and DellaVigna (2013).
8
Ellison (2011)
5concomitant scrutiny and delay) might suggest a rise in the quality of the T5 filter. But it
also raises some potentially worrisome issues, which we address in this paper.
We examine the influence of T5 publication on promotion and tenure decisions in
academic economics. We analyze data on tenure-track faculty hired by the top 35 economics
departments in the U.S. between the years 1996-2010. The top 35 is assessed based on an
average of the US News rankings assigned to economics departments during the years 2008,
2010, and 2015. The chosen period gives sufficient time to assess the early impacts of papers
and yet is recent enough to describe the current professional environment.
We assess the degree to which tenure decisions are influenced by publication in the
T5. We estimate the probability of receiving tenure in the first spell of employment and by
the seventh year of tenure-track employment. We supplement this analysis with estimates
from duration analyses that show that publishing three T5 articles is associated with a
310% increase in the rate of receiving tenure, compared to candidates with similar levels of
publications who do not place any in the T5. Candidates with one or two T5 articles are
estimated to experience increases in the rate of receiving tenure of 80% and 230% respectively,
compared to those with the same number of non-T5 publications. The estimated e↵ects
of publication in non-T5 journals pale in comparison. For the same number of citation
counts measured ten or more years after tenure, publication in the Top 5 remains a strong
determinant of tenure probabilities and transition rates to tenure.
We explore heterogeneity in the tenure-generating power of the T5 with respect to
department quality. Requirements for T5 publication decline with department quality and
the impact on tenure of T5 publication increases with declines in department quality as mea-
sured by faculty publications. Publishing in the T5 is the most e↵ective means of improving
one’s chances of obtaining tenure in all of the top 35 U.S. economics departments.
There are di↵erences in rates of tenure by gender, although they are not precisely
determined due to our small sample size for women. For men, two T5s is more than enough
to get a 50% or higher probability of attaining tenure in the first spell. It takes three for a
6woman, but this is only a point estimate and its standard error is big.
After documenting the potency of publishing in the T5, we examine the validity of
this filter using citation counts as a measure of validity. While T5 articles are highly cited,
so are articles published in non-T5 journals. Many non-T5 articles are better cited than
many articles in T5 journals.9 Numerous influential papers are published outside of the T5.
Indeed, many of the most important papers published in the past 50 years have been too
innovative to survive the T5 gauntlet.10 Many of the 20 most cited RePEc papers were not
published in the T5.11
In principle, insisting that scholars publish in general interest journals works against
the growing trend in academic economics toward specialization and Balkanization. However,
it flies in the face of current scholarly practice. Leading scholars in most fields largely publish
in non-T5 field journals. In addition, non-T5 journals generally dominate T5 journals in
terms of citations in the top journals within most subfields of economics. The T5 journals
typically rely on field specialists to review papers submitted in their fields. Scholars who
themselves primarily publish in, read, and cite papers from non-T5 field journals appraise
the quality of prospective candidates for promotion and hiring using their T5 publications.
The tenure of editors is long, especially at house journals whose editors are mostly, if
not exclusively, affiliated with a single department. Low turnover in editorial boards creates
the possibility of clientele e↵ects surrounding both journals and editors, whereby authors,
in an e↵ort to increase their chances of publication, choose to conduct research that caters
to the policy and/or methodology preferences of editors. Given the large rewards associated
with publishing in the T5, and the consequences of failing to do so, it is not implausible that
9
See, e.g., Hamermesh (2018), who makes this point. We build on and extend his analysis.
10
Akerlof (2018) suggests that the T5 journals often endorse “safe research” that extends the boundaries
of a field slightly, but does not advance it by much. This is likely a consequence of the peer review process,
which engenders an inherent conservatism. See also the discussion in the AEA symposium linked here:
https://www.aeaweb.org/webcasts/2017/curse.
11
RePEc (www.RePEc.org) stands for Research Papers in Economics and is a major source for rankings
of citations in the profession. According to the RePEc website: “...over 2,000 archives from 99 countries
have contributed about 2.6 million research pieces from 3,000 journals and 4,600 working paper series. Over
50,000 authors have registered and 75,000 email subscriptions are served every week.”
7such clientele e↵ects are both prevalent and large in magnitude.
It is well-documented that journals in economics tend to publish work by authors
who are connected with the journal’s editors (see Brogaard et al., 2014, Laband and Piette,
1994, and Colussi, 2018). We corroborate this literature by estimating incest coefficients
that quantify the degree of inbreeding in publications in the T5. Editors are likely to select
the papers of those they know. Network e↵ects are empirically important.12
Whether this practice capitalizes on the benefits of using inside information that
improves journal quality as measured by citations or whether it is unproductive cronyism is
much-discussed.13 The evidence on this issue is not conclusive, but it appears to favor the
story of net benefits to insider knowledge. Although evidence on the source of the observed
network e↵ects is inconclusive, the mere existence of such network e↵ects gives cause for
concern. The T5’s tendency to publish work written by authors who are connected to the
editorial board has the possibly unintended but real e↵ect of penalizing authors who lack
such connections. Unconnected authors are thus worse-o↵ due to network e↵ects that are
biased against them, regardless of whether such network e↵ects stem from favoritism or
insider knowledge. However, this paper does not address in depth the larger question of the
value of using citation counts to judge productivity and the self-referential nature of groups
within economics who referee and cite each other’s papers and tend to exclude outsiders.14
Given the many adverse consequences associated with the current reliance on the T5,
we believe the discipline should reevaluate its current strong weighting of T5 publications
as a measure of research achievement and as a filter for tenure and promotion decisions.
The case for change is bolstered by the inadequacy of the T5 in predicting the quality of an
article.
12
Colussi (2018) is a recent study.
13
Laband and Piette (1994) find that articles with author-editor connections are indeed more likely to
be published, however, these articles also tend to attract higher citations on average. Brogaard et al. (2014)
estimate that authors publish 100% more papers in a journal when the journal is edited by a colleague,
compared to periods when such department-editor networks do not exist. They also find that connected
articles generate 5% – 25% more citations than unconnected articles on average.
14
See Kapeller et al. (2017)
8The rest of this paper proceeds as follows. Section 2 documents the power of the T5
in determining tenure and the time-to-tenure. Section 3 reports responses to a survey of
junior faculty about their perceptions of current tenure and promotion practices. They are
consistent with the evidence from our empirical analysis. Section 4 examines the quality of
the T5 filter as measured by citations to papers published there. Section 5 presents evidence
on editorial tenure length in house journals and on incest.
The paper concludes with a summary. We discuss what – if anything – should be
done about the practice of relying on T5 publications. We use an online appendix15 to
present background information and to report sensitivity analyses. We attach a within-text-
Appendix to explain certain points of methodology.
We note at the outset what this paper does not do. It does not o↵er an empirical
assessment of whether current incentives in economics lead to meritocratic outcomes in
academic economics. To do so would require an accurate measure of academic productivity
and research quality that do not yet exist. We rely on citation counts as a crude proxy
for productivity and quality, noting that the measure is flawed but conventional. We also
do not prove that the incentives we measure lead young economists to focus on pursuing
those incentives. We document certain strong incentives built into the current tenure and
promotion system and presume that junior academics respond to them just as agents would
respond to incentives in the models we teach and in the data we study.
2 Empirical Evidence on the Potency of the Top Five
This section presents an extensive analysis of the basis for incentives facing young economists.
Publication in T5 journals is the path to success. We note at the outset that finance has
emerged as a major field that abuts economics and has many influential scholars. In our
main analyses we pool papers in finance along with those in other fields of economics. Online
Appendix Section 5 conducts a parallel analysis excluding papers in finance. Our point
15
See http://heckman.uchicago.edu/publishing-and-promotion/appendix.pdf
9estimates are barely a↵ected. Under either treatment of data, we document that publication
in the T5 is an important predictor of professional success.
2.1 Data
We investigate the relationship between tenure decisions and T5 publications using panel
data on the job and publication histories of tenure-track faculty hired by the top 35 U.S.
economics departments between the years 1996 and 2010. Panel data are constructed in four
steps.16 Online Appendix Section 1 describes details on how we construct our data.
Tenure rates by the end of the first spell vary between 26% and 31% across the
department groupings, and do not exhibit systematic di↵erences with respect to department
ranking.17 Not surprisingly, a substantial percentage of junior faculty move downwards.18
The incidence of lateral movement is highest among the top five departments with a rate of
21%. It is lowest for departments ranked 26 to 35 with a rate of 6%. Conversely, upward
movement and exits to industry are more common among lower ranked departments, and
become less frequent for higher-ranked departments.19 Tenure rates are considerably higher
at the end of the second spell across all department rank groupings, with tenure rates ranging
from 34% to 54%.20,21
16
The four steps are: (i) construction of a roster of tenure-track faculty hired by the top 35 depart-
ments between 1996 and 2010 using publicly available historical snapshots of departmental websites archived
by WayBackMachine; (ii) construction of work histories for tenure-track faculty using CVs and other public
sources of work-history data; (iii) construction of tenure decisions based on multiple sources of publicly avail-
able information including official announcements of tenure conferral; and (iv) construction of publication
and citation profiles using data from Scopus.com.
17
See Online Appendix Table O-A4
18
The top 5 departments exhibit the largest di↵erence between the percentage of downward movers and
the percentage of tenure recipients. This discrepancy in relative di↵erences arises partly because faculty at the
top 5 departments are unable to move upwards by definition, thereby restricting their outcome destinations
to 4 options instead of 5.
19
Rates of upward and lateral movement combined are similar across all rank groups.
20
See Online Appendix Table O-A6 for tenure rates during the second spell.
21
Online Appendix Table O-A7 gives estimates for rates of tenure conferral for the top 35 departments.
10Figure 1: Length of First Tenure-Track Employment by Tenure Outcome
Figure 1 plots department rank-specific distributions for the length of first tenure-
track employment for individuals who received tenure or moved to other opportunities fol-
lowing the first spell of tenure-track employment. The distributions for tenure recipients have
means between 5.4 and 7.0 years and standard deviations between 2.0 and 3.0 years.22,23 The
distributions for upward and lateral departmental movements are left-shifted relative to the
tenured distributions. In comparison, the distributions for downward movement and exits
to industry are more similar to the tenured distributions. These di↵erences suggest that
downward movements and movements to industry are more likely to result from denial of
tenure, compared to upward and lateral movements which tend to occur considerably earlier
than receipt of tenure. We discuss di↵erences by gender in Section 2.4.
22
See Online Appendix Table O-A5 for means and standard deviations corresponding to each group
23
The right tails for the tenured distributions extend beyond 10 years. The presence of such outliers
is consistent with what one would expect given the adoption of tenure clock extension policies that allow
faculty to extend the length of tenure clocks in the event of pregnancies, adoptions, and other permissible
circumstances.
112.1.1 Categorizing the Journals
To compare the relationships between tenure decisions and publications in T5 and non-T5
journals, we categorize non-T5 journals into “quality” categories. Such categorization allows
us to estimate the influence on tenure of publishing in non-T5 journals of similar standing.
We use the field-specific rankings of Combes and Linnemer (2010) to categorize journals
into the following groups: Tier A Field, Tier B Field, and non-T5 general interest.24 Online
Appendix Table O-A9 presents the journals in these categories.
A summary of the publications data follows. Figure 2 di↵erentiates faculty in the top
15 departments by tenure decision, and plots mean publication counts in the four journal
categories over the first eight years of academic experience.25 The plots reveal a striking
pattern. In terms of research productivity in peer-reviewed journals, tenured faculty at
the top 5 departments di↵erentiate themselves from their tenure-denied colleagues primarily
based on T5 publications. The evolution of T5 publications exhibits considerable separation
between tenured and tenure-denied faculty, with the average publication count reaching
a di↵erence of almost 3 publications by the 8th year of academic experience. The stark
di↵erence in separation between the T5 and non-T5 journals strongly suggests that top
departments place a disproportionately large emphasis on T5 publications.
The degree of T5 di↵erentiation falls among departments ranked 6 to 15. This de-
crease in T5 separation is accompanied by an increase in separation for Tier A Field journals,
with di↵erences in average publication counts in Tier A journals as of the 8th year increas-
ing from 0.4 for the top 5 departments to 0.6 for departments ranked 6 to 15. Despite
these changes, the T5 continues to serve as the main di↵erentiator between tenured and
tenure-denied faculty among departments ranked 6 to 15. The relative importance of Tier A
journals continues to increase as we consider lower ranked departments, with the separation
24
Tier A Field consists of the two highest-ranked journals in the fields of development, econometrics,
finance, microeconomics/game theory, health economics, industrial organization, labor economics, macroe-
conomics and public economics. Tier B Field is composed of journals ranked three to five in the same fields.
The non-T5 general interest category includes the five highest ranked non-T5 general interest journals.
25
See Online Appendix Figure O-A1 for plots corresponding to departments ranked 16–35.
12Figure 2: Evolution of Average Publication Portfolios by Tenure Outcome and by Depart-
mental Ranks
Depts. Ranked 1−5
T5 TierA TierB Non−T5 General
∆8=2.7 ∆8=0.4 ∆8=0.2 ∆8=0.5
6
Avg. Cum. Pubs
4
2
0
0 2 4 6 8 0 2 4 6 8 0 2 4 6 8 0 2 4 6 8
Academic Exp. (Yrs.) Academic Exp. (Yrs.) Academic Exp. (Yrs.) Academic Exp. (Yrs.)
Depts. Ranked 6−15
T5 TierA TierB Non−T5 General
∆8=1.4 ∆8=0.6 ∆8=0.1 ∆8=0.4
6
Avg. Cum. Pubs
4
2
0
0 2 4 6 8 0 2 4 6 8 0 2 4 6 8 0 2 4 6 8
Academic Exp. (Yrs.) Academic Exp. (Yrs.) Academic Exp. (Yrs.) Academic Exp. (Yrs.)
Tenured Untenured
Note: This figure plots the evolution of average publications in four di↵erent journal categories by tenure outcome. The
plotted means are calculated over tenure-track faculty hired by departments belonging to the referenced department
rank-group. 8 denotes di↵erences in average cumulative publications as of year 8 between the tenured and untenured groups.
for Tier A journals surpassing the separation for T5 journals among departments ranked 16
to 25.
The observed pattern of publication behavior suggests that the number of T5 pub-
lications required for tenure decreases with department ranking. Non-T5 publications are
valued more at lower ranked schools. Faculty at lower ranked departments can publish more
non-T5 articles to compensate for their lower T5 publications. This evidence of heterogene-
ity suggests that it might be informative to conduct a deeper examination of department
rank-based heterogeneity in the relationship between tenure decisions and publications. In
our formal analysis, we use econometric models that allow for such heterogeneity.
132.2 Probability of Receiving Tenure
We discuss the relationship between tenure and publication in journals of di↵erent qual-
ity tiers. Figure 3 plots average predicted probabilities of tenure associated with di↵erent
numbers of publications in the four journal categories estimated using a logit model.26,27
Controlling for the total number of publications in all specifications, we isolate a composi-
tion e↵ect from a scale e↵ect. We control for gender, number of co-authors, and the quality
of the graduate school attended. Lastly, we control for the quality of authors’ publication
portfolios by including a vector of statistics that summarize the distribution of field-adjusted
citations received by each author’s portfolio of publications.28,29
Figure 3 shows that publishing in T5 journals is associated with the largest increases
in probabilities of receiving tenure. An individual with a single T5 publication is predicted to
have a 0.3 probability of receiving tenure. The predicted probability increases to 0.43 and 0.62
for individuals with two and three T5 publications respectively. Although publishing in non-
T5 outlets is associated with non-zero probabilities of receiving tenure that are statistically
significant at the 5% level, the predicted probabilities associated with these publications are
considerably lower than those associated with T5 publications. Among the non-T5 estimates,
the largest probability of receiving tenure is 0.25 and it is associated with publishing two
articles in Tier A journals. This probability is lower than the probability of 0.3 associated
with publishing a single T5 article. The probability of 0.62 associated with three or more
26
See Text-Appendix Section 1.1 for the exact specification used in our Logit estimations.
27
The corresponding marginal e↵ects are presented under the “Pooled” columns of the Online Appendix
Table O-A13. Online Appendix Table O-A10 presents comparable estimates of partial e↵ects obtained from
our Linear Probability Model (LPM) estimation. Results are qualitatively the same. The T5 remains the
most influential category by far.
28
Relevance of an article varies by analysis. The current estimates of tenure by the first spell utilize
citations for all articles published during the first spell. Estimates for tenure by the 7th year utilize citations
to articles published by the 7th year of tenure-track experience.
29
The vector of citation controls includes the following statistics that summarize the distribution of
field-adjusted citations received by each author’s portfolio of publications: 25th percentile, median, 75th
percentile, minimum, maximum, and mean field-adjusted citations. Our adjustment follows a citation-
rescaling procedure similar to the one introduced by Radicchi et al. (2008) and discussed by Perry and Reny
(2016). Specifically, it rescales citations received by each article i with the mean number of citations received
by all articles in i’s field published during i’s year of publication. See Online Appendix Section 2 for detailed
documentation of the procedure undertaken to adjust citations by field and year.
14Figure 3: Predicted Probabilities for Tenure Receipt in the First Spell of Tenure-Track
Employment (Logit)
Note: This figure plots the predicted probabilities associated with di↵erent levels of publications in di↵erent journal
categories. The predicted probability is defined in Equation TA-2 (Equation TA-2 uses parameter estimates from Equation
TA-1). White diamonds on the bars indicate that the prediction is significantly di↵erent than zero at the 5% level.
T5 publications is approximately 150% greater than this largest non-T5 estimate. The
pattern of large di↵erences between the probability-of-tenure associated with T5 and non-
T5 publications persists when we investigate the relationship between publications and the
probability of receiving tenure by the 7th year of tenure-track employment.30
2.2.1 The Power of the T5 by Department Rank
Figure 4 plots department rank-specific predicted probabilities for receipt of tenure during
the first spell of tenure-track experience associated with di↵erent levels of T5 publications.31
30
See Online Appendix Section 3.3 for results and details on specification used.
31
The corresponding marginal e↵ects are presented under the department rank-specific columns of Online
Appendix Table O-A13.
15The length of the first spell varies by individual.32 Predictions for each rank group is obtained
by estimating logit models for subsamples of faculty who had their first spell of tenure-track
experience at a department within the rank group in question. For all empirical models
estimated in this paper we include departmental fixed e↵ects and adjust standard errors for
clustering at the department level.
Figure 4: Predicted Probabilities for Tenure Receipt in the First Spell of Tenure-Track
Employment, By Department Rank (Logit)
Note: This figure plots the predicted probabilities associated with di↵erent levels of publications in di↵erent journal
categories. The predicted probability is defined in Equation TA-2 (Equation TA-2 uses parameter estimates from Equation
TA-1). Department rank-specific estimates are obtained by restrictively estimating Equation TA-1 over subsamples of faculty
belonging to the department rank group in question. White diamonds on the bars indicate that the prediction is significantly
di↵erent than zero at the 5% level.
The figure reveals heterogeneity in the associated impact of each T5 publication in the
probability of receiving tenure. Faculty at lower ranked departments face higher probabilities
of tenure receipt with the same number of T5 publications. An individual with one T5
publication is predicted to face a probability of tenure of 0.2 in a top 10 department, but
the same individual experiences probabilities of 0.29 and 0.39 at departments ranked 11–20
and 21–35 respectively. Faculty with two and three T5 publications at departments ranked
32
We also estimate models that fix duration to 7 years of tenure-track experience. Pooled estimates are
presented in Online Appendix Figure O-A7. The results of that analysis are qualitatively similar to the
analysis in the main text. Department rank-specific estimates for tenure by the 7th year are presented in
Online Appendix Figures O-A8–O-A10.
1611–20 are similarly predicted to experience higher probabilities of tenure than individuals in
top 10 departments who have published the same number of T5 articles.33
34
2.2.2 The Power of the T5 By Quality of T5 Publications
This section investigates the staying power of the T5. Results from the previous sections
show that T5 publications have a powerful impact on tenure decisions, after controlling
for di↵erences in the quality of publication portfolios as proxied by citation performance of
published articles. These findings suggest that the T5 influence operates through channels
that are independent of publication quality. Figure 5 presents evidence in support of this
hypothesis. The figure bins faculty into four quartiles based on average citations accrued
through 2018 by all journal articles published by authors during the first spell of tenure-track
employment. Bins are designated in the natural order of citation quality from lowest (bin 1)
to highest (bin 4). Probabilities of tenure associated with di↵erent levels of T5 publications
are presented within each quartile.35 To investigate the staying power of T5 publications
conditional on article quality, we require all publications to accrue citations over a minimum
of ten years.36 The analysis in this section does not adjust for departmental fixed e↵ects and
di↵erences in the tenure process by department rank due to sample size issues. We lose a
large number of observations due to restriction of the sample to individuals who completed
their first spells by 2008.
Tenure probabilities generally increase with number of T5 publications across all quar-
33
While di↵erences are evident, one cannot reject the null of equalities of the probabilities across depart-
ment rank groups. See Online Appendix Table O-A14.
34
The analysis of this section was motivated by the comments of Dan Black and Harold Uhlig.
35
The probabilities are constructed in three steps: (i) the sample is restricted to only include faculty
with 3 or more journal publications by the end of the first spell (3 is the mean number of journal publications
during the first spell); (ii) each individual is binned into one of four performance quartiles based on average
citations accrued through 2018 by all journal articles published by the individual during the first spell; and
(iii) conditional probabilities of tenure receipt (given T5 publications) are estimated within each performance
quartile by taking the proportion of individuals who received tenure given publication of zero to three T5
articles during the first spell
36
This requirement is satisfied by restricting the estimation sample to only include individuals who
completed their first spells of tenure track employment by 2008. Thus, all pre-tenure decision publications
in the estimation sample must have been published in or before 2008.
17Figure 5: Raw Probabilities for Receipt of Tenure in the First Spell of Tenure-Track Employment,
by Quality of Overall Publications for Faculty Whose First Spell Ended by 2008 (Quality Proxied
by Average Citations Received Through 2018 by First Spell Publications); Sample Restricted to
Faculty With 3 or More Journal Publications by End of First Spell
Note: This figure plots estimates of tenure probabilities (by the first spell) for individuals with di↵erent numbers of T5
publications by the quality of authors’ publications as proxied by citations measures through 2018. Faculty are grouped into
four quartiles based on average citations accrued through 2018 by all publications during the first spell. The figure plots
quartile-specific probabilities of tenure associated with each level of T5 publication. For each quartile, probabilities are
estimated as the proportion of individuals with a given level of T5 publication who received tenure during the first spell. The
estimation sample is restricted to only include individuals who published three or more journal articles during the first spell.
Confidence intervals are not plotted for probability estimates that equal one since tenure was received by every individual
within the group in question.
tiles of author publication quality. Inter-quartile comparison of tenure probabilities reveals
the extent of the T5 influence. It is more valuable to have a mediocre publication portfo-
lio with T5 publications than an outstanding portfolio without any T5s. Individuals with
top quartile T5-less publication portfolios composed of three or more non-T5 publications
are estimated to face similar or lower probabilities of tenure receipt than individuals with
bottom quartile publication portfolios consisting of one T5 article and two or more non-T5
articles. Faculty with bottom quartile portfolios composed of two or three T5 publications
have vastly greater tenure probabilities than faculty with top quartile portfolios that lack T5
18publications. This quality-invariant influence of T5 publications persists when we restrict
the sample to include faculty who published at least 4 or 5 journal articles during their first
job spell (see Online Appendix Figures O-A16–O-A17).
The results presented in this section support the hypothesis that the T5 influence
operates through channels that are independent of article quality. This finding is corrobo-
rated by responses to our survey of current tenure-track faculty at the top 50 U.S. economics
departments. Junior faculty believe that there is at least a 0.89 probability that tenure
committees will choose to tenure a candidate who possesses T5 publications over an identi-
cal candidate who possesses an identical number of non-T5 publications of the same quality.
The existence of such a strong quality-independent influence of T5 publications suggests that
tenure and promotion committees rely overwhelmingly on journal-level indicators of quality
(T5 vs. non-T5) to predict the quality of individual articles. Such reliance on the T5 label is
particularly problematic given the large intra-journal heterogeneity and inter-journal overlap
in quality documented in Section 4 for articles published in T5 and non-T5 journals. The
discussion in this section highlights the folly in relying on journal-level indicators of qual-
ity to predict individual article quality–it simultaneously generates errors in actual decision
making and leads junior faculty to (correctly) believe that the T5 has a quality-independent
e↵ect on tenure decisions. The formation of such beliefs is likely to influence the direction
of research for faculty who seek tenure and career advancement.
2.3 Duration Analysis of Time-to-Tenure
Table 1: Potential States of Employment for Untenured
Tenure-Track Faculty in Period t + 1 Relative to State in t
state = s Description
0 Untenured tenure-track in the same T35 department as period t
1 Tenured in the same T35 department as period t
2 Untenured tenure-track in a di↵erent T35 department than period t
3 Not employed as a tenure-track faculty in a T35 department
19This section expands on our analysis of the tenure–publication relationship by inves-
tigating the association between time-to-tenure and time-varying measures of publications
in the four journal categories. We use a standard competing risks duration framework for
the states given in Table 1. This section presents the multi-spell hazard specification used in
this paper to estimate the duration relationships between tenure and T5 publications. The
reader is referred to Text-Appendix Section 2 for a more detailed discussion of the model.
Consider a multi-spell model where each individual enters the post-PhD academic job
market as an untenured assistant professor at one of the top 35 departments. The probability
that an individual is employed in an untenured tenure-track position during the first period
of any lth spell of untenured tenure-track employment is 1. In subsequent periods, individuals
can either remain untenured in the lth spell of tenure-track employment (s = 0), begin a
new spell l + 1 of untenured tenure-track employment in another T35 department (s = 2),
or exit the sample by either receiving tenure within the department (s = 1) or by ceasing to
be employed as a tenure-track faculty in a top 35 department (s = 3).37
Assuming that Weibull hazards generate survival times,38 the hazard rate that an
untenured tenure-track faculty in the lth spell of employment transitions from state s = 0 to
a new state k 2 {1, 2, 3} in time period t is parametrized by:
( 3
! )
X X j,n
hl0,k (t) = exp ↵0,k · (j(t) n) +X 0,k + C⌘0,k + 0,k (l
l
1) + V0,k t 1,0,k
(1)
j2J n=1
where hl0,k (t) is the hazard rate of transitioning from state 0 to k in period-t of spell-l;
(j(t) n) is an indicator for having n or more publications in journals of type j 2 J as
of time period t; J = {T 5, General, T ierA, T ierB}; X is a vector that includes fixed e↵ects
for authors’ academic department as well as measures of observable characteristics including
co-author characteristics, gender, quality of authors’ PhD granting institution, years since
37
Individuals cease to be employed as tenure-track faculty if they exit to a department below the top 35,
move to an industry position, or transition to a non-tenure-track position in a top 35 department.
38
see Text-Appendix Section 2 for a more detailed discussion of our duration model. The Text-Appendix
presents the Weibull model as a special case of a duration model that employs a Box-Cox transformation.
20graduation, and a control for total volume of publications ln(#Total Publications+1); C is
a vector of statistics that summarizes the distribution of field-adjusted citations received by
each author39 ; 1,0,k is the Weibull duration parameter; 0,k captures potential dependence
between survival times and the number of spells that an individual has experienced prior to
l
the current spell; and V0,k = C0,k V is a one-factor spell-specific specification for individual-
level unobserved heterogeneity.
The model imposes restrictions on the parameters associated with observed author
characteristics and department fixed e↵ects, forcing the parameters to be equal across
j,n
spells. We further restrict the parameters on the publication variables ↵0,k to be constant
across spells. This restriction is equivalent to assuming that tenure committees maintain the
same publication standards for all untenured faculty regardless of the spell of employment.
2.3.1 Pooled Estimates of Hazard Rates and Time-to-Tenure
Figure 6: Relative Hazard Rates of Tenure Receipt Associated With Publications in Di↵erent
Outlets
Note: This figure plots hazard ratios associated with di↵erent levels of publications in di↵erent outlets. Hazard ratios are
obtained by estimating Text-Appendix Equation TA-13. White diamonds on the bars indicate that the prediction is
statistically significantly di↵erent than 1 at the 5% level.
39
see Footnote 29 for details
21Figure 6 presents the increase in tenure hazards (rates of transition to tenure) associated
with publishing di↵erent numbers of articles in the four journal categories. Estimates for
individual parameters are presented in Online Appendix Table O-A17. The estimates show
that the transition rates to tenure associated with individuals who publish two and three
T5 publications are 3.3 and 4.1 times the transition rates associated with those who have
never published in the T5. In comparison, the transition rates associated with those who
have published three Tier A or Tier B publications is no higher than 1.1 times the hazards
associated with individuals who have never published in these outlets. None of the estimates
for the non-T5 hazard ratios are statistically significant at the 5% level.
Figure 7: Densities of time-to-tenure (Weibull Distribution)
Note: This figure plots distributions of time-to-tenure associated with di↵erent levels of publications in four di↵erent types of
journals. Densities of time-to-tenure are derived from estimation of Equation TA-13. The blue shaded region in each plot
represents the distribution of time-to-tenure associated with not having any publications in any journal.40
The di↵erences in hazard rates translate into di↵erences in the time required to attain
tenure. Figure 7 plots predicted densities of time-to-tenure associated with publishing dif-
ferent numbers of articles in the four journal categories.41 Publishing in the T5 is associated
41
Each panel plots a baseline density associated with having no publications in any of the four journal
22with large decreases in the expected time-to-tenure as indicated by the large leftward shift in
the T5-specific density of predicted time-to-tenure. In comparison, publications in non-T5
journals are associated with negligible deviations from the baseline distribution.
2.3.2 Estimates of Hazard Rates by Department Rank
Figure 8: Relative Hazards of Tenure Associated With Di↵erent Levels of T5 Publications
(By Department Rank)
Note: This figure plots department quality-specific hazard rates of tenure associated with di↵er-
ent levels of publications in the T5. The department quality-specific hazard rates are estimated
by interacting the publication parameters in Equation TA-13 with time-specific indicators for
whether an author is hired by a department that belongs to each of the three department-quality
groupings.
This section presents hazard estimates corresponding to three rank-based groupings
of deparments: Top 10, Top 11–20, Top 21–35. To estimate rank-specific hazard ratios,
we interact the publication variables in Equation 1 with indicators for being employed by
a department in one of the three rank-based groups during period t.42 The estimates are
categories. Journal category-specific densities are overlaid on this baseline density to highlight the deviation
in time-to-tenure associated with publishing in the di↵erent categories. The first subfigure plots the densities
associated with publishing one article in the journal category of interest, and none in the other three. The
remaining two subfigures analogously plot densities associated with publishing two and three articles in the
journal category of interest while holding the number of publications in the other three categories at zero.
42
See Text-Appendix Section 2.3 for details.
23heterogenous across the di↵erent department rank groupings. The first T5 publication is
estimated to have a significant impact on the hazard of tenure for only those individuals em-
ployed by departments ranked 21–35. Further, the magnitude of impact associated with the
first T5 publication is higher for these departments compared to higher ranked departments.
Conversely, the estimates associated with two or three T5 publications is only significant for
the top 20 departments, and the magnitude of impact associated with these publications is
higher for individuals hired by the top 10 departments compared to individuals in depart-
ments ranked 11–20. Online Appendix Section 4.2 presents analogous rank-specific estimates
for the non-T5 journal categories. T5 publications are estimated to have a larger impact on
the hazard of tenure relative to non-T5 publications, across all department rank groupings.
2.4 Heterogeneity in the Probability and Rate of Receiving Tenure
By Gender
We next investigate gender di↵erences in time-to-tenure and in the probability of receiving
tenure. Duration analyses in Section 2.4.1 reveal that male faculty enjoy shorter times-
to-tenure than their female colleagues. We investigate the source of this discrepancy by
checking whether di↵erences in time-to-tenure stem from di↵erential returns to publication
by gender. Our analysis shows that T5 publications are indeed associated with greater
reductions in time-to-tenure for male faculty. We are careful not to interpret these estimates
as evidence of discrimination since we lack the data required to control for the confounding
e↵ect of fertility on female time-to-tenure. While gender di↵erences exist for time-to-tenure,
di↵erences by gender are not present in our analyses of the probability of receiving tenure
(both during the first spell and by the 7th year of tenure-track employment) in Section 2.4.2.
Our results thus suggest that female faculty take longer to receive tenure but are not less
likely to eventually receive tenure.
242.4.1 Heterogeneity in Time-to-Tenure
Figure 9: Densities of Time-to-Tenure (Weibull Distribution), by Gender (Publication Re-
wards Held Constant across Genders)
Note: This figure plots conditional densities of time-to-tenure given di↵erent levels of publications in the
T5 journals and gender. Densities of time-to-tenure are predicted using parameter estimates obtained by
estimating Text-Appendix Equation TA-13 without interacting the publication parameters with gender.
Conditional densities of time-to-tenure given gender g, x number of T5s, and 0 non-T5s is given by:
f (t | #T5 = x, #nonT5 = 0, Gender = g, X) = h(t | #T5 = x, #nonT5 = 0, Gender = g, X) ⇥ S(t | #T5 =
x, #nonT5 = 0, Gender = g, X) where h(t | ·) and S(t | ·) give the conditional hazard and survivor rates at
t respectively. The titles for the 3 subplots in Figure 9 lists the conditioning used for the publication
variables. “2 Pubs in T5; 0 in Others” gives the condition: #T5 = 2, #nonT5 = 0. The conditioning on
gender is given by the legend which denotes whether the plot is associated with males or females. The
conditioning on X is left implicit. Taken together, the black density for the plot labelled “2 Pubs in T5; 0
in Others” plots the following density function: f (t | #T5 = 2, #nonT5 = 0, Gender = M ale, X). Plots for
females and other quantity of T5s are analogously defined. The blue shaded region in each plot represents
the conditional density of time-to-tenure for females given zero publications in all outlets journal. Each plot
also presents p-values obtained from Kolmogorov-Smirnov tests between the Male and Female distributions.
This section investigates heterogeneity in time-to-tenure and tenure rates by gender.
Estimation of the baseline hazard yields an estimated hazard ratio for the gender indica-
tor (denoting that the subject is male) that ranges between 1.43 and 1.44 depending on
the assumption made about unobserved heterogeneity (see Online Appendix Table O-A17).
25The ratio of 1.44 for men indicates that male faculty have a rate of time-to-tenure that is
44% greater than those faced by their female colleagues, once di↵erences in the number of
publications and the vector of time-variant and -invariant controls X and C are accounted
for. Analyzing data for an older sample of individuals who were employed as economists in
1989, Kahn (1993) finds that men enjoy hazards of tenure that are 56% higher than that
for women.43 The di↵erence in hazard rates translates into di↵erences in time-to-tenure.
Figure 9 plots gender-specific densities of time-to-tenure associated with publishing one to
three T5 publications (see Online Appendix Figure O-A24 for non-parametric Kaplan Meier
plots of survival probabilities by gender and number of T5 publications). The densities for
females exhibit a rightward shift relative to their male counterparts. Kolmogorov-Smirnov
tests reported in the figure reject the null hypothesis of distributional equality across genders
at the 5% level for each level of T5 publication.
Given the statistical significance of the gender indicator, we next investigate di↵er-
ences in rewards associated with T5 publications by gender. We explore heterogeneity in
rewards to publication by interacting the publication variables in Equation 1 with an in-
dicator for gender. Online Appendix Figures O-A21–O-A23 present gender-specific tenure
hazards associated with di↵erent levels of publishing in di↵erent journal categories. Figure
O-A21 plots hazards associated with the first three T5 publications, by gender. Females
are estimated to have higher hazard rates to tenure for the first T5 publication. However,
the estimate associated with the first T5 is only statistically significant for male faculty at
the 5% level. Males are estimated to have markedly higher hazard rates than females for
the second and third T5 publication. The hazard rate associated with two T5 publications
is 56% higher for males than for females. The hazard rate associated with three T5 pub-
lications is 86% higher for males. The hazard rate estimates for the second and third T5
publications are only statistically significant for male faculty. These gender di↵erences in
hazard rates suggest that male faculty reap greater rewards for T5 publication–the same
43
Our estimate is not directly comparable with that of Kahn (1993) because we adopt di↵erent model
specifications and use a richer control set (our data collection procedure yields richer bibliographic data).
26You can also read