Economic Value of the Surf Industry to Surf Coast Shire - Surf Coast Shire Council
←
→
Page content transcription
If your browser does not render page correctly, please read the page content below
Economic Value of the Surf Industry
                to Surf Coast Shire
             Surf Coast Shire Council

                        FINAL REPORT
                       December, 2014
Economic Value of the Surf Industry to Surf Coast Shire

Document Control
              Job ID:               17461
              Job Name:             Economic Value of the Surf Industry to Surf Coast Shire
              Client:               Surf Coast Shire
              Client Contact:       Matt Taylor
              Project Manager:      Ashley Page
              Email:                ashley.page@aecgroupltd.com
              Document Name:        AEC Group Economic Value of the Surf Industry FINALa.docx
              Last Saved:           30/12/2014 12:58 PM

              Version             Date                    Reviewed        Approved
              Draft Report v1.0   29 October, 2014           ARP             ARP
              Draft Report v2.0   5 December, 2014           ARP             ARP
              Final Report        18 December, 2014          ARP             ARP
              Final Report a      30 December, 2014          ARP             ARP

Disclaimer:
Whilst all care and diligence have been exercised in the preparation of this report, AEC Group Pty Ltd does not
warrant the accuracy of the information contained within and accepts no liability for any loss or damage that
may be suffered as a result of reliance on this information, whether or not there has been any error, omission
or negligence on the part of AEC Group Pty Ltd or their employees. Any forecasts or projections used in the
analysis can be affected by a number of unforeseen variables, and as such no warranty is given that a particular
set of results will in fact be achieved.

                                                                                                               ii
Economic Value of the Surf Industry to Surf Coast Shire
Executive Summary
The Surf Coast Shire surf industry consists of organisations that generate revenues
through the supply of goods and services to residential, consumer and tourist markets
that participate directly or indirectly in surf-related activities.
Surf Industry in Surf Coast Shire
As the location of choice for one of the world’s premier annual professional
surfing events - the Rip Curl Pro at Bells Beach - and home to internationally
marketed retail surf brands, Surf Coast Shire is a location of historical and
contemporary significance to the global surfing community.
Surfing has been a feature activity of Surf Coast Shire for almost a century; and the surf
industry itself a notable contributor to the regional economy since the 1960s. The first
Bells Beach surf competition was held in 1962 and as the forerunner to the current Rip Curl
Pro, holds historical significance in showcasing the region and promoting its reputation as
one of the world’s best surfing destinations.
Major retail brands Rip Curl and Quiksilver commenced operations in Torquay in the late
1960s as small cottage industries, with occasional forays into manufacturing and marketing
of items such as surfboards, board shorts, t-shirts and wetsuits.
The cold conditions prompted innovation requiring designs of products that surfers need -
these businesses recognised and filled gaps in an emerging international market and as a
result have expanded to become multi-million dollar organisations sitting in the top three
global surfing brands. Strapper and Modom are other Torquay brands that have expanded
beyond the surf strip, with retail outlets in other Victorian coastal towns and shopping
centres and in Modom’s case globalised operations. Surf Coast Shire is also home to a
large number of small and niche surf equipment designers, manufacturers and retailers,
providing custom equipment and services, as well as surf schools and clubs.
The Shire also boasts many small and home based surf businesses, which contribute
substantially to the local surf industry supply chain. Surf Coast – and much of the serviced
market – consists of interstate and international clients.
Surf Coast Shire has adopted The Home of Australian Surfing brand. The brand is
underpinned by several factors that, when combined, reflect the surfing dominated
economy and culture of Surf Coast Shire:
Natural, world renowned surf assets and conditions, headlined by the Bells Beach
Surfing Recreation Reserve.
Birth place of Rip Curl and Quiksilver and current Rip Curl global and Quiksilver Asia
Pacific headquarters.
Home of Surfing Victoria, one of the oldest surfing administration organisations in the
world and the largest State Sporting Organisation in Victoria not based in Melbourne.
Australian National Surfing Museum (SurfWorld Museum) the world’s largest and only
accredited surfing museum.
Highly technical and innovative surf businesses at the leading edge of equipment and
apparel design and development.
One of the most intensive surf industry/ activity clusters in the world – Surf City &
Baines Crescent precinct.
The largest Surf Lifesaving club in Victoria (Anglesea)
Home of Torquay Boardriders Club – one of Australia’s largest and most active
boardriding clubs.
The emergence of surfing as a standalone industry in the 1960’s - combined with the
unique conditions of local Surf Coast Shire waves and water temperatures, inspired
the establishment of the Torquay based, multi-million dollar Rip Curl and Quiksilver.
iii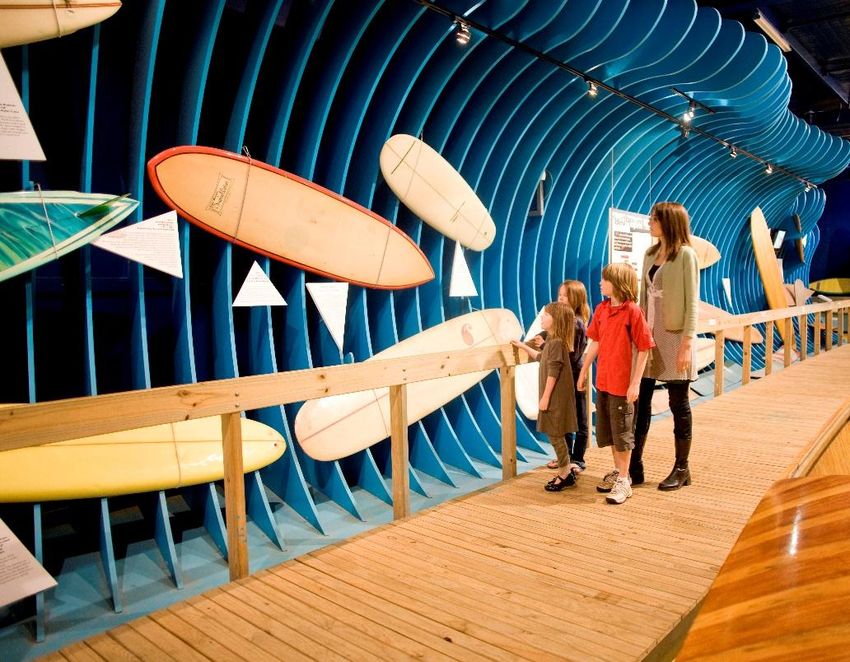
Economic Value of the Surf Industry to Surf Coast Shire
Key Findings
Economic Contribution
The surf industry is a key contributor to the local Surf Coast Shire economy, both directly
and indirectly, supporting around one quarter of the Shire’s industry value added ($217.0
million) and local jobs (2,034 FTE jobs).
The surf industry primarily contributes to Surf Coast Shire’s economy through distribution
and sales of surf equipment and services, surf equipment design and manufacture and
provision of accommodation and food/ beverages for visitors to Surf Coast Shire for surf-
related purposes.
Table ES.1. Total Contribution of the Surf Industry to Surf Coast Shire’s Economy, 2013
Contribution Output ($M) Industry Value Incomes ($M) Employment
Added ($M) (FTEs)
Contribution to Surf Coast Shire Economy
Direct $330.8 $155.3 $82.2 1,532
Production Induced (Type I) $79.2 $34.4 $18.7 306
Consumption Induced (Type II) $47.1 $27.4 $9.9 196
TOTAL CONTRIBUTION $457.2 $217.0 $110.9 2,034
TOTAL SURF COAST ECONOMY $1,789.6 $819.8 $393.3 7,561
Percent Contribution to Surf Coast Shire Economy
Direct 18.5% 18.9% 20.9% 20.3%
Production Induced (Type I) 4.4% 4.2% 4.8% 4.0%
Consumption Induced (Type II) 2.6% 3.3% 2.5% 2.6%
TOTAL CONTRIBUTION 25.5% 26.5% 28.2% 26.9%
Source: REMPLAN (2014), Department of Employment (2014), AEC.
Key Issues & Opportunities
A series of ongoing investments and development initiatives are required to support the
growth and development of the surf industry locally; including focus on infrastructure,
business skills development and training.
Analysis of consultation and surveys of businesses in Surf Coast Shire identified a range of
initiatives and requirements necessary to facilitate further growth of the surf industry into
the future:
The retention and protection of Surf Coast Shire’s surf culture, history and key surf
assets such as Bells Beach, is critical to supporting the long term sustainability of the
local surf industry.
Clear and concise messaging and brand promotion of Surf Coast Shire and particularly
Torquay is important to attract domestic and overseas visitors, growing the industry,
and retaining key surf businesses. Key messages include:
o Branding as ‘The Home of Australian Surfing’ and ‘Start of the Great Ocean Road’.
o A world leader of surf industry innovation and development.
o A unique combination of surf assets.
There is potential to extend Surf Coast Shire experiential tourism product base to target
a non-surf tourism market, through promotion of both ocean based and land based
‘adventure’ and recreational activities throughout the year. This would:
o Increase Surf Coast Shire’s appeal as a destination for visitors to come and stay,
rather than pass through on the way to other nearby attractions.
o Capture more visitor spend locally.
o Alleviate some of the seasonality issues the industry currently experiences, by
providing options to attract visitors during traditionally non-peak periods.
iv
Economic Value of the Surf Industry to Surf Coast Shire
There is potential to promote the SurfWorld Museum as an attraction for interstate and
international visitors, leveraging the facility’s status as the world’s largest and only
accredited surfing museum in the world.
There may be potential to develop a Surf Centre of Excellence training facility to provide
career pathways and high performance training for surf related activities and careers.
The Centre would also provide an opportunity to export education overseas through
engagement of international students.
Infrastructure upgrades, in particular road infrastructure - including better signage,
parking and supporting facilities, would improve access to key surf assets and attract
greater visitation and visitor spend locally (e.g. signage promoting Torquay as the Start
of the Great Ocean Road combined with enhanced infrastructure and ancillary signage,
will increase visitor awareness and encourage stop overs and subsequent visitor spend).
Enhanced industry networking and leadership are required to facilitate greater industry
coordination and manage growth potential. This includes improved accessibility and
responsiveness between industry and local government and strong support by local
government in promoting and building Surf Coast Shire’s surf brand.
Any activities undertaken to promote and grow the industry should seek to retain and
maintain Surf Coast Shire’s surf culture, environment and niche products and experiences.
Recommendations
The following recommendations are made:
Strong brand messages - promote Surf Coast Shire, in particular Torquay, as
the Home of Australian Surfing and the Start of the Great Ocean Road. Seek
to secure and deliver new surfing events throughout Surf Coast: There is an
opportunity to leverage the globally recognised surf assets (including Torquay and Bells
Beach Surfing Recreation Reserve) and local industry. Branding (and associated
collateral) as the Home of Australian Surfing in Torquay and Start of the Great Ocean
Road should be finalised and used in promotion and branding activities. In addition,
new events could be attracted in the off peak seasons at different locations across Surf
Coast Shire. There is a unique opportunity to promote cooler months as the best surfing
conditions.
Identify, prioritise and implement key surf industry infrastructure
requirements: Many visitors to the Geelong and Great Ocean Road region bypass key
townships in Surf Coast Shire (e.g., Torquay) and come and go from the Shire without
spending locally. Potential infrastructure enhancements should be investigated to
improve signage, awareness and accessibility of Surf Coast Shire assets, as well as
overall visitor experiences. Torquay’s CBD should better reflect the history and culture
of surfing.
Enhance, expand and promote the Australian National Surfing Museum
(SurfWorld Museum) and develop the Surf City precinct as a key destination
and visitor attractor: The SurfWorld Museum should be leveraged and promoted as
a drawcard to attract greater levels of international and interstate visitation to Surf
Coast Shire. Options for refurbishing and/ or expanding SurfWorld Museum to enhance
the facility should be investigated.
Facilitate enhanced access to Baines Crescent/ Surf City precinct through
street-scaping and master planning: Options for master planning and revitalising
the Baines Crescent/ Surf City precinct should be investigated, to provide an integrated,
connected and revitalised precinct that showcases the significant local surf culture and
history and provides a key visitor destination offering surf retail, cafés, the visitor
information centre and SurfWorld Museum.
Investigate developing a Surf Centre of Excellence: There may be potential for a
Surf Centre of Excellence training facility, providing not only high performance training
for surf related activities, but also a longer term surf industry career pathways and
skills development. Feasibility of such a facility should be investigated.
Facilitate and implement a small business network and cluster enhancement/
innovation development program: There is an opportunity for enhanced industry
networking and greater communication and responsiveness between local government
v
Economic Value of the Surf Industry to Surf Coast Shire
and the local surf industry, in particular small business. It is recommended a program
be facilitated and implemented to support small business development and networking,
as well as supporting and promoting innovation in the surf industry. There are a number
of localised professional service businesses, which could play a role in the provision of
support and training.
Form a closer working relationship with Surfing Victoria and jointly pursue
projects to advance the surfing industry: The location of Surfing Victoria’s
headquarters in Torquay provides an excellent platform for a collaborative approach to
identifying and pursuing key projects. This could also include the formation of an
implementation committee to enact the above recommendations. Local surf industry
stakeholders highlighted better promotion, increased leadership and cohesiveness and
improved government support as being required to support the surf sector. Closer ties
with Surfing Victoria would achieve all of these aspects and help drive the sustainability
and growth of the sector.
vi
Economic Value of the Surf Industry to Surf Coast Shire

Table of Contents
          DOCUMENT CONTROL......................................................................................... II
          EXECUTIVE SUMMARY ...................................................................................... III
          TABLE OF CONTENTS........................................................................................ VII
          1.     INTRODUCTION .......................................................................................... 1
          1.1     BACKGROUND .................................................................................................. 1
          1.2     PURPOSE ....................................................................................................... 1
          1.3     APPROACH ...................................................................................................... 1
          2.     OVERVIEW .................................................................................................. 2
          2.1     ECONOMIC OVERVIEW ........................................................................................ 2
          2.2     SURF-BASED TOURISM VISITATION ......................................................................... 4
          2.3     COMPARISON TO OTHER SURF DESTINATIONS ............................................................. 5
          2.4     HISTORY OF SURFING IN SURF COAST SHIRE .............................................................. 8
          3.     ECONOMIC CONTRIBUTION OF THE SURF INDUSTRY................................ 10
          3.1     APPROACH .................................................................................................... 10
          3.2     OVERVIEW OF ECONOMIC CONTRIBUTION ................................................................ 10
          3.3     LOCAL SALES & EXPORTS .................................................................................. 16
          4.     LOCAL SURF HISTORY & CONTEXT ............................................................ 18
          4.1     SURF ASSETS ................................................................................................ 18
          4.2     SURF LIFESTYLE & POPULATION ........................................................................... 25
          4.3     LOCAL SURF BUSINESS CASE STUDIES ................................................................... 25
          5.     SURF INDUSTRY ISSUES & OPPORTUNITIES............................................. 31
          5.1     KEY SURF INDUSTRY OPPORTUNITIES ..................................................................... 31
          5.2     CRITICAL SURF INDUSTRY ISSUES......................................................................... 32
          5.3     GROWING THE SURF INDUSTRY ............................................................................ 33
          6.     FINDINGS & RECOMMENDATIONS ............................................................ 35
          6.1     SUMMARY OF FINDINGS ..................................................................................... 35
          6.2     RECOMMENDATIONS ......................................................................................... 36
          REFERENCES ..................................................................................................... 39
          APPENDIX A: LITERATURE REVIEW .................................................................. 41
          APPENDIX B: ENGAGEMENT PROGRAM ............................................................. 44
          APPENDIX C: BUSINESS & INDUSTRY SURVEY ................................................. 45
          APPENDIX D: ECONOMIC CONTRIBUTION MODEL METHODOLOGY ................... 50

                                                                                                                                vii
Economic Value of the Surf Industry to Surf Coast Shire

1.        Introduction
1.1       Background
          The surfing industry plays a prominent and defining role in Surf Coast Shire’s economy,
          anchored by world renowned surfing assets such as Bells Beach. However, historically no
          official statistics to identify the size, nature or value of the surf industry to the local
          economy have existed.
          Surf Coast Shire and in particular Torquay, has been the unofficial home of surfing in
          Australia since the industry began.
          The exceptional natural assets and coastal conditions of Surf Coast Shire have seen the
          local surf industry drive innovation in the international market, with the development and
          manufacture of surfboards, equipment and apparel. Brands such as Rip Curl and Quiksilver
          have become internationally renowned, whilst smaller businesses across manufacturing,
          retail, recreation, education and accommodation make a significant indirect contribution to
          operations in the surf industry and the visitor population.
          Surf Coast Shire is also home to the Rip Curl Pro at Bells Beach Surfing Recreation Reserve,
          recognised as one of the world’s most significant and prestigious surfing events since 1962,
          attracting the world’s best surfers each year.

1.2       Purpose
          The purpose of this study and the Surf Industry Contribution and Significance Mapping
          project is to identify and wherever possible, quantify the contribution and significance that
          the surfing industry holds for Surf Coast Shire’s economy.
          The findings of the analysis will be used to assist in the branding and communication of
          the significance of the surf industry within Surf Coast Shire and aid investment attraction.
          To do this, a more accurate picture of business growth opportunities is required.
          The report also presents a summary of the key issues facing the industry locally, the
          opportunities for development and the most important things identified by local business
          stakeholders (surf and non-surf sector based) as needing to be done to support and grow
          the industry moving forward.

1.3       Approach
          The approach undertaken to develop the study is outlined in the following diagram and
          involved detailed industry and key business stakeholder engagement; as well as an
          extensive research and literature review. Stakeholders included businesses in Surf Coast
          Shire that are directly and indirectly involved with the surf industry. Face to face
          consultations have been held with businesses in the key towns of Torquay, Anglesea, Aireys
          Inlet and Lorne.
            Task

                          Situation Analysis             Primary Research           Analysis & Reporting

                                                                                    Input-Output Significance
                           Understanding of the        Face to face meetings with
                                                                                             Assessment.
            Outcomes

                        current state of play of key       key stakeholders.
                                                                                      Identification of the key
                                 statistics.              Targeted telephone
                                                                                     issues and opportunities
                          Research history of the                survey.
                                                                                        facing the surf sector
                         surf sector and identify/        Online Web survey.
                                                                                                locally.
                        review available literature     Follow-up engagement.
                                                                                        Surf Industry Profile.

          Source: AEC

                                                                                                                  1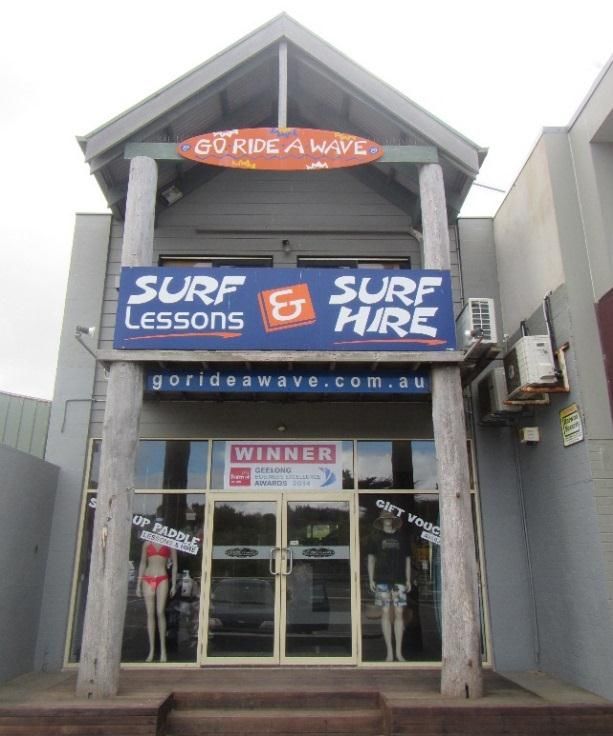
Economic Value of the Surf Industry to Surf Coast Shire

2.        Overview
2.1       Economic Overview
2.1.1     Population

          Surf Coast Shire had an estimated resident population of 28,282 as at June 2013, having
          experienced 2.9% growth from the previous year. This is consistent with Surf Coast Shire’s
          average annual growth since 2003 and is considerably higher than growth rates
          experienced across Victoria over the past decade.
          Between 2007 and 2013, Surf Coast Shire’s population growth rate has been over 3.0%,
          whereas the Victorian average annual population growth has been around 2.0% per annum
          over the same period.
          Figure 2.1 displays overall population and growth in Surf Coast Shire between 2011 and
          2013, with a comparison to the Victorian population growth rate.

          Figure 2.1. Surf Coast Shire Population
                             30,000                                                                          6.0%

                             25,000                                                                          5.0%

                                                                                                                    Population Growth (%)
                             20,000                                                                          4.0%
          Population (No.)

                             15,000                                                                          3.0%

                             10,000                                                                          2.0%

                              5,000                                                                          1.0%

                                 0                                                                           0.0%
                                      2001 2002 2003 2004 2005 2006 2007 2008 2009 2010 2011 2012 2013
                                             Surf Coast Total Popultation     Surf Coast Population Growth
                                             Victoria Population Growth
          Source: ABS (2014).

2.1.2     Gross Regional Product

          Surf Coast Shire recorded Gross Regional Product (GRP) of $923.6 million in 2013
          (REMPLAN, 2014). Figure 2.2 provides a breakdown of by industry value-added (IVA)
          across Surf Coast Shire industries, and shows the Shire’s key industries by IVA include
          ‘Rental, Hiring and Real Estate Services’1 (18.1% of Surf Coast Shire IVA), ‘Construction’
          (11.6% of Surf Coast Shire IVA) and ‘Wholesale Trade’ (9.4% of Surf Coast Shire IVA).

          1
            The rental, hiring and real estate services industry estimate of value added includes value added of approximately
          $124 million from ownership of dwellings. In the economic contribution assessment the ownership of dwellings
          industry has been separated from the rest of the rental, hiring and real estate services industry.

                                                                                                                                            2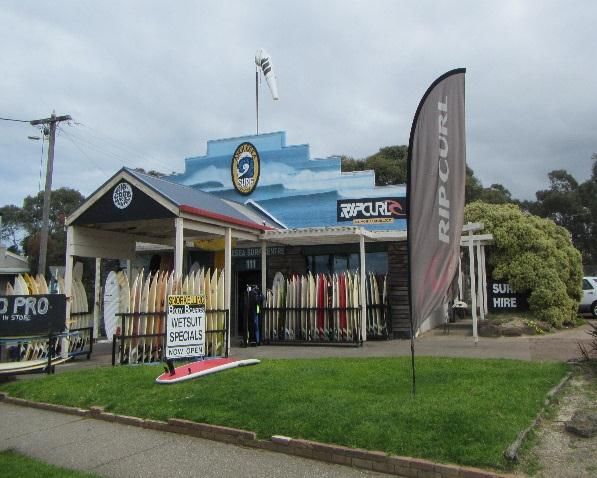
Economic Value of the Surf Industry to Surf Coast Shire

          Figure 2.2. Surf Coast Shire Industry Value Added, 2013

                                  Rental, Hiring & Real Estate Services
                                                            Construction
                                                       Wholesale Trade
                                        Accommodation & Food Services
                                                            Retail Trade
                                          Financial & Insurance Services
             Professional, Scientific & Technical Services
                               Electricity, Gas, Water & Waste Services
                                         Health Care & Social Assistance
                                          Agriculture, Forestry & Fishing
                                                          Manufacturing
                                                   Education & Training
                                          Public Administration & Safety
                                     Administrative & Support Services
                                                          Other Services
                        Information Media & Telecommunications
                                        Transport, Postal & Warehousing
                                              Arts & Recreation Services
                                                                  Mining

                                                                        0.0%    5.0%         10.0%       15.0%      20.0%
                                                                                    Industry Value-Add (%)
          Source: REMPLAN (2014).

2.1.3     Labour Force

          Figure 2.3 shows the size of Surf Coast Shire’s labour force and unemployment rate relative
          to the State average from the March quarter 2007 to the December quarter 2013. Surf
          Coast Shire recorded an unemployment rate of 3.7% for the December quarter 2013. Surf
          Coast Shire’s unemployment has been steadily increasing since the December quarter
          2008; however the increase has been from a low base of 2.8%. Surf Coast Shire’s
          unemployment rate has consistently been approximately two percent lower than the State
          average since the March quarter 2007.

          Figure 2.3. Surf Coast Shire Labour Force
                               16,000                                                                            8.0%

                               14,000                                                                            7.0%

                               12,000                                                                            6.0%
                                                                                                                        Unemployment Rate (%)
          Labour Force (No.)

                               10,000                                                                            5.0%

                                8,000                                                                            4.0%

                                6,000                                                                            3.0%

                                4,000                                                                            2.0%

                                2,000                                                                            1.0%

                                    0                                                                            0.0%
                                         Jun-07
                                         Sep-07
                                         Dec-07

                                         Jun-08
                                         Sep-08
                                         Dec-08

                                         Jun-09
                                         Sep-09
                                         Dec-09

                                         Jun-10
                                         Sep-10
                                         Dec-10

                                         Jun-11
                                         Sep-11
                                         Dec-11

                                         Jun-12
                                         Sep-12
                                         Dec-12

                                         Jun-13
                                         Sep-13
                                         Dec-13
                                         Mar-07

                                         Mar-08

                                         Mar-09

                                         Mar-10

                                         Mar-11

                                         Mar-12

                                         Mar-13

                                                           Surf Coast          Surf Coast          Victoria
          Source: Department of Employment (2014).

                                                                                                                                                3
Economic Value of the Surf Industry to Surf Coast Shire
The ‘Accommodation and Food Services’ and ‘Retail Trade’ industries are the largest
employers in Surf Coast Shire, which is largely attributed to the sizeable tourism sector.
These two industries combine to account for approximately 29.0% of Surf Coast Shire’s
total employment (REMPLAN, 2014). In contrast, on a State basis, these two industries
account for approximately 17.3% of Victoria’s total employment (ABS, 2012).
2.1.4 Average Weekly Income
The average weekly wage in Surf Coast Shire was approximately $809.5 in 2011, well
below the State average of $986.4. Surf Coast Shire’s leading industries by average weekly
wage were ‘Electricity, Gas, Water and Waste Services’ ($1,530.6), ‘Mining’ ($1,448.2) and
‘Financial and Insurance Services’ ($1,135.6) (ABS, 2012).
2.2 Surf-Based Tourism Visitation
Surf Coast Shire is a key surf tourism destination, and is also the gateway to the Great
Ocean Road, one of the world's most scenic coastal drives. Surf Coast Shire recorded a
total of 1.8 million tourism visitors for the year ending June 2014, a 38.7% increase from
the previous year. The majority of visitors (1.0 million) to Surf Coast Shire were classified
as day-trip visitors, while there were also 800,000 domestic overnight and 31,000
international visitors for the year.
A summary of historical tourist visitation to Surf Coast Shire each year between year ending
June 2006 and year ending June 2014 is displayed in Figure 2.4, including a breakdown by
visitor type. Historically (year ending June 2006 to year ending June 2014) day-trip visitors
have accounted for approximately 57% of visitation to Surf Coast Shire, while domestic
overnight visitors have accounted for 41% and international visitors the remaining 2% of
visitation.
Figure 2.4. Surf Coast Shire Total Visitation
2,000
1,800
1,600
1,400
Total Visitation ('000)
1,200
1,000
800
600
400
200
0
2006 2007 2008 2009 2010 2011 2012 2013 2014
Day-Trip Domestic Overnight International
Source: TRA (2014).
Seasonally, the March quarter is by far the busiest time of the year for tourism in Surf
Coast Shire, having averaged 640,000 visitors between 2005 and 2014. The December
quarter is also a strong period for tourism visitation, receiving an average of 395,000
visitors each quarter. This seasonality of tourism visitation is consistent with other beach
regions around Australia as the March and December quarters coincide with warmer
weather and holiday periods.
4Economic Value of the Surf Industry to Surf Coast Shire
The Lorne-Anglesea area2 has been the main driver of visitation to Surf Coast Shire,
averaging 898,000 visitors per annum from the year ending June 2006 to the year ending
June 2014. In contrast, the Torquay area3 has averaged 646,000 visitors annually over this
period. The Lorne-Anglesea area also averaged close to double the number of domestic
overnight and international visitors than the Torquay area over this period.
Figure 2.5 highlights the importance of Surf Coast Shire’s beaches in attracting visitors. In
the year ending June 2014, approximately 71.2% of visitors to Surf Coast Shire went to
the beach. The proportion of visitors going to the beach was even higher for both domestic
overnight (73.9%) and international (86.4%) visitors.
Figure 2.5. Surf Coast Shire Beach Visitation
2,000 100%
1,800 90%
1,600 80%
Visitors Going to the Beach (%)
1,400 70%
Total Visitation ('000)
1,200 60%
1,000 50%
800 40%
600 30%
400 20%
200 10%
0 0%
2006 2007 2008 2009 2010 2011 2012 2013 2014
Went Surfing Went to the Beach Didn't Go to Beach % Went to Beach
Source: TRA (2014).
Surfing is a major driver of visitors going to the beach in Surf Coast Shire. Data from
Tourism Research Australia (2014) estimates on average 10.8% of visitors to Surf Coast
Shire from the year ending June 2006 to the year ending June 2014 have surfed during
their stay. The proportion is higher for overnight visitors with approximately 19.9% of
international and 12.2% of domestic overnight visitors to Surf Coast Shire having surfed
over this period.
Bells Beach near Torquay is home to the world’s longest running surfing competition in the
form of the Rip Curl Pro Bells Beach (Rip Curl, 2014). This event is a significant attraction
for both local and international surf competitors and fans, with upwards of 35,000 visitors
estimated to attend the week and half long event annually. Through both online and
traditional forms of broadcasting, it is anticipated that the broader national and
international audience is in the millions.
2.3 Comparison to Other Surf Destinations
Surf Coast Shire is one of the most well known surfing locations in the world. The beaches
are a key natural amenity attracting a large number of visitors to the area each year. This
section highlights and compares the proportion of total visitors going to the beach or surfing
in Surf Coast Shire against some of Australia’s top surf locations. Internationally recognised
comparison surf localities examined include:
2
Represented by the Lorne-Anglesea Statistical Area 2 (SA2) as classified by the ABS (Surf Coast, 2014).
3
Represented by the Torquay SA2 as classified by the ABS (Surf Coast, 2014).
5Economic Value of the Surf Industry to Surf Coast Shire
Gold Coast (C).
Byron Bay (A).
Augusta-Margaret River (S).
Figure 2.5 indicates Surf Coast Shire attracts the highest proportion of visitors that go to
the beach (average of 71.2% between year ended June 2006 and year ended June 2014),
compared to other major surf locations in Australia. Byron Bay (average of 59.0%)
recorded the next highest proportion of visitors going to the beach, followed by Augusta-
Margaret River (44.5%) and the Gold Coast (43.4%).
Figure 2.6. Proportion of Visitors that Got to the Beach (Year Ended June 2006 to 2014)
90.0%
80.0%
Visitors Going to the Beach (%)
70.0%
60.0%
50.0%
40.0%
30.0%
20.0%
10.0%
0.0%
2006 2007 2008 2009 2010 2011 2012 2013 2014
Surf Coast (S) - Going to the Beach (%) Gold Coast (C) - Going to the Beach (%)
Byron (A) - Going to the Beach (%) Augusta-Margaret River (S) - Going to the Beach (%)
Source: TRA (2014).
Surf Coast Shire also receives considerably more visitors to the beach per local resident
than any of the other comparison surf areas in Australia. This is a reflection of an area that
is highly reliant on surf-based visitation for local economic activity. It is estimated that for
every Surf Coast Shire local resident there are 40.7 visitors who visited the beach (on
average, between year ended June 2006 and year ended June 2014), considerably higher
than the next highest comparison areas of Byron Bay (26.8 visitors per local resident) and
Augusta-Margaret River (25.2 visitors per local resident) over the same period. For detailed
information refer to Table 2.1.
Table 2.1. Visitors Going to Beach, Visitors Per Local Resident, Year Ended June 2006 to
2014
Year Ended Surf Coast (S) Gold Coast (C) Byron Bay (A) Augusta-
June Margaret
River (S)
2006 37.4 5.8 24.0 26.0
2007 49.2 4.5 28.0 32.1
2008 55.2 5.1 29.1 27.7
2009 40.8 6.3 32.0 24.0
2010 37.8 6.6 26.4 23.5
2011 35.2 7.3 26.6 24.4
2012 34.4 7.4 22.6 20.0
2013 31.2 7.8 24.1 21.3
2014 44.9 7.2 28.2 27.5
Average 40.7 6.4 26.8 25.2
Note: Populations for 2014 are not yet officially released, this figure represents an estimated number based on average annual
growth over the last seven years.
Source: TRA (2014), ABS (2014).
6Economic Value of the Surf Industry to Surf Coast Shire
Going surfing is also a key reason for visiting Surf Coast Shire compared to other key
surfing locations in Australia, though comparisons are closer than for visiting the beach (as
highlighted in Figure 2.7). The proportion of overall visitors to Surf Coast Shire that go
surfing is in line with Augusta-Margaret River figures and accounts for a higher proportion
of total visitors than the Gold Coast. Surf Coast Shire has typically recorded a lower
proportion of visitors that go surfing than in Byron Bay, particularly since 2010.
Figure 2.7. Proportion of Visitors that Go Surfing, Year Ended June 2006 to 2014
20.0%
18.0%
16.0%
14.0%
Visitors Surfing (%)
12.0%
10.0%
8.0%
6.0%
4.0%
2.0%
0.0%
2006 2007 2008 2009 2010 2011 2012 2013 2014
Surf Coast (S) - Surfing (%) Gold Coast (C) - Surfing (%)
Byron (A) - Surfing (%) Augusta-Margaret River (S) - Surfing (%)
Source: TRA (2014).
Surf Coast Shire has recorded approximately the same level of visitors (per local resident)
to go surfing, as Byron Bay between year ended June 2006 and year ended June 2014.
Since 2010 the number of visitors that go surfing (as a ratio of total local resident
population), has been below Byron Bay’s (see Table 2.2). Surf Coast receives considerably
higher visitor numbers to go surfing than the other comparison areas of Augusta-Margaret
River and the Gold Coast.
Table 2.2. Visitors that Go Surfing, Visitors Per Capita, Year Ended June 2006 to 2014
Year Ended Surf Coast (S) Gold Coast (C) Byron Bay (A) Augusta-
June Margaret
River (S)
2006 6.4 0.8 7.5 2.5
2007 11.3 0.6 6.8 2.7
2008 11.5 0.5 5.6 2.1
2009 6.4 0.7 5.2 2.2
2010 6.3 0.7 7.2 1.9
2011 5.1 0.7 6.0 3.0
2012 3.1 0.7 4.8 1.6
2013 4.7 0.7 5.9 1.9
2014 4.6 0.5 8.9 1.2
Average 6.6 0.6 6.4 2.1
Note: Populations for 2014 are not yet officially released, this figure represents an estimated number based on average annual
growth over the last seven years.
Source: TRA (2014), ABS (2014).
7Economic Value of the Surf Industry to Surf Coast Shire
2.4 History of Surfing in Surf Coast Shire
The 1900’s saw surfing come to Australia, with legendary Hawaiian Duke
Kahanamoku one of the first on record to give demonstrations in NSW in
1914/ 19154. Since this time, surfing has grown to become a multi-billion
dollar industry, with Torquay founded brands Rip Curl and Quiksilver leading
the international surf market.
As the surf industry was emerging, the unique coastal conditions of Surf
Coast Shire provided the perfect inspiration for these businesses to fill gaps in
a new market - developing products that surfers need, through both research
and innovation.
In 1915, a 17 year old by the name of Grace Wootton “…began surfing prone on small
timber boards, reportedly brought to Australia from Hawaii…” (Baker, 2013). In 1919, Louis
Whyte, a wealthy Geelong businessman used to travel to his holiday house in Lorne replete
with surfboards that he had purchased from Duke Kahanamoku. Further early surfing
history of Surf Coast Shire tells of Ainsley ‘Sprint’ Walker being transferred from Sydney
to Melbourne in the early 1920s and setting up the Torquay Surf Club with a group of local
surfers. Vic Tantau was another early pioneer of surfing and in the late 1940s could be
seen surfing breaks around the Torquay and Bells Beach areas.
Figure 2.8. Vic Tantau, 1948
Photo courtesy of SurfWorld Musuem
In 1962 Vic Tantau and Peter Troy
organised the first Bells Beach
surfing competition (Bells Beach
Surf Classic), which was won by
Glynn Ritchie. In 1973 the event
became professional and was won
by Michael Peterson (from
Queensland), who went on to win
the following two years as well.
The annual surf competition at
Bells Beach Surfing Recreation
Reserve is now the world’s longest
running surfing competition – the
Rip Curl Pro – attracts the world’s
best surfers and is held every
Easter (Rare Surf Tees, 2014). The
first recorded winner (1964) of the
Women’s event was Gail Couper
who went on to win 10 times in the
period 1964-1976.
The first serious surfing businesses
started to emerge in the Victorian
coastal town of Torquay in the late
1960's (Walding, 2006). A couple
of surfers, Doug Warbrick and
Brian Singer – the founders of Rip
Curl, put their money together and
started making wetsuits to keep
the chill of the southern ocean at
bay so they could surf longer. They
would turn their fledgling company
into one of the three multi-million
dollar global surf empires. In 1969
4
This is questioned by Mark Maddox who in an article in the Sydney Morning Herald in 2007 claims that Australian
surfers were riding boards at North Steyne as early as 1911 (Benns, 2007).
8Economic Value of the Surf Industry to Surf Coast Shire
two Torquay locals, Alan Green and John Law, started making board shorts and wetsuits
in their home garage and Quiksilver was born.
In the early days, Rip Curl and Quiksilver were essentially small cottage industries with
occasional forays into manufacturing and marketing items like surfboards, board shorts, t-
shirts and wetsuits. In the mid-80's there was a huge boom in the surfing industry and
demand for merchandising, lifestyle products and surfing accessories took off. In 2002,
Quiksilver was listed on the New York Stock Exchange with revenue in excess of $800
million.
Strapper is another Torquay brand that has expanded beyond the Torquay surf strip and
has retail outlets in other Victorian coastal towns and shopping centres. Strapper
commenced business in 1976 but its roots are in the fledgling Torquay surf industry in the
1960’s. Current owner of Strapper Surf Michael DiSciascio started as a shaper with Strapper
in the late 1970’s.
Similarly, Modom is continuing to expand on a global scale as a major surf accessory
provider. While much of the employment is based offshore, Modom’s Torquay base is where
the design and knowledge base (IP) activity takes place. Uniquely, all of Modom’s
marketing is via online mediums.
Figure 2.9. Bells Beach
Photo courtesy of SurfWorld Museum
From humble and modest beginnings the surf industry in Surf Coast Shire has
become globally significant touching virtually every part of the world.
9Economic Value of the Surf Industry to Surf Coast Shire
3. Economic Contribution of the Surf
Industry
Definition of the Surf Industry
For the purposes of this study, the following definitions have been made regarding the
surf industry:
A surf-related activity refers to both active and passive surfing and related
recreational activities (e.g., actively participating in or watching surfing at the beach,
participating in or attending surf historical or cultural/ amenity activities).
Organisations in the surf industry are defined as including:
o Any business or other organisation (including clubs) that produce/ provide goods
or services directly related to undertaking a surf-related activity (e.g., surf
clothing and equipment design, manufacture, retail and repair, surf lifesaving,
surf education, surf tourism, surf event organisation).
o Other businesses or organisations (including clubs) that have located to Surf
Coast Shire specifically to service consumers undertaking surf-related activity.
Any business or other organisation (including clubs) that produce/ provide goods or
services that are consumed by visitors to Surf Coast Shire whose primary purpose of
visit is to undertake a surf-related activity.
The surf industry is defined as including organisations who supply goods and
services to consumers that undertake surf-related activities, as well as those
organisations providing other goods and services to people attracted to Surf
Coast Shire for surf-related activities.
Many businesses in Surf Coast Shire generate revenue through a mix of surf-
related activity and other activities.
3.1 Approach
The contribution of the surf industry to Surf Coast Shire’s economy has been estimated
using an economic significance assessment approach, based on a 2013 Surf Coast Shire
transaction table. The table was produced by REMPLAN (2014) and includes findings from
industry consultation and business surveys conducted as part of this report. An overview
of the economic significance assessment approach is provided in Appendix D. Details
regarding the consultation and surveying undertaken are provided in Appendix B and
Appendix C, respectively.
This section highlights the direct contribution of the surf sector in Surf Coast Shire (i.e.,
the size and nature of the businesses identified as participating in the local surf sector) as
well as the flow-on contribution of the industry locally. See Appendix D for definitions of
direct and flow-on contributions.
3.2 Overview of Economic Contribution
3.2.1 Direct Economic Contribution of the Surf Industry
Surf Coast Shire’s surf industry is estimated to have directly generated over $330 million
in industry output (similar to turnover) in 2013, contributing over $155 million in industry
value added and employing more than 1,500 full time equivalent (FTE) jobs5 in the local
economy6. The surf industry also directly provided over $82 million in income of people
employed in the industry in Surf Coast Shire.
5
Where one FTE job is equivalent to one person working full time for a period of one year.
6
The part time and casual nature of many people employed in the industry means the actual number of people
employed in the surf industry is far greater than the FTE estimate.
10Economic Value of the Surf Industry to Surf Coast Shire
Table 3.1 shows the surf industry in Surf Coast Shire is largely represented by wholesale
trade (including distribution centres for major surf companies Rip Curl and Quiksilver),
retail trade, manufacturing of surf equipment and clothing, and professional, scientific and
technical services (primarily through design and marketing activities). Accommodation and
food services and ownership of dwellings7 also generate a large contribution to the
economy as a result of servicing the surf industry, in particular through the provision of
accommodation (and food/ beverages) for surf tourists.
Table 3.1. Direct Contribution of the Surf Industry to Surf Coast Shire’s Economy by
Industry, 2013
Industry Output Industry Incomes Employment
($M) Value ($M) (FTEs)
Added ($M)
Agriculture, forestry and fishing - - - -
Mining - - - -
Manufacturing $66.5 $13.3 $6.9 133
Electricity, gas, water and waste services - - - -
Construction - - - -
Wholesale trade $101.7 $51.3 $31.7 340
Retail trade $52.5 $30.7 $20.2 557
Accommodation and food services $27.3 $12.0 $6.7 211
Transport, postal and warehousing $2.4 $1.0 $0.6 12
Information media and telecommunications $0.7 $0.3 $0.1 2
Financial and insurance services - - - -
Rental, hiring and real estate services $3.6 $1.4 $0.6 8
Professional, scientific and technical services $32.4 $14.9 $9.3 139
Administrative and support services $0.9 $0.4 $0.3 5
Public administration and safety - - - -
Education and training $3.3 $2.5 $2.1 36
Health care and social assistance $1.5 $1.0 $0.8 15
Arts and recreation services $3.3 $1.2 $0.7 24
Other services $5.5 $3.0 $2.1 49
Ownership of dwellings $29.2 $22.4 $0.0 1
Total $330.8 $155.3 $82.2 1,532
Source: REMPLAN (2014), Department of Employment (2014), AEC.
Figure 3.1 displays the direct contribution of industry to Surf Coast Shire’s economy in
terms of value added activity. The surf industry (in aggregate) directly contributes more in
terms of industry value added than the non-surf component of any other single industry in
Surf Coast Shire. The $155.3 million in industry value added represents a contribution of
$50 million more than the next highest contributing industries of ownership of dwellings
and construction. In total, the surf industry directly contributed an estimated 18.9% of
total industry value added in Surf Coast Shire’s economy in 2013.
7
The contribution from ownership of dwellings primarily represents the rental incomes and activities generated
through provision of private residences for short or long stay to surf related visitors.
11Economic Value of the Surf Industry to Surf Coast Shire
Figure 3.1. Direct Contribution to Surf Coast Shire Value Added by Industry, 2013
Surf industry $155.3
Ownership of dwellings $101.7
Construction $95.1
Accommodation and food services $54.3
Financial and insurance services $43.4
Electricity, gas, water and waste services $41.0
Agriculture, forestry and fishing $39.6
Health care and social assistance $39.4
Public administration and safety $30.8
Education and training $29.7
Professional, scientific and technical… $27.5
Wholesale trade $25.8
Retail trade $25.6
Rental, hiring and real estate services $23.1
Manufacturing $22.3
Administrative and support services $17.2
Other services $12.9
Information media and… $12.5
Transport, postal and warehousing $8.8
Arts and recreation services $7.4
Mining $6.3
$0 $25 $50 $75 $100 $125 $150 $175 $200
Industry Value Added ($ Million)
Note: For all industries represented in the figure (aside from the surf industry), the value added estimate represents the value
added for non-surf related components of the respective industry in Surf Coast Shire. For example, the $25.6 million for retail trade
excludes the $30.7 million in surf related retail trade IVA, which is included in the $155.3 million surf industry.
Source: REMPLAN (2014), AEC.
The surf industry (in aggregate) is also the largest employing industry in Surf Coast Shire
(see Figure 3.2); directly contributing around one fifth of Surf Coast Shire’s total FTE jobs
(20.3%). The surf industry employs around 500 more FTE employees than the next largest
industries (construction and non-surf related accommodation and food services).
The surf industry is highly seasonal in nature, with peak visitation periods during the
warmer months of the year. Survey and consultation with business highlighted many
businesses in the surf industry, particularly retail businesses, typically increased the
number of part time and casual staff during these periods. As such, the number of people
employed in the surf industry during peak periods is likely considerably more than outlined
in Table 3.1. However, it is estimated there was the equivalent of 1,532 full time employees
in the surf industry in 2013 on an annual basis.
12Economic Value of the Surf Industry to Surf Coast Shire
Figure 3.2. Direct Contribution to Surf Coast Shire Employment by Industry, 2013
Surf industry 1,532
Construction 1,016
Accommodation and food services 960
Health care and social assistance 579
Agriculture, forestry and fishing 495
Retail trade 464
Education and training 426
Public administration and safety 315
Professional, scientific and technical services 258
Manufacturing 224
Other services 214
Administrative and support services 213
Wholesale trade 171
Arts and recreation services 144
Rental, hiring and real estate services 137
Financial and insurance services 119
Electricity, gas, water and waste services 112
Transport, postal and warehousing 104
Information media and telecommunications 62
Mining 13
Ownership of dwellings 3
0 250 500 750 1,000 1,250 1,500 1,750
Employment (FTEs)
Note: For all industries represented in the figure (aside from the surf industry), the employment estimate represents the
employment for non-surf related components of the respective industry in Surf Coast Shire. For example, the 464 FTEs for retail
trade excludes the 557 FTEs in surf related retail trade, which is included in the 1,532 FTEs in the surf industry.
Source: REMPLAN (2014), Department of Employment (2014), AEC.
3.2.2 Flow-On Economic Contribution of the Surf industry
In addition to the sizable direct contribution the surf industry makes to Surf Coast Shire’s
economy, many businesses in Surf Coast Shire are supported indirectly by the surf industry
through flow-on activity. Two key types of flow-on activity are supported by the surf
industry:
Industry support (Type I) flow-on activity, as a result of expenditure by surf
businesses on inputs used in the production of goods and services provided by the surf
industry and subsequent effects throughout the local supply chain.
Household consumption induced (Type II) flow-on activity, through the
expenditure of incomes earned by those employed within the surf industry or
subsequently engaged by the surf industry indirectly.
Table 3.2 outlines the flow-on contribution of the surf industry to Surf Coast Shire’s
economy, by industry (including type I and type II flow-on impacts). The surf industry is
estimated to have supported approximately $126.3 million in business output through flow-
on activity in 2013 (including Type I and Type II flow-on activity), contributing $61.7 million
to industry value added activity in Surf Coast Shire’s economy and supporting 502 FTE
jobs.
Key industries supported through flow-on activity by the surf industry include ownership
of dwellings, professional, scientific and technical services, financial and insurance services,
rental, hiring and real estate services, and administrative and support services, with each
of these industries estimated to generate over $4 million in industry value added as a result
of flow-on activities. The surf industry is also a strong contributor to flow-on employment
in retail trade and accommodation and food services.
Estimates of flow-on activity presented in this study are considerably lower than what
standard Input-Output multipliers would estimate. This is because all inter-industry
purchases of surf businesses from other surf businesses are captured as part of the direct
activity of the industry. This demonstrates the strength of the significance assessment
approach compared to the traditional Input-Output multiplier approach, as it avoids double
13Economic Value of the Surf Industry to Surf Coast Shire
counting of transactions within the economy. For more details regarding economic
significance assessment compared to the standard Input-Output multiplier approach, see
Appendix D.
Table 3.2. Flow-On (Type I + Type II) Contribution of the Surf Industry to Surf Coast Shire’s
Economy by Industry, 2013
Industry Output Industry Incomes Employment
($M) Value ($M) (FTEs)
Added ($M)
Agriculture, forestry and fishing $3.5 $1.5 $0.3 19
Mining $1.4 $0.7 $0.2 1
Manufacturing $9.8 $2.0 $1.0 20
Electricity, gas, water and waste services $4.5 $2.0 $0.6 5
Construction $10.0 $2.8 $1.4 30
Wholesale trade $4.6 $2.3 $1.4 15
Retail trade $5.3 $3.1 $2.0 56
Accommodation and food services $7.2 $3.2 $1.8 56
Transport, postal and warehousing $4.0 $1.6 $0.9 19
Information media and telecommunications $5.2 $2.4 $0.9 12
Financial and insurance services $9.2 $6.7 $3.1 18
Rental, hiring and real estate services $11.1 $4.3 $1.9 26
Professional, scientific and technical services $15.5 $7.1 $4.4 66
Administrative and support services $8.6 $4.1 $3.2 50
Public administration and safety $1.4 $0.8 $0.6 8
Education and training $2.1 $1.6 $1.4 23
Health care and social assistance $2.7 $1.8 $1.5 27
Arts and recreation services $1.9 $0.7 $0.4 13
Other services $4.0 $2.1 $1.5 36
Ownership of dwellings $14.4 $11.0 $0.0 0
Total $126.3 $61.7 $28.7 502
Source: REMPLAN (2014), Department of Employment (2014), AEC.
3.2.3 Combined Economic Contribution of the Surf Industry
Combining both direct and flow-on activity, the surf industry is estimated to have supported
approximately one quarter of economic activity in Surf Coast Shire’s economy in 2013,
providing $217 million in industry value added activity (of a total $819.8 million across all
industries in Surf Coast Shire) and more than 2,000 FTE jobs (of a total of 7,561 FTE jobs
in Surf Coast Shire). A summary of the direct and flow-on contribution of the surf industry
to Surf Coast Shire’s economy is presented in Table 3.3.
Table 3.3. Total Contribution of the Surf Industry to Surf Coast Shire’s Economy, 2013
Contribution Output ($M) Industry Value Incomes ($M) Employment
Added ($M) (FTEs)
Contribution to Surf Coast Shire Economy
Direct $330.8 $155.3 $82.2 1,532
Production Induced (Type I) $79.2 $34.4 $18.7 306
Consumption Induced (Type II) $47.1 $27.4 $9.9 196
TOTAL CONTRIBUTION $457.2 $217.0 $110.9 2,034
TOTAL SURF COAST SHIRE $1,789.6 $819.8 $393.3 7,561
Percent Contribution to Surf Coast Shire Economy
Direct 18.5% 18.9% 20.9% 20.3%
Production Induced (Type I) 4.4% 4.2% 4.8% 4.0%
Consumption Induced (Type II) 2.6% 3.3% 2.5% 2.6%
TOTAL CONTRIBUTION 25.5% 26.5% 28.2% 26.9%
Source: REMPLAN (2014), Department of Employment (2014), AEC.
14Economic Value of the Surf Industry to Surf Coast Shire
A breakdown of the surf industry’s contribution to industry value added across standard
industry classifications (ANZSIC) is displayed in Figure 3.3, and shows the surf industry:
Contributes over $50 million to value added activity in Surf Coast Shire’s wholesale
trade industry and over $30 million to Surf Coast Shire’s retail trade industry, almost
exclusively through direct activity. This highlights the strong contribution the surf
industry makes to the local economy through distribution and sales of surf equipment
and services; and through sales to those visiting Surf Coast Shire to partake in surf
activities.
Contributes over $30 million to value added activity in Surf Coast Shire’s ownership of
dwellings sector and over $15 million to the accommodation and food services industry.
Contributions to both industries are primarily through direct activity, though a sizable
portion of the contribution to ownership of dwellings is also through type II flow-on
activity. This activity would reflect local employees engaged in the surf industry and its
supply chain (and their families) renting their homes.
Provides relatively more modest contributions to the industries of professional,
scientific and technical services (over $20 million) and manufacturing (over $15
million). The majority of this represents direct surf related activities of surf equipment
design and manufacture.
Figure 3.3. Direct & Flow-On Contribution of the Surf Industry to Surf Coast Shire Value
Added, 2013
Wholesale trade
Retail trade
Ownership of dwellings
Professional, scientific and technical services
Manufacturing
Accommodation and food services
Financial and insurance services
Rental, hiring and real estate services
Other services
Administrative and support services
Education and training
Health care and social assistance
Construction
Information media and telecommunications
Transport, postal and warehousing
Electricity, gas, water and waste services
Arts and recreation services
Direct
Agriculture, forestry and fishing
Type I
Public administration and safety
Type II
Mining
$0 $10 $20 $30 $40 $50 $60
Industry Value Added ($ Million)
Source: REMPLAN (2014), AEC.
Figure 3.4 shows that from an employment perspective, the surf industry:
Contributes over 950 FTE jobs in the industries of retail trade and wholesale trade
combined, again highlighting the significant contribution the distribution and sale of
surf equipment and services makes to Surf Coast Shire’s economy.
Supports more than 250 FTE jobs in the accommodation and food services industry,
around 200 of which are supported by direct surf industry activity.
Contributes over 350 FTE jobs in professional, scientific and technical services and
manufacturing, primarily through surf equipment design and manufacture.
Ownership of dwellings is effectively a non-employing sector of the economy, with only
three FTE jobs in Surf Coast Shire employed in the ownership of dwellings sector in 2013
in total. As such the sector records negligible employment contributed by the surf industry
15Economic Value of the Surf Industry to Surf Coast Shire
despite over $30 million in industry value added contributed directly and indirectly by surf
activities (see Figure 3.3).
Figure 3.4. Direct & Flow-On Contribution of the Surf Industry to Surf Coast Shire
Employment, 2013
Retail trade
Wholesale trade
Accommodation and food services
Professional, scientific and technical services
Manufacturing
Other services
Education and training
Administrative and support services
Health care and social assistance
Arts and recreation services
Rental, hiring and real estate services
Transport, postal and warehousing
Construction
Agriculture, forestry and fishing
Financial and insurance services
Information media and telecommunications
Public administration and safety
Direct
Electricity, gas, water and waste services
Type I
Mining
Type II
Ownership of dwellings
0 100 200 300 400 500 600 700
Employment (FTEs)
Source: REMPLAN (2014), Department of Employment (2014), AEC.
3.3 Local Sales & Exports
Surveying and consultation with local businesses identified where surf related goods and
services produced by businesses in Surf Coast Shire were typically sold.
Figure 3.5 shows distribution of sales from Surf Coast Shire’s surfing related goods and
services across the following locations – locally (within 40km of Surf Coast Shire),
regionally (within 40km and 100km of Surf Coast Shire), within the rest of Australia, or
overseas. In interpreting this figure, it should be noted most larger brands did not provide
responses suitable for inclusion in the analysis, including the two major surf brands in Surf
Coast Shire (Rip Curl and Quiksilver), and the results should therefore not be considered a
representation of sales for larger brands.
The figure shows that the vast majority of surfing related goods and services sold by
smaller surf businesses are sold locally (79.1%). Approximately 17.0% is sold elsewhere
in Australia (5.0% regionally between 40km-100km from Surf Coast Shire and the
remaining 12.0% throughout the rest of Australia) and 4.0% of goods and services are
sold overseas.
While a significant proportion of surfing related goods and services are sold locally, a large
proportion of these sales likely represent retail sales to tourists and other visitors that do
not live locally within Surf Coast Shire.
16You can also read