The Complexities of Physician Supply and Demand: Projections From 2018 to 2033 - June 2020 Prepared for the AAMC by IHS Markit Ltd.
←
→
Page content transcription
If your browser does not render page correctly, please read the page content below

The Complexities of Physician Supply and Demand:
Projections From 2018 to 2033

    The Complexities of
    Physician Supply and
    Demand: Projections From
    2018 to 2033

    June 2020
    Prepared for the AAMC by IHS Markit Ltd.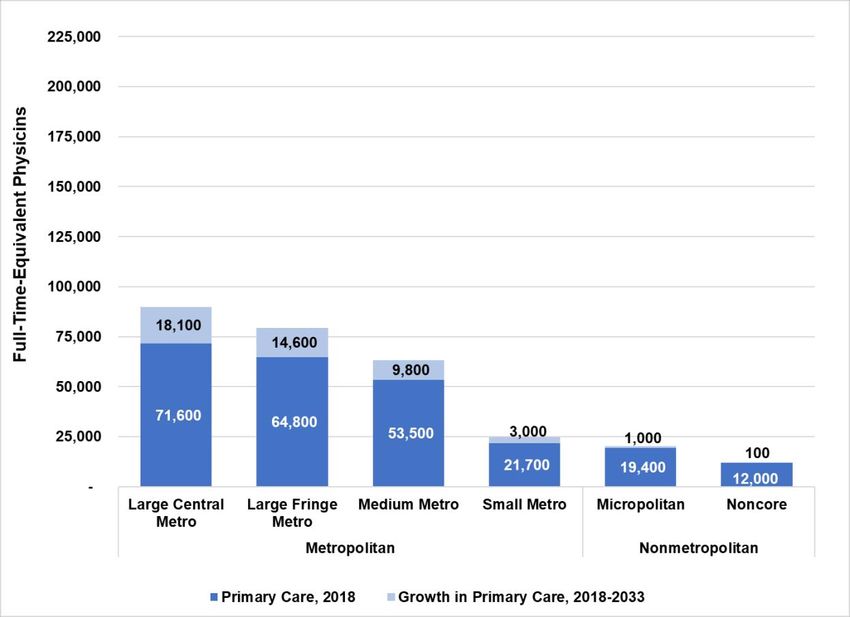
The Complexities of Physician Supply and Demand:
Projections From 2018 to 2033

    The Complexities of Physician Supply and Demand:
    Projections From 2018 to 2033

    June 2020
    Prepared for the AAMC by IHS Markit Ltd.

    Association of American Medical Colleges
    Washington, D.C.

i
                                                   Association of
                                                   American Medical Colleges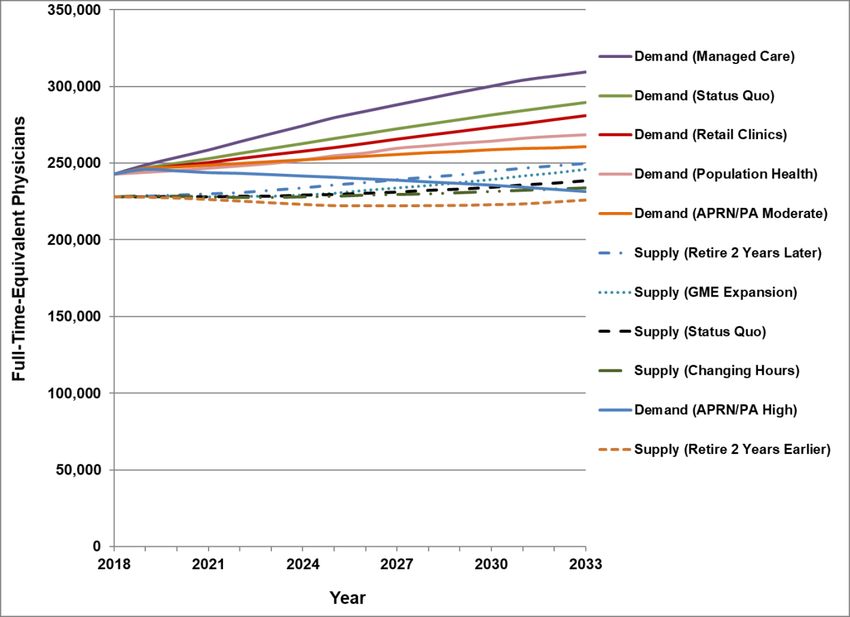
The Complexities of Physician Supply and Demand:
Projections From 2018 to 2033

This report was prepared for the AAMC by IHS Markit Ltd.:
Tim Dall, Executive Director
Ryan Reynolds, Senior Consultant
Ritashree Chakrabarti, PhD, Senior Consultant
Kari Jones, PhD, Director
Will Iacobucci, Senior Consultant

IHS Markit Ltd.
1300 Connecticut Ave., NW, Suite 800
Washington, DC 20036

© 2020 Association of American Medical Colleges. May be produced and distributed with attribution for
educational or noncommercial purposes only.

ii
                                                                                        Association of
                                                                                        American Medical Colleges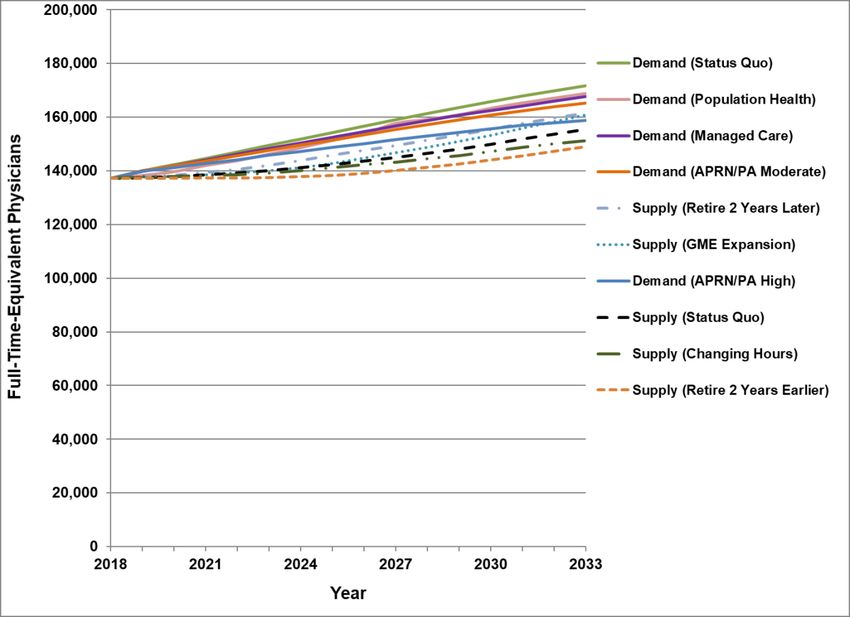
The Complexities of Physician Supply and Demand:
Projections From 2018 to 2033

CONTENTS
EXECUTIVE SUMMARY             vi
  Key Findings     vii
  Future Directions in Physician Workforce Research  viii
INTRODUCTION           1
UPDATED PROJECTIONS              3
  Total Physician Supply and Demand       4
  Primary Care Supply and Demand        5
  Non-Primary Care Supply and Demand         7
    Medical Specialties     7
    Surgical Specialties    9
    Primary-Care-Trained Hospitalists     11
    Other Specialties    13
SUPPLY MODELING           16
  Supply Modeling Inputs, Assumptions, and Scenarios    16
  Supply Projections     18
DEMAND MODELING            21
  Demand Modeling Inputs, Assumptions, and Scenarios      21
    Population Characteristics and Projections   21
    Demand for Health Care Services       22
    Patterns of Care Delivery      22
    Advanced Practice Registered Nurses and Physician Assistants    23
  Scenarios Modeled       26
  Demand Projections       29
    National Demand       29
    Demand by Population Demographics         32
EVOLVING CARE DELIVERY SYSTEM DEMAND IMPLICATIONS 35
GEOGRAPHIC DISTRIBUTION OF PHYSICIAN SUPPLY AND DEMAND                 41
  Physician Demand by Census Region         41
  Physician Demand by Urban-Rural Location       43
PROVIDERS REQUIRED IF U.S. ACHIEVED EQUITY IN HEALTH CARE UTILIZATION          46
CONCLUSIONS          49
FUTURE DIRECTIONS IN HEALTH WORKFORCE RESEARCH                   51
APPENDIX 1: DATA AND METHODS              53
  Synopsis of Study Methods        53
  Supply Model Overview and Updates        54
  Demand Model Overview and Updates          55
APPENDIX 2: ADDITIONAL TABLES AND CHARTS              57
NOTES      70
REFERENCES         71

iii
                                                                   Association of
                                                                   American Medical Colleges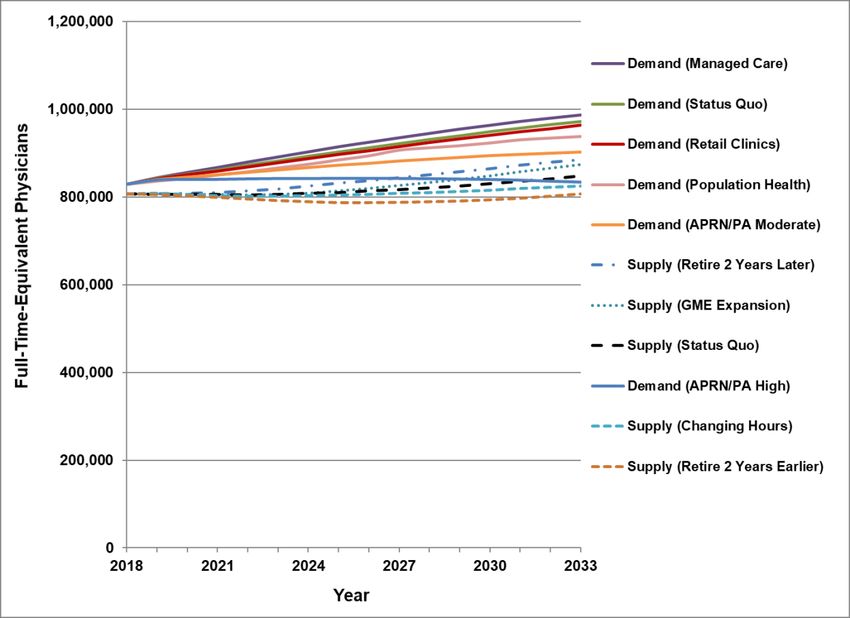
The Complexities of Physician Supply and Demand:
Projections From 2018 to 2033

EXHIBITS
Exhibit ES-1: Total Projected Physician Shortfall Range, 2018-2033     vi
Exhibit 1: Projected Physician Supply and Demand by Scenario, 2018-2033       4
Exhibit 2: Total Projected Physician Shortfall Range, 2018-2033     5
Exhibit 3: Projected Supply and Demand for Primary Care Physicians, 2018-2033       6
Exhibit 4: Projected Primary Care Physician Shortfall Range, 2018-2033      7
Exhibit 5: Projected Supply and Demand for Medical Specialist Physicians, 2018-2033       8
Exhibit 6: Projected Medical Specialist Physician Shortfall Range, 2018-2033    9
Exhibit 7: Projected Supply and Demand for Surgeons, 2018-2033        10
Exhibit 8: Projected Surgeon Shortfall Range, 2018-2033        11
Exhibit 9: Projected Supply and Demand for Primary-Care-Trained Hospitalists, 2018-2033 12
Exhibit 10: Projected Primary-Care-Trained Hospitalists Shortfall Range, 2018-2033     13
Exhibit 11: Projected Supply and Demand for Other Specialties, 2018-2033      14
Exhibit 12: Projected Other Specialist Physician Shortfall Range, 2018-2033    15
Exhibit 13: Projected Supply of Physicians, 2018-2033       18
Exhibit 14: Projected Change in Physician Supply: 2020 vs. 2019 Report Projections     19
Exhibit 15: Projected Change in Physician Supply by Specialty Category, 2018-2033      20
Exhibit 16: Physician Demand Under Alternative Scenarios of the Degree to Which
   Advanced Practice Registered Nurses and Physician Assistants Reduce Demand
   for Physicians, 2018-2033       26
Exhibit 17: Projected Demand for Physicians, 2018-2033        30
Exhibit 18: Projected Change in Physician Demand: 2020 vs. 2019 Report Projections       31
Exhibit 19: Proportion of Physician Demand by Population Aged 65+, 2018 and 2033       32
Exhibit 20: Projected Physician Demand Growth by Patient Race and Ethnicity, 2018-2033 33
Exhibit 21: Physician Demand Implications of Evolving Care Delivery System Components
   by 2033       38
Exhibit 22: Projected Growth in Physician Demand Under Status Quo and Evolving Care
   Delivery System Scenarios, 2018-2033         39
Exhibit 23: Evolving Care Delivery System Scenario Demand Projections, 2018-2033        40
Exhibit 24: Physician Primary Care Demand and Demand Growth by Census Region,
   2018-2033        42
Exhibit 25: Physician Non-Primary Care Demand and Demand Growth by Census Region,
   2018-2033        43
Exhibit 26: Physician Primary Care Demand and Demand Growth by Metropolitan Designation,
   2018-2033        44
Exhibit 27: Physician Non-Primary Care Demand and Demand Growth by Metropolitan
   Designation, 2018-2033        45
Exhibit 28: Current Use of FTE Physician Services per 100,000 Population by Patient Race and
   Ethnicity, 2018     47
Exhibit 29: Health Care Utilization Equity Scenario 1, 2018     48
Exhibit 30: Health Care Utilization Equity Scenario 2, 2018     48
Exhibit 31: Summary of Demand Modeling Data Sources           56
Exhibit 32: Projected Physician Demand by Patient Race and Ethnicity, 2018-2033       57
Exhibit 33: Projected Physician Demand by Census Region, 2018-2033         58
Exhibit 34: Projected Physician Demand by Urban-Rural Location, 2018-2033        59
Exhibit 35: Summary of Projected Gap Between Physician Supply and Demand, 2018-2033 60

iv
                                                                              Association of
                                                                              American Medical Colleges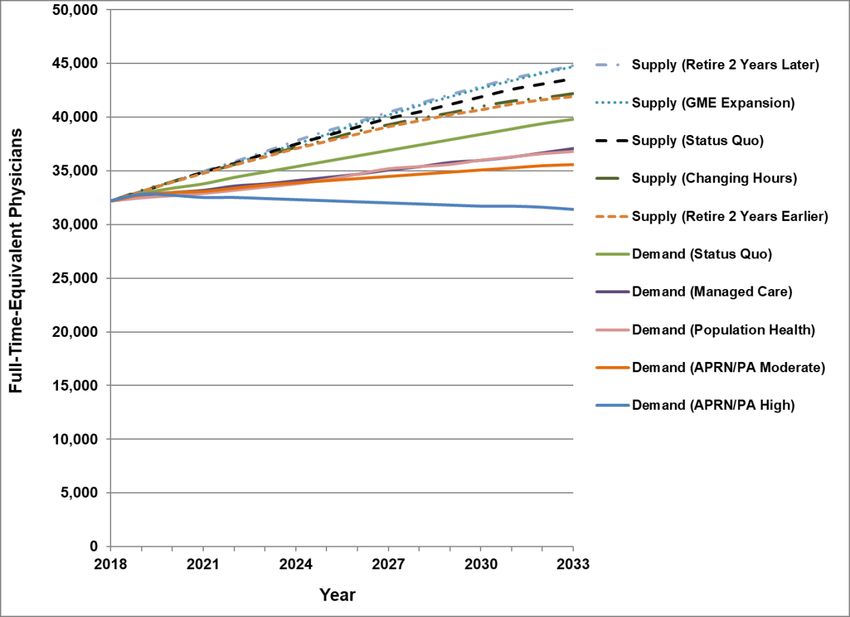
The Complexities of Physician Supply and Demand:
Projections From 2018 to 2033

Exhibit 36: Projected Physician Supply, 2018-2033     61
Exhibit 37: Physician Supply Projection Summary by Specialty Category, 2018-2033          62
Exhibit 38: Projected Physician Demand by Scenarios Modeled, 2018-2033         63
Exhibit 39: Additional Physicians Required to Achieve Health Care Utilization Equity in 2018 by
   Specialty Category      64
Exhibit 40: Additional Physicians Required to Achieve Health Care Utilization Equity in 2018
   by Patient Race/Ethnicity     65
Exhibit 41: Additional Physicians Required to Achieve Health Care Utilization Equity in 2018
   by Region       66
Exhibit 42: Physician Demand by Health Care Utilization Equity Scenario and Region in 2018 67
Exhibit 43: Additional Physicians Required to Achieve Health Care Utilization Equity in 2018
   by Urban/Rural Area       68
Exhibit 44: Physician Demand by Health Care Utilization Equity Scenario and Urban/Rural Area
   in 2018     69

v
                                                                                 Association of
                                                                                 American Medical Colleges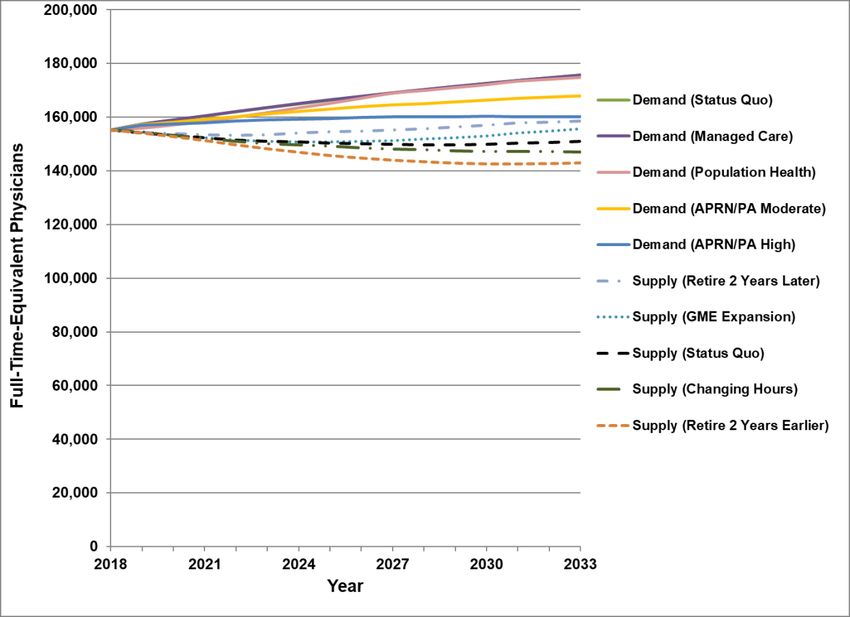
The Complexities of Physician Supply and Demand:
Projections From 2018 to 2033

EXECUTIVE SUMMARY
Assessing the capacity of the nation’s future physician workforce to meet expected demand provides
critical information to both the public and the private sectors. The pace of change in health care coupled
with the lead time required to train new physicians necessitates continuously updating and improving
workforce projections. For these reasons, since 2015, the AAMC has commissioned annual reports of
national physician workforce projections prepared by independent experts. The purpose of these
updates is threefold:

     •   Update and improve workforce projections: The AAMC is committed to supporting ongoing
         efforts to use the most recent and best-quality data to update projections and to respond to
         constructive feedback received about previous projections.

     •   Present new analyses: The reports present new and updated research on the physician
         workforce and the implications of important issues such as the evolving health care system, the
         changing demographic composition of the workforce, and changing hours-worked and
         retirement patterns.

     •   Identify future directions for research: The process of modeling future supply and demand
         for physicians helps identify areas for future research, data collection, and analysis that will
         strengthen future projections and support decision-making to help align the nation’s physician
         workforce with its health care needs.

This 2020 update was prepared before the COVID-19 crisis, so although it does not include any specific
information or scenarios based on that crisis, it does include some lessons learned from the pandemic
and critical shortages of health workers. Future editions will look at this topic more explicitly.

This report uses a modeling approach and data sources similar to those in previous reports. As in the
past, this update projects future physician supply by considering trends in key physician supply
determinants and the sensitivity of supply projections to changes in these determinants. The demand
projections reflect changing demographics as the population grows and ages, the rapidly growing
supply of advanced practice registered nurses (APRNs) and physician assistants (PAs), and other
important trends in health care such as a growing emphasis on achieving population health goals.
Because it is impossible to predict with certainty the degree to which any scenario will transpire, the
projected shortages are presented as a range under the most likely scenarios rather than as a single
number.

This year, we updated the workforce projections with new physician work-hours and retirement-
intentions data from the AAMC 2019 National Sample Survey of Physicians (NSSP). Survey findings
suggest that physicians intend to retire earlier than was assumed in previous supply projections.
Consequently, projected future physician supply is lower than in past reports. This update extrapolates
a 2018 level of care delivery to 2033 to project future demand under the Status Quo Scenario, whereas
the previous report extrapolated a 2017 level of care delivery to 2032. The update also reflects the
federal Health Resources and Services Administration’s upward revision of the number of additional
physicians required to remove Health Professional Shortage Area (HPSA) designations for primary care
and mental health specialties; this information is used as a conservative proxy for national gaps
between supply and demand in 2018.

Study findings offer stakeholders insights into changes expected in the physician workforce by 2033. All
supply and demand projections are reported as full-time-equivalent (FTE) physicians, where an FTE is

vi
                                                                                             Association of
                                                                                             American Medical Colleges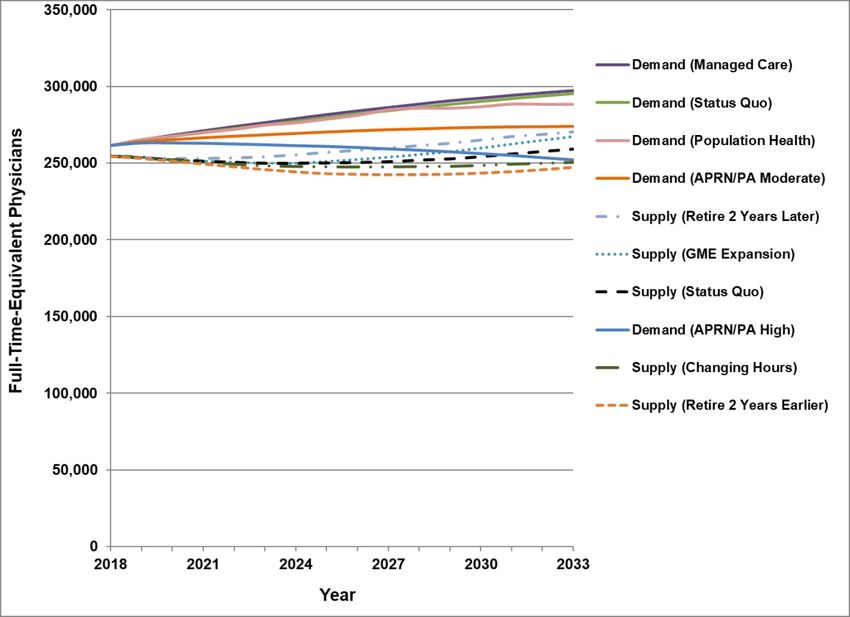
The Complexities of Physician Supply and Demand:
Projections From 2018 to 2033

defined for each specialty category as the average weekly patient-care hours for that specialty category.
The projections include all active physicians who have completed their graduate medical education.

Key Findings
•     We continue to project that physician demand will grow faster than supply, leading to a
      projected total physician shortage of between 54,100 and 139,000 physicians by 2033 (Exhibit
      ES-1). This projected shortage range reflects updates to model inputs, including updated estimates of
      physicians’ hours-worked patterns and retirement intentions and larger starting-year shortage
      estimates based on recently revised federal Health Professional Shortage Area (HPSA) designations
      for primary care and mental health.
                                                           By 2033, we project:
           o A primary care physician shortage of
              between 21,400 and 55,200 is                     ✓ A shortage of primary care
              projected by 2033.                                   physicians of between 21,400
           o A shortage of non-primary care                        and 55,200.
              specialty physicians of between                   ✓   A shortage across the non-
              33,700 and 86,700 is projected by                     primary care specialties of
              2033, including:                                      between 33,700 and 86,700
                  ▪   Between 17,100 and 28,700 for                 physicians.
                      Surgical Specialties.
                  ▪   Between 9,300 and 17,800 for Medical Specialties.
                  ▪   Between 17,100 and 41,900 for the Other Specialties category.

•     Demographics — specifically, population growth and aging — continue to be the primary driver
      of increasing demand from 2018 to 2033. During this period, the U.S. population is projected to grow
      by 10.4%, from about 327 million to 361 million. The population under age 18 is projected to grow by
      only 3.9%, which portends low growth in demand for pediatric specialties, while the population aged
      65 and over is projected to grow by 45.1%, which portends high growth in demand for physician
      specialties that predominantly care for older Americans.

•     A large portion of the physician workforce is nearing traditional retirement age, and supply
      projections are sensitive to workforce decisions of older physicians. More than two of five
      currently active physicians will be 65 or older within the next decade. Shifts in retirement patterns
      over that time could have large implications for physician supply. Growing concerns about physician
      burnout, documented in the literature, suggest physicians will be more likely to accelerate than delay
      retirement. On the other hand, economic uncertainty and any detrimental effect on physician wealth
      could contribute to delaying retirement.

•     If underserved populations had health care use patterns like populations with fewer access
      barriers, demand could rise by an additional 74,100 to 145,500 physicians. Improved access to
      care is a national goal. We updated two hypothetical Health Care Utilization Equity Scenarios around
      the effects of removing access barriers. This analysis underscores the systematic differences in
      annual use of health care services by insured-uninsured status, urban-rural location, and race and
      ethnicity. These estimates, which are excluded from the shortage-projection ranges, help illuminate
      the magnitude of current barriers to care and provide an additional reference point when gauging the
      adequacy of the physician workforce to achieve national goals.

vii
                                                                                             Association of
                                                                                             American Medical Colleges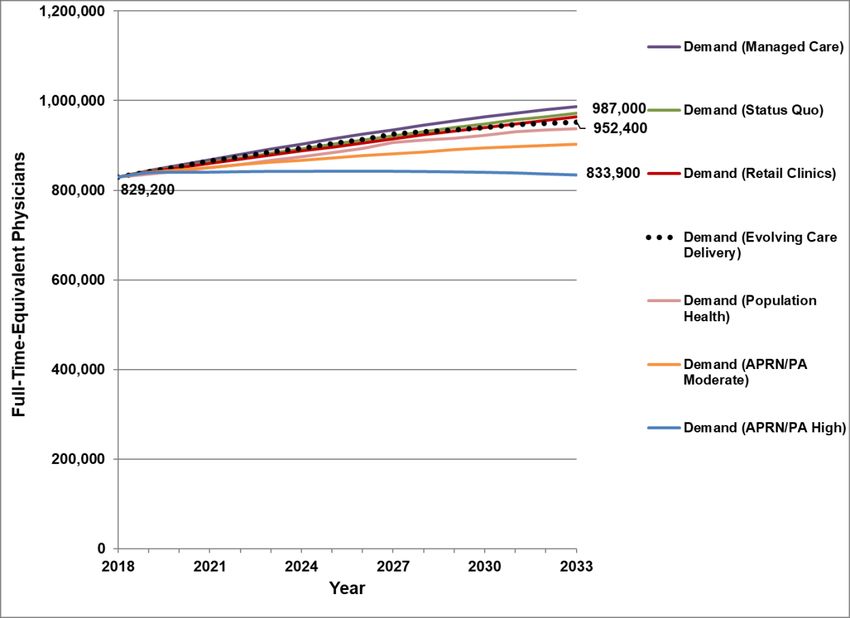
The Complexities of Physician Supply and Demand:
Projections From 2018 to 2033

Exhibit ES-1: Total Projected Physician Shortfall Range, 2018-2033

Note: Because complex systems have internal checks and balances to avoid extremes, the upper and lower
bounds of the shortage projections reflect the range of most likely outcomes. The divergence over time represents
increasing uncertainty.

Future Directions in Physician Workforce Research
An ever-present challenge in making these workforce projections is the rapid pace of change in the health
care system and the dearth of data available to quantify these changes. We have identified specific areas
where additional data and research could improve health care workforce projections:

•      APRNs, PAs, and hospitalists ― rapid growth, market saturation, and services needed: This
       report explores the potential implications of continued rapid growth in the APRN and PA supply, and
       more information is needed. To what extent can the health care system continue to absorb this new
       supply of health care professionals? What are the implications of this supply on the demand for
       physicians? To what extent have APRNs and PAs reduced demand for physicians in some
       specialties, and to what extent are APRNs and PAs providing previously unfilled services and
       expanding access to care?

       Published research suggests that patients in primary care settings receive only 55% of
       recommended chronic and preventive services from their physicians — with perhaps much of the

viii
                                                                                                   Association of
                                                                                                   American Medical Colleges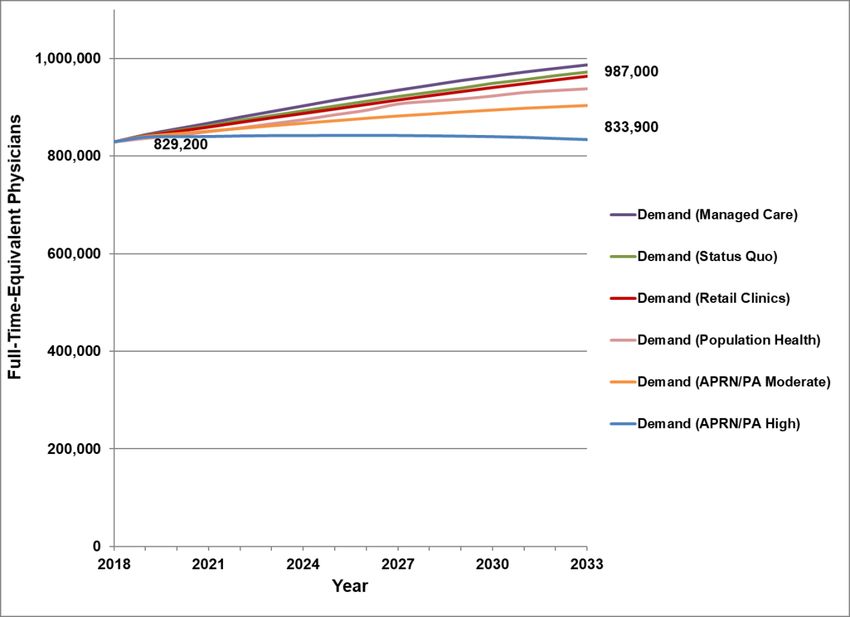
The Complexities of Physician Supply and Demand:
Projections From 2018 to 2033

     gap between services provided and services recommended attributed to the time constraints that
     physicians face when meeting with patients. To what extent do APRNs and PAs partially substitute
     for physicians in providing the 55% of recommended services being provided, and to what extent
     will the increased supply of APRNs and PAs help deliver the 45% of recommended services not
     currently being provided? The hospitalist supply also continues to grow rapidly. Might market
     saturation be reached for hospitalists, and, if it does, at what point would employment growth slow
     to a level that matches growth trends in hospital inpatient care?

     We have brought new data to bear on these issues in this report, but fully addressing the above
     questions to inform workforce modeling requires input from physicians, APRNs, and PAs, as well as
     the health systems that employ these providers. To help inform the modeling of the interprofessional
     effects of future workforce supply and the demand for other professions, a panel of physicians,
     APRNs, and PAs should be convened to compile an inventory of the data and research still needed
     to estimate the necessary model parameters and test the modeling assumptions currently in use.
     Such a panel should produce guidance on the specific research and data collection needed to
     assess (1) what proportion of APRN and PA time is for performing activities that physicians also
     provide and how that varies (e.g., by specialty and setting), (2) what proportion of APRN and PA
     time is spent in activities that complement physician efforts and expands the comprehensiveness of
     services provided to patients (e.g., conducting follow-up visits or providing care that otherwise would
     not have been provided to patients), and (3) what proportion of APRN and PA time is spent
     providing care to people who otherwise would not have received services (e.g., services provided in
     retail clinics or health clinics for patients who otherwise would not have sought physician services).
     We also need data and research on the labor market for hospitalists trained as primary care
     physicians to better understand and model their evolving role in hospital-based care delivery.

•    Current shortages and inefficiencies: The demand projections start with the assumption that
     physician supply and demand are in equilibrium in 2018 — except for primary care and psychiatry,
     where federal government estimates for Health Professional Shortage Areas are used as a
     conservative proxy for the current shortage of physicians. How might we better measure current
     shortages in other specialties? To the extent that current national shortages (or surpluses) exist for
     other specialties, the projections underestimate (or overestimate) demand from 2018 to 2033 by
     roughly the size of the current national imbalance between supply and demand. This raises
     questions about how best to quantify current imbalances between supply and demand across
     specialties.

•    Priority issues in the physician workforce: Along with the work needed to inform physician
     workforce projections, research is needed on topics of critical importance to physicians, their
     employers, and physician workforce planners, including the covariates of physician burnout,
     improving workforce diversity, the impact of medical education debt, the factors that drive decisions
     about where physicians practice, the role and impact of telehealth on physician practice, and
     physicians’ experiences of harassment and discrimination.

•    COVID-19 impact: The COVID-19 pandemic is likely to have short- and long-term consequences
     on the nation’s physician workforce, including educational pipeline issues (e.g., interruption of
     education, cancellation of clinical rotations, changes in curriculum), regulatory issues (e.g., changes
     in licensure and reimbursement), how medicine is practiced (e.g., uptake of telehealth, small private
     practices being hit hard economically), workforce exits (due to death from COVID-19, early burnout-
     induced retirement or postponed retirement due to the economy), specialty mix (interest in some
     specialties, like infectious disease, may increase while interest in others, like emergency medicine,
     may decrease), and demand shifts (e.g., scope-of-practice changes for other professions, changes
     in demand due to delayed care, sudden need for critical care for COVID-19 cases, longer-term
     demand decreases due to COVID-19 deaths).

ix
                                                                                              Association of
                                                                                              American Medical Colleges
The Complexities of Physician Supply and Demand:
Projections From 2018 to 2033
INTRODUCTION
Since 2015, the AAMC has published annual reports projecting future supply and demand for
physicians. These studies build on earlier work published by the AAMC dating back to 2008.The primary
purpose of these studies is to inform policies and strategies that help ensure the United States trains a
sufficient number and specialty mix of physicians to further national goals of increased access to high-
quality and affordable care. These studies also further discussion of unequal access to health care
services and advance the field of health workforce research.
The title of this report, “Complexities of Physician Supply and Demand Modeling,” reflects the data
challenges and uncertainties of projecting future workforce supply and demand. There continue to be
rapid growth in the supply of advanced practice registered nurses (APRNs) and physician assistants
(PAs) and improved understanding of their value in care delivery and helping improve access to care for
underserved populations.1-3 The health workforce continues to age, and there is growing concern about
provider burnout.4-9 Efforts continue to improve health care delivery and control rising medical costs
through alternative payment models such as accountable care organizations (ACOs) and value-based
reimbursement; through alternative ways to deliver care such as team-based care, integrated care,
patient-centered care, and telemedicine; and through efforts to encourage preventive care and improve
population health.10-14 There continue to be advances in medicine, medical equipment, and information
technology that expand and improve prevention and treatment options, allow for faster and more
accurate clinical diagnosis, and provide patients and clinicians with more data to inform their
decisions.15 Against this backdrop is a U.S. population that is growing, aging, and becoming more
racially and ethnically diverse.
Mindful of the magnitude and speed of these changes, the AAMC contracted with IHS Markit to update
physician workforce projections by incorporating the latest available data on trends and factors affecting
physician supply and demand. Given the lead time required to adjust the nation’s training capacity and
train new physicians, projecting future adequacy of physician supply is essential. As with last year’s
report and other similar workforce reports, this study models a 15-year time horizon, 2018 to 2033.
This update continues to reflect the AAMC’s commitment to regularly update projections and to refine
scenarios that reflect the best available evidence on trends in health care delivery and the physician
workforce. Key trends likely to affect the supply of and demand for health care services were identified
and modeled under multiple supply and demand scenarios. Projections for individual specialties were
aggregated into five broad categories for reporting, consistent with specialty groupings designated by
the American Medical Association (AMA): Primary Care, Medical Specialties, Surgical Specialties, and
Other Specialties, with Primary-Care-Trained Hospitalists reported as a fifth category to avoid
confounding the Primary Care projections.
Each year, the updated demand projections shift to reflect new levels of care use. For example, data
inputs and demand projections in the 2019 report extrapolated a “2017 national average” level of care,16
while this 2020 report extrapolates a “2018 national average” level of care. The latest available data at
the time this study was conducted were from 2018. The Status Quo Scenarios for demand and supply
extrapolate current care-use and care-delivery patterns to future populations, while alternative scenarios
model different assumptions about ongoing and future trends in care delivery. The alternative supply
and demand scenarios form the basis of the projection ranges for supply and demand.
The supply projections use new data on physician hours worked and retirement intentions collected as
part of the AAMC 2019 National Sample Survey of Physicians (NSSP). The AAMC contracted with
Toluna, an external firm that recruited active physicians from their own and their partners’ proprietary
panels of health care professionals, to conduct the survey. NSSP contains data on a broad array of
factors, including demographics, academic affiliations, continuing medical education, detailed work time
and allocation, retirement plans, practice characteristics, well-being, and medical education debt. The
1
Association of
American Medical CollegesThe Complexities of Physician Supply and Demand:
Projections From 2018 to 2033
survey started on Feb. 25, 2019, and closed once the desired quota of 6,000 participants (n = 6,000)
was reached on March 25, 2019. The sample was stratified by specialty group, gender, and age group.
The data were weighted to be representative of all practicing physicians in the United States in terms of
specialty group, gender, age group, and international medical graduate (IMG) status using data from the
2018 AMA Physician Masterfile. The sampling error for the survey was +/-1.3% at a 95% confidence
level using a point estimate of 50%. Analysis of the 2019 NSSP data compared with the data used
previously to model physician supply found (1) physician weekly hours worked are lower, but patterns in
differences in weekly hours worked by physician age, sex, and specialty are similar, and (2) physicians
plan to retire earlier than we estimated using older data.
The remainder of this update is organized similarly to past reports, presenting the comparison of
updated physician supply and demand projections and describing the supply and demand scenarios
and results. Updates to the Health Care Utilization Equity and Evolving Care Delivery System Scenarios
are provided, along with more in-depth modeling of geographic variation in physician supply and
demand. The final sections highlight key findings and conclusions and possible future directions in the
field of health workforce research. Appendix 1 presents additional detail about modeling data and
methods, and Appendix 2 contains additional tables and charts.
2
Association of
American Medical CollegesThe Complexities of Physician Supply and Demand:
Projections From 2018 to 2033
UPDATED PROJECTIONS
Demand continues to exceed supply, leading to a projected shortage of between 54,100 and 139,000
physicians by 2033 — higher than the previous projected shortage range for 2032 of between 46,900
and 121,900 physicians (2019 report).16 The update reflects the following:
1. The demand projections have been recalibrated to reflect a 2018 level of care (rather than a 2017
level of care) using updated data on population demographics, disease prevalence, and health risk
factors, as well as newer data on health care use and delivery patterns.
2. The federal government estimates an additional 14,900 primary care physicians and 6,894
psychiatrists were required in 2018 to provide a level of care that will remove the Health
Professional Shortage Area (HPSA) designation for areas with primary care and mental health
shortages. The designation is used as a conservative proxy for the current national shortage of
physicians. These numbers are higher than estimates used in the previous report, indicating the
government’s recognition of growing shortages.
3. Supply projections for physicians, advanced practice registered nurses (APRNs), and physician
assistants (PAs) have been updated using more recent data on the demographics and specialty mix
of current supply, hours-worked patterns, and the characteristics and specialty mix of new
graduates. This includes new survey data from the AAMC 2019 National Sample Survey of
Physicians (NSSP), the Health Resources and Services Administration 2018 National Sample
Survey of Registered Nurses (NSSRN), which collected workforce data on APRNs, and newly
published data from the National Commission on Certification of Physician Assistants (NCCPA).
The higher shortage projections in this year’s report result mainly from updated data about
physicians’ retirement intentions, which indicate physicians are likely to retire at earlier ages than
older data suggested.
The modeled scenarios used to calculate the shortage range remain the same as in last year’s report.
The updated Primary Care physician shortage range for 2033 is between 21,400 and 55,200, which is
similar to the range in last year’s report. The projected 2033 shortage ranges for non-primary care
physicians are between 17,100 and 28,700 for Surgical Specialties; between 17,100 and 41,900 for
Other Specialties; and between 9,300 and 17,800 for Medical Specialties.a If the annual number of
primary-care-trained physicians becoming hospitalists (Primary-Care-Trained Hospitalists) remains
similar over time, then by 2033, general hospitalist supply will be between about 3,800 and 8,000 higher
than current demand scenarios expect. If the nation reaches saturation in the supply of hospitalists,
physicians who might otherwise choose to become hospitalists might choose other specialties.
The supply and demand scenarios used to calculate the shortage ranges reflect the uncertainty,
complexity, and evolving nature of the environment within which physicians practice. One scenario
alone is inadequate to convey the associated uncertainty. We examined four scenarios with different
assumptions about key physician supply determinants and six scenarios with different assumptions
about key physician-demand determinants. We compared each supply scenario with each demand
scenario to generate 24 sets of projections of future adequacy of supply for physicians overall and for
each specialty category. The extreme high and low scenarios are least likely to occur since multiple
factors tend to mitigate highs and lows. For example, if physicians were to begin retiring earlier, the
growing systemic stresses this could cause due to the growing shortage of physicians (including rising
wages) might eventually lead some physicians to delay retirement. Given the propensity of such
systems-level “checks and balances” to avoid extremes, we exclude the highest and lowest supply-
adequacy projection quartiles and use the middle two quartiles to indicate a likely range. The ranges
presented throughout this report thus represent the middle-most combinations of the supply and
demand scenarios described in the “Supply Modeling” and “Demand Modeling” sections of the report.
The growing divergence over time of the highest and lowest projections we present can, then, be
interpreted as an increase in uncertainty as we project further and further out into the future.
3
Association of
American Medical CollegesThe Complexities of Physician Supply and Demand:
Projections From 2018 to 2033
The updated projections model 28,980 newly trained physicians entering the workforce each year and
continued growth in the number of APRNs and PAs entering the workforce. The starting supply of
physicians comes from analysis of the 2018 American Medical Association Physician Masterfile. The
updated demand projections reflect new data from the 2017 Medical Expenditure Panel Survey on
health care use patterns (using 2013-2017 data) and updated data on population characteristics and
prevalence of health risk factors from the 2018 American Community Survey and the 2018 Behavioral
Risk Factor Surveillance System. The most recent state and national population projections are used.
The U.S. Census Bureau estimates the U.S. population was 327.2 million in 2018 and will grow to
361.1 million by 2033.17 Of the estimated 33.9 million growth in the population, 23.6 million (70%) is
growth in the number of people age 65 or older.
Total Physician Supply and Demand
Under most scenarios projected, the total projected demand for physicians exceeds the total projected
supply (Exhibit 1). Looking at the 25th-to-75th-percentile projections for total physicians, demand will
continue to grow faster than supply, leading to a projected shortage of between 54,100 and 139,000
physicians by 2033 (Exhibit 2).
Exhibit 1: Projected Physician Supply and Demand by Scenario, 2018-2033
4
Association of
American Medical CollegesThe Complexities of Physician Supply and Demand:
Projections From 2018 to 2033
Exhibit 2: Total Projected Physician Shortfall Range, 2018-2033
Primary Care Supply and Demand
Comparison of projected supply and demand for Primary Care physicians (Exhibit 3) predicts a shortage
by 2033 of between 21,400 and 55,200 physicians (Exhibit 4). This shortage range for 2033 is almost
identical to the 2019 shortage projection, between 21,100 and 55,200 Primary Care physicians by
2032.16
The updated projections use higher estimates of the annual number of new Primary Care physicians
entering the workforce than were used last year: 8,366 compared with 7,420. Much of this increase is
attributed to lower estimates of the number of physicians trained in primary care who become
hospitalists each year, based on an AAMC analysis of Medicare billing records, and lower estimates of
the number of physicians trained in primary care who subspecialize, based on our analysis of AMA
Physician Masterfile data. Offsetting this increase in the number of newly trained Primary Care
physicians is the increase in the number of physicians planning to retire earlier than previously modeled,
according to analyses based on 2019 NSSP data. This finding is consistent with reports of higher levels
of burnout among the primary care workforce and a robust economy that bolstered retirement funds.18-20
The estimated shortage of about 14,900 Primary Care physicians in 2018 is based on the calculation
from the Health Resources and Services Administration (HRSA) that about this number of primary care
providers are needed to remove the primary-care-shortage designation in currently designated shortage
areas.
5 Association of
American Medical CollegesThe Complexities of Physician Supply and Demand:
Projections From 2018 to 2033
Each modeled supply and demand scenario is based on assumptions about the continuation of current
trends or changes in care delivery that might happen at a future date, so each scenario has a degree of
uncertainty. The projected shortage range widens over time, reflecting (1) that some trends have a
compounding effect (such as annually training more APRNs and PAs) and (2) greater uncertainty in
supply and demand determinants as we move further into the future. As illustrated in Exhibit 3,
projected demand exceeds supply under all scenarios modeled except the one that assumed the
highest number of APRNs and PAs in primary care. This APRN/PA High demand scenario assumes
(1) that the number of new APRNs and PAs trained each year will continue growing at high rates and
the proportion of new entrants choosing primary care will remain at recent levels and (2) that APRNs
and PAs will offset demand for physicians at the rates discussed later in this report. Despite large
increases over the past decade in the number of APRNs and PAs entering primary care, as well as a
large number of primary care physicians trained annually, the demand for primary care providers
remains strong. The rate of growth in training APRNs and PAs cannot be sustained indefinitely, but at
what level the nation will reach market saturation is unknown.21-24
Exhibit 3: Projected Supply and Demand for Primary Care Physicians, 2018-2033
6
Association of
American Medical CollegesThe Complexities of Physician Supply and Demand:
Projections From 2018 to 2033
Exhibit 4: Projected Primary Care Physician Shortfall Range, 2018-2033
Non-Primary Care Supply and Demand
Exhibits 5 through 10 depict the overall range of supply and demand growth and projected shortage
ranges for non-primary care physicians by specialty category. Under the scenarios modeled, we project
a shortage of between 33,700 and 85,200 non-primary care physicians by 2033. Non-primary care
specialties are grouped into four categories: Medical Specialties, Surgical Specialties, Primary-Care-
Trained Hospitalists, and Other Specialties.
Medical Specialties
The demand for physicians in internal medicine subspecialties is growing rapidly due to population
growth and aging, with slower growth in demand for pediatric subspecialties. However, supply is also
growing rapidly in these specialties (Exhibit 5). Under the scenarios modeled, this update projects a
shortage range of between 9,300 and 17,800 FTEs by 2033 (Exhibit 6), higher than the range of
between 5,400 and 13,400 for 2032 projected in the previous report. The main contributor to the higher
shortage projections is the updated estimate of physicians planning to retire earlier than previously
modeled.
7
Association of
American Medical CollegesThe Complexities of Physician Supply and Demand:
Projections From 2018 to 2033
Exhibit 5: Projected Supply and Demand for Medical Specialist Physicians,
2018-2033
8
Association of
American Medical CollegesThe Complexities of Physician Supply and Demand:
Projections From 2018 to 2033
Exhibit 6: Projected Medical Specialist Physician Shortfall Range, 2018-2033
Surgical Specialties
Based on current trends, the supply of surgeons is not projected to change substantially over the next
15 years as future attrition offsets the number of newly trained surgeons. Demand continues to grow,
with projected demand exceeding projected supply under all scenarios modeled (Exhibit 7). The
projected shortage for 2033 is between 17,100 and 28,700 surgeons (Exhibit 8); it was between 14,300
and 23,400 by 2032. The 2018 higher shortage estimates result mainly from the updated retirement
rates, which suggest lower future supply than previously reported.
9
Association of
American Medical CollegesThe Complexities of Physician Supply and Demand:
Projections From 2018 to 2033
Exhibit 7: Projected Supply and Demand for Surgeons, 2018-2033
10
Association of
American Medical CollegesThe Complexities of Physician Supply and Demand:
Projections From 2018 to 2033
Exhibit 8: Projected Surgeon Shortfall Range, 2018-2033
Primary-Care-Trained Hospitalists
Primary-Care-Trained Hospitalists are analyzed separately from the Primary Care category. The
number of physicians working as hospitalists over the past decade has grown rapidly,25 reflecting a shift
in how care is provided rather than in a growing demand for hospital inpatient services (which has
declined over this same period26). Analysis of billing records by the AAMC identified physicians with at
least 90% of their revenue billed through hospitals as physicians likely practicing as hospitalists.
Analysis of billing records over multiple years suggests that the number of physicians becoming new
hospitalists decreased for the first time: from 1,831 in our 2019 report to 1,221 in this year’s analysis.
The estimated number of new physicians becoming hospitalists has varied from year to year, so
whether this drop of 610 new hospitalists entering the workforce is the beginning of a trend or simply a
return to historical levels is unknown. Supply projections suggest that at current rates of physicians
becoming hospitalists, there would be more than required to meet projected demand for services
(Exhibit 9), with supply by 2033 between 4,600 and 8,000 higher than the level required to meet the
growing demand for Hospitalist services (Exhibit 10).
Having more hospitalists reduces the amount of time required for primary care physicians to do hospital
rounds, freeing them up to see more patients in ambulatory settings. The increase in the productivity of
primary care physicians might not offset the loss of primary care providers to the hospitalist workforce,
however.27,28 Hospitals will not hire more hospitalists than are needed, so, as with many relatively young
professions, a shift has been taking place that is not being captured by the assumptions in our model.
11
Association of
American Medical CollegesThe Complexities of Physician Supply and Demand:
Projections From 2018 to 2033
The rapid growth in hospitalist supply over the past two decades has been facilitated by (1) financial
considerations that increased the willingness of primary care physicians to turn inpatient care over to
hospitalists, (2) new duty-hour limits for residents, which reduced their availability to oversee patients in
hospitals, (3) the widespread implementation of electronic health records and hospitals’ focus on quality
and patient safety, and (4) the availability of newly trained generalists trained in hospital settings.25 It is
unclear whether this surge in the growth of hospitalist employment will continue or the nation will reach
saturation ― at which point, hospitalist demand will change at roughly the same rate as demand for
inpatient services. Likewise, if saturation is reached, it is unclear whether physicians who might
otherwise choose to become hospitalists will choose other specialties or other settings.
Exhibit 9: Projected Supply and Demand for Primary-Care-Trained Hospitalists,
2018-2033
12
Association of
American Medical CollegesThe Complexities of Physician Supply and Demand:
Projections From 2018 to 2033
Exhibit 10: Projected Primary-Care-Trained Hospitalists Shortfall Range,
2018-2033
Other Specialties
For the Other Specialties category,b projected demand exceeds supply for all but one scenario
(Exhibit 11). The projected shortage range for 2033 is between 17,100 and 41,900 physicians
(Exhibit 12), similar to last year’s shortage range by 2032 of between 20,600 and 39,100 physicians.
The lower bound of the shortage range starts to decline around 2027. This decline is attributed mainly to
the large number of nurse anesthetists and psychiatric nurse practitioners being trained, which has
implications for the demand for anesthesiologists and psychiatrists.
13
Association of
American Medical CollegesThe Complexities of Physician Supply and Demand:
Projections From 2018 to 2033
Exhibit 11: Projected Supply and Demand for Other Specialties, 2018-2033
14
Association of
American Medical CollegesThe Complexities of Physician Supply and Demand:
Projections From 2018 to 2033
Exhibit 12: Projected Other Specialist Physician Shortfall Range, 2018-2033
15
Association of
American Medical CollegesThe Complexities of Physician Supply and Demand:
Projections From 2018 to 2033
SUPPLY MODELING
The microsimulation supply model projects future supply based on the number and characteristics of the
current physician workforce and new physicians trained each year, hours-worked patterns, and
retirement patterns. This section describes the modeled scenarios and projections, with a brief
description of the supply model and model inputs and assumptions. Additional information about the
supply model and its inputs can be found in Appendix 1; further details are documented elsewhere.29
Supply Modeling Inputs, Assumptions, and Scenarios
All supply projections start with the approximately 807,400 physicians active in 2018, as estimated from
the AMA Physician Masterfile. Supply is defined as active physicians who have completed their
graduate medical education (GME) and includes physicians involved in both patient-care and non-
patient-care activities (i.e., teaching, research, and administration). The beginning supply estimate
includes only physicians under age 75 because past research suggests many physicians age 75 and
older in the Masterfile are no longer practicing medicine. The starting-year supply consists of about
228,100 Primary Care physicians, 137,300 physicians in internal medicine and pediatric subspecialties,
155,200 physicians in Surgical Specialties, 32,200 Primary Care-Trained Hospitalists, and 254,600
physicians working in Other Specialties.
Consistent with previous reports, we modeled Primary-Care-Trained Hospitalists separately from
Primary Care physicians. The Hospitalist projections build on our work to identify hospitalists using
Medicare fee-for-service billing records linked to the AMA Physician Masterfile. We defined hospitalists
as physicians who generate 90% or more of their billing for hospital-based services.
Our estimate of annual new physicians entering the workforce, 28,980, described in Appendix 1, is
similar to last year’s estimate, 28,854: an estimated 8,366 new physicians entering Primary Care, 5,655
new physicians entering internal medicine and pediatric subspecialties, 5,012 new physicians entering
Surgical Specialties, 1,221 Primary Care-Trained Hospitalists, and 8,726 new physicians entering Other
Specialties. The scenarios model the continuation of 28,980 physicians trained each year ― with the
distribution across specialties consistent with the specialty mix of graduates from school year 2018-2019
― which is the number the system can continue to train without new investment in GME.
Physician weekly-hours-worked patterns and retirement patterns differ by physician age, sex, and
specialty category. The updated projections use new data on hours worked and retirement estimated
from the 2019 National Sample Survey of Physicians (NSSP). The survey analysis is described in
Appendix 1. The updates to hours-worked patterns have little effect on the supply projections compared
with previous years’ reports. However, the updated retirement patterns suggest that physicians are
retiring earlier than previous estimates of retirement patterns indicated, so the future-year supply
projections are lower than in previous years’ reports.
As in the previous reports, this year, the Status Quo, Retirement, and Hours Worked Scenarios
(described below) were included in the analysis comparing physician supply and demand to project a
range for future adequacy of physician supply. Also as in past years, modest GME Expansion was
modeled separately as a policy-oriented supply scenario but was not included in the shortage
projections.
16
Association of
American Medical CollegesThe Complexities of Physician Supply and Demand:
Projections From 2018 to 2033
Status Quo Scenario
This scenario models continuation of the status quo in terms of number and characteristics of physicians
newly entering the workforce, hours-worked patterns, and retirement patterns. This scenario forms the
basis for the other modeled supply scenarios.
Early- and Delayed-Retirement Scenarios
Reflecting the uncertainty about future physician-retirement patterns, these scenarios model physicians
retiring two years earlier or two years later, on average, than they do now. The scenarios assume
physicians might delay or speed up retirement for financial, health, and other reasons. The 2018
Medscape National Physician Burnout and Depression Report indicates that 42% of physician
respondents reported burnout due to long work-hours and excess bureaucratic tasks. 30 Burnout is one
factor contributing to premature retirement.4-9 Recognizing the high economic and patient-care costs of
premature physician retirement, health organizations look for ways to delay retirement, such as
accommodating more flexible working hours.7,31,32
Changing Hours Worked Scenario
Our previous report estimated the change in average weekly hours worked by physicians during the
past decade using the American Community Survey (ACS). That survey produces data on physician
hours worked using the same format every year, so it is preferable to the NSSP for scenarios like this
one, which require an understanding of trends in physician hours worked. (Unlike NSSP data, ACS data
include no information on physician specialty, which means they cannot be used to forecast actual
supply by specialty category, and they cannot differentiate residents and fellows from physicians who
have completed their training.) For this scenario, we updated the average annual change using ACS
data. To increase sample size across age groups, we combined 2016-2018 ACS files to get an estimate
of physician work-hours in 2017, and we combined 2011-2013, 2006-2008, and 2001-2003 files to
estimate work-hours for, respectively, 2012, 2007, and 2002. The trend in recent years suggests that
average hours worked has been relatively steady for physicians age 35 and older, with a slight
decrease for males and a slight increase for females. Among physicians under age 35, there has been
an uptick in average hours worked in recent years. This modeled scenario simulates the supply
implications if the average annual trend observed in the past five years were to continue. We modeled
the change in hours worked by age and sex as a cohort effect.
GME Expansion Scenario
This scenario assumes an increase in federally funded GME support to train an additional 15,000
physicians per year, with 3,000 new residency slots added per year over a five-year period. Given an
average residency length of four years, this increase is modeled as an additional 3,750 new physicians
starting to enter the workforce each year beginning in 2025. This scenario is based on the proposed
Resident Physician Shortage Reduction Act. The distribution of new residency slots across specialties is
currently unknown, so for modeling purposes, we assume all specialties’ residency slots will increase in
proportion to their current distribution. This policy-related scenario was not included in calculations of
physician-shortage ranges.
17
Association of
American Medical CollegesThe Complexities of Physician Supply and Demand:
Projections From 2018 to 2033
Supply Projections
Updated annual projections for physician supply across all scenarios modeled are summarized in
Exhibit 13. Under the Status Quo Scenario, total physician supply increases from 807,400 in 2018 to
847,500 by 2033 — a 5% increase. This is below the approximately 10.1% projected growth in the U.S.
population over this period, contributing to a 4% decline in the physician-to-population ratio (declining
from 246 to 235 physicians per 100,000 population by 2033).
Exhibit 13: Projected Supply of Physicians, 2018-2033
As illustrated in Exhibit 14, this year’s updated supply projections covering the period 2018 to 2033
show slower growth in supply compared with 2018 to 2032. The 2019 report projected a 50,200
increase in supply, and the updated report projects a 40,100 increase in supply. The main contributor to
the lower projection is the updated retirement patterns, based on the 2019 NSSP, which suggest that
physicians are retiring younger than previously estimated (by 0.2 years for male physicians and
2.0 years for female physicians). Under the Retire 2 Years Earlier Scenario, the projected total supply
by 2033 would be 200 FTEs lower than the 2018 supply.
The GME Expansion Scenario is designed to approximate proposed legislation that would increase the
number of physician residency slots. Because the legislation has yet to be passed, we modeled its
effects delayed by one year in this study.
18
Association of
American Medical CollegesThe Complexities of Physician Supply and Demand:
Projections From 2018 to 2033
Exhibit 14: Projected Change in Physician Supply:
2020 vs. 2019 Report Projections
GME Expansion
Changing Hours
2019 Report
Retire 2 Years (years 2017-2032)
Later
2020 Report
(years 2018-2033)
Retire 2 Years
Earlier
Status Quo
0 20,000 40,000 60,000 80,000 100,000
Growth in Full-Time-Equivalent Supply: 15-Year Forecast
Note: The 2020 report value for the Retire 2 Years Earlier Scenario is -200 FTEs.
Whereas there is projected growth in supply for the Medical Specialties and Primary-Care-Trained
Hospitalist categories under all scenarios modeled, the results are mixed for the other specialty
categories ― for example, the supply of physicians in Surgery Specialties is projected to decline under
all but the Delayed-Retirement Scenario (Exhibit 15).
19
Association of
American Medical CollegesThe Complexities of Physician Supply and Demand:
Projections From 2018 to 2033
Exhibit 15: Projected Change in Physician Supply by Specialty Category,
2018-2033
Total
Primary Care
Retire 2 Years
Later
Hospitalists (PC trained)
Status Quo
Retire 2 Years
Earlier
Medical Specialties
Changing Hours
Surgical Specialties
Other Specialties
-20,000 0 20,000 40,000 60,000 80,000 100,000
Full-Time-Equivalent Physicians
20
Association of
American Medical CollegesThe Complexities of Physician Supply and Demand:
Projections From 2018 to 2033
DEMAND MODELING
Future demand for health care services and the physicians to provide those services is the result of the
complex interactions of patients’ needs and decisions to seek care, medical and technical
considerations of what care is feasible to provide, economic considerations, social norms and policies,
and the intricacies of a complex health care system and decisions made by providers and administrators
within this health system. While there is significant agreement about improvements needed in the health
care system, there is less agreement about how the system should be reformed. There are, however,
underlying trends and factors that will affect future demand for health care services and providers
regardless of how policy and health system changes might affect how care is used and delivered.
Previous versions of this report highlighted that population growth and aging are the dominant factors
affecting future demand for health care services. Other key factors with implications for physician
demand include increasing use of advanced practice registered nurses (APRNs), physician assistants
(PAs), and other health care workers in care delivery; efforts to improve population health through
preventive care; efforts to enhance the value of care delivery through managed-care principles and a
variety of mechanisms such as accountable care organizations (ACOs), patient-centered care, value-
based insurance design (VBID), and interventions to divert costly hospital-based care to appropriate
ambulatory settings; policy initiatives to advance national goals of increasing equity in health outcomes
and improving access to high-quality, affordable care; and less quantifiable trends such as advances in
technology and medicine.
While some factors, such as an aging population and national goals to expand access to care, will
increase demand for physicians, others could decrease demand, or increases and decreases in
demand could offset each other. For example, advances in artificial intelligence could improve the
productivity of radiologists, pathologists, and others in detecting and diagnosing cancers and other
medical conditions, possibly leading to a lower demand for these physicians to care for the existing
population.33,34 However, increasing longevity by reducing cancer deaths and other preventable deaths
means more physicians will be needed in the future to care for the larger population still living — many
of whom have chronic conditions to be managed. Thus, many of the above factors affecting care use
and delivery might not decrease overall demand for physicians but simply shift demand from one care-
delivery setting to another (e.g., care by hospitalists shifted to care by community-based providers), shift
demand across specialties (e.g., shift from oncology care by reducing cancer incidence to geriatric
medicine because people are living longer), or shift demand to the future as increased longevity
increases population size.
This section briefly describes the demand model inputs, assumptions, and scenarios and presents the
projections. Additional information about the demand model and inputs is included in Appendix 1 and
documented elsewhere.29
Demand Modeling Inputs, Assumptions, and Scenarios
Population Characteristics and Projections
Between 2018 and 2033, the U.S. population is projected to grow 10.1%, from about 328 million to
361 million people. The population under age 18 is projected to grow by 3.5%; the population age 65
and older, by 45.1%; and the population age 75 and older, by 47.7%.17 As a result, the national
prevalence and incidence of diseases that disproportionately affect older Americans is projected to grow
rapidly. Demand for physicians who treat patients with these diseases is expected to grow, as well. For
example, the microsimulation demand model finds that between 2018 and 2033, the prevalence of
diagnosed diabetes is projected to increase 25% (from 25.4 million to 31.8 million people), and the
population with heart disease is projected to increase 30% (from 10.0 million to 13.1 million).
21
Association of
American Medical CollegesThe Complexities of Physician Supply and Demand:
Projections From 2018 to 2033
The total U.S. population that is non-Hispanic white is projected to decline slightly, from 197.5 million to
197.0 million, between 2018 and 2033, while the population that is non-Hispanic black is projected to
grow by 13.3% (from 40.9 to 46.3 million). The non-Hispanic population of all other racesc is projected to
grow by 35.6% (from 28.8 to 39.1 million), while the Hispanic population is projected to grow by 31.4%
(from 59.9 to 78.7 million). Hence, a growing proportion of health care services will be for racial minority
and Hispanic patients, underscoring the importance of increasing racial and ethnic diversity among the
physician workforce.
The modeling approach involved creating a representative sample of the population in each U.S.
county, with county files aggregating to states and states aggregating to a representative sample of the
national population. Data sources used to construct the de-identified, representative samples of the
population in each geographic location included the 2018 U.S. Census Bureau, for data on county
demographics; the 2018 American Community Survey (ACS); the 2017 and 2018 Behavioral Risk
Factor Surveillance System (BRFSS); and the 2016 Centers for Medicare and Medicaid Services
(CMS), for data on people living in nursing homes and residential care facilities. Sources of the state-
and county-level population projections were individual states and IHS Markit, and the source of
national population projections was the U.S. Census Bureau. Information for each person in the
constructed population files consists of demographics (age, sex, race, and ethnicity); medical insurance
type; household income; whether the person lives in the community, a residential care facility, or a
nursing home; health-related lifestyle indicators of body weight status (normal, overweight, obese) and
current smoker status; presence of chronic conditions (arthritis, asthma, cardiovascular disease,
diabetes, or hypertension); patient history of cancer, heart attack, or stroke; and county of residence
urban-rural classification using the 2013 National Center for Health Statistics (NCHS) Urban-Rural
Classification Scheme for Counties.
Demand for Health Care Services
Current patterns of health care use, estimated using the combined 2013-2017 files of the Medical
Expenditure Panel Survey (MEPS) and the 2016 National Inpatient Sample (NIS), both from the Agency
for Healthcare Research and Quality (AHRQ), indicate that annual use of health care services varies
substantially by patient characteristics. The regression approach we used to model health care use
patterns is described in Appendix 1. While regression results varied by specialty and care-delivery
setting, the findings were largely consistent with expectations. Patient characteristics associated with
greater use of health care services include older age, having medical insurance, presence of the chronic
conditions modeled, living in a metropolitan area, and being non-Hispanic white. Some characteristics
were associated with mixed results — for example, patients in a managed-care plan were associated
with greater use of primary care services and lower use of some specialist services.
Patterns of Care Delivery
Current patterns of care delivery were calculated by first estimating the proportion of time physicians in
each specialty spend in each care-delivery setting (e.g., ambulatory care, emergency care, hospital
care) to estimate FTE care in that setting. Then, total national care use (e.g., office, outpatient, and
emergency visits and hospital inpatient days by diagnosis category) was divided by the FTE count to
create services-to-providers ratios. Many physicians provide services across multiple care-delivery
settings, including ambulatory visits in physician offices and outpatient clinics, hospital rounds, and
emergency department consults. To estimate FTEs by setting, estimates of the proportion of time
physicians spend in different care-delivery settings were calculated from a variety of sources, including
surveys conducted by professional associations and Medical Group Management Association (MGMA)
data. For example, among the 2,280 Primary Care physicians in the 2019 National Sample Survey of
Physicians (NSSP), physicians spent 80% of their direct patient-care time providing ambulatory care,
9% providing inpatient care, 6% providing urgent care, and the remaining 5% providing care in nursing
homes and assisted living facilities, emergency departments, and other settings.
22
Association of
American Medical CollegesYou can also read