ALASKA'S MINING INDUSTRY - THE ECONOMIC BENEFITS OF MARCH 2018 - MCDOWELL GROUP
←
→
Page content transcription
If your browser does not render page correctly, please read the page content below
The Economic Benefits of

ALASKA’S
MINING INDUSTRY
March 2018

    PREPARED FOR
                           PREPARED BY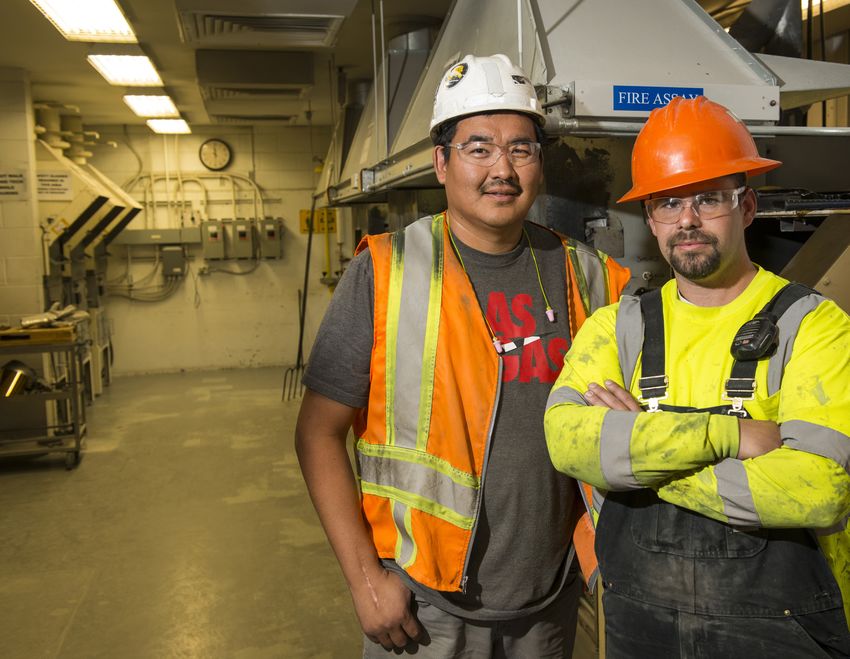
The Economic Benefits of
                                   Alaska’s Mining Industry

                                                  Prepared for:

                                                  Prepared by:

McDowell Group Anchorage Office
1400 W. Benson Blvd., Suite 510
Anchorage, Alaska 99503

McDowell Group Juneau Office
9360 Glacier Highway, Suite 201
Juneau, Alaska 99801                              March 2018
Website: www.mcdowellgroup.net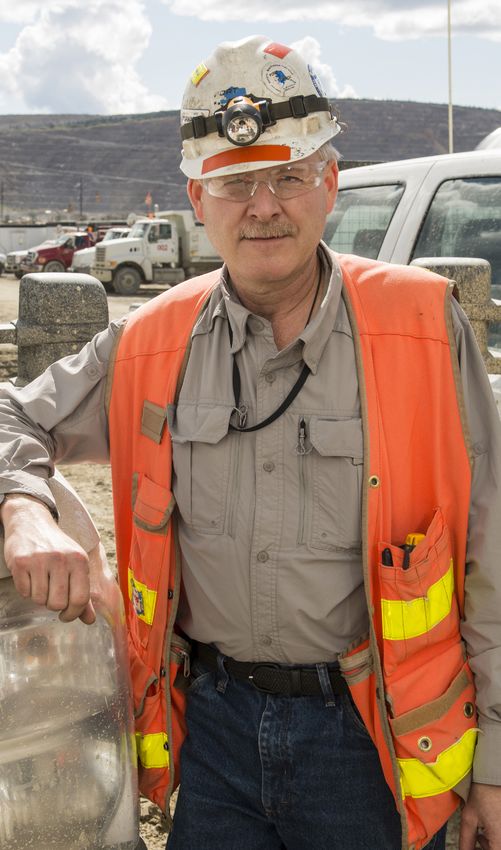
Table of Contents

Executive Summary ............................................................................................................................. 1
     Key Findings................................................................................................................................................................... 1
     Overall Summary.......................................................................................................................................................... 7
Study Purpose and Methodology...................................................................................................... 8
     Purpose............................................................................................................................................................................ 8
     Methodology................................................................................................................................................................. 8
Overview of Alaska’s Mining Industry ............................................................................................ 10
     Reconnaissance Exploration and Advanced Exploration ............................................................................ 10
     Mine Development and Construction ............................................................................................................... 21
     Production (Mine Operations) .............................................................................................................................. 25
     Mine Closure and Reclamation ............................................................................................................................ 37
Employment and Payroll in Alaska’s Mining Industry .................................................................. 38
     Direct Employment and Payroll............................................................................................................................ 38
     Indirect Benefits of Mining for Alaska’s Business Sector ............................................................................ 43
     Indirect and Induced Employment and Payroll .............................................................................................. 44
     Total Employment and Payroll Effects ............................................................................................................... 46
     Economic Output ....................................................................................................................................................... 46
Alaska Resident Employment........................................................................................................... 47
     Resident Hire in the Mining Industry ................................................................................................................. 47
     Important Source of Jobs for Rural Alaskans .................................................................................................. 48
Payments to Local and State Government ..................................................................................... 50
     State of Alaska Payments ....................................................................................................................................... 51
     Payments to Local Governments ......................................................................................................................... 55
     Payments to Alaska Mental Health Trust Authority ..................................................................................... 57
Benefits to Alaska Native Corporations .......................................................................................... 58
     Alaska Native Corporation Business Development Opportunities ......................................................... 58
     Alaska Native and Shareholder Hire................................................................................................................... 59
     Royalty Payments ...................................................................................................................................................... 59
     Other Mining Projects and Prospects ................................................................................................................ 60
Additional Mining Industry Benefits ............................................................................................... 62
     Workforce Development......................................................................................................................................... 62
     Charitable Giving and Membership Organization Support ....................................................................... 63
     Educational Support ................................................................................................................................................. 63
     Infrastructure Development .................................................................................................................................. 64
     Utility Impacts ............................................................................................................................................................. 65
Alaska’s Mineral Development Potential........................................................................................ 66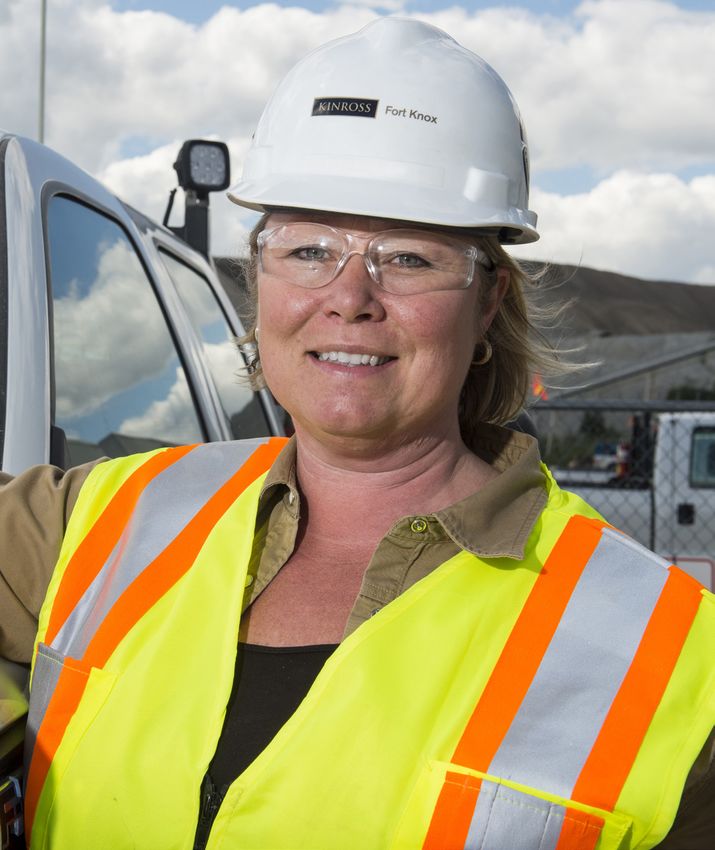
List of Tables
Table 1. Summary of Statewide Economic Impact of Alaska’s Mining Industry.................................................................. 7
Table 2. Other Active Exploration Projects, 2017 ...........................................................................................................................16
Table 3. Mining Industry Employment and Wages in Alaska, 2016 and 2017 ...................................................................43
Table 4. Top 10 Occupations in Alaska’s Metal Mining Industry, 2016 ................................................................................48
Table 5. Largest Producing Mines and Active Projects in Development and Advanced Exploration Projects State
         and Local Government Current and Expected Tax Obligations ..............................................................................50
Table 6. State of Alaska Payments .......................................................................................................................................................51
Table 7. Freight Shipped (‘000s of tons), by Type, and Freight Revenue, Alaska Railroad, 2008-2017 ...................54
Table 8. Other Payments to State of Alaska Agencies, 2016 ....................................................................................................55

List of Figures
Figure 1. Map of Alaska’s Mining Activity, 2017 .............................................................................................................................. 1
Figure 2. Exploration Expenditures in Alaska, 1981-2017, $million ........................................................................................11
Figure 3. Exploration Spending in Alaska, by Commodity, 2016 .............................................................................................12
Figure 4. Map of Alaska’s Active Advanced Exploration Projects, 2017 ...............................................................................12
Figure 5. Development Expenditures in Alaska, 1981-2017, $million ...................................................................................22
Figure 6. Map of New Alaska Projects in Development ..............................................................................................................23
Figure 7. Estimated Mining Production Value in Alaska, 1981-2016 ($million).................................................................26
Figure 8. Mining Production Value in Alaska, by Commodity, 2016 ($million) .................................................................26
Figure 9. Value of Alaska’s Minerals and Ores Exports, 2006-2016 .......................................................................................27
Figure 10. Alaska’s Minerals and Ores Export Markets, 2016 ...................................................................................................27
Figure 11. Map of Alaska’s Major Producing Mines, 2017 .........................................................................................................28
Figure 12. Map of Greens Creek Mine Operations .......................................................................................................................28
Figure 13. Map of Pogo Mine Operations.......................................................................................................................................31
Figure 14. Map of Red Dog Operations ............................................................................................................................................32
Figure 15. Alaska Mining Industry Employment, 2007-2016 ....................................................................................................40
Figure 16. Alaska Mining Industry Wages, 2007-2016 ................................................................................................................40
Figure 17. Monthly Employment in Alaska’s Mining Industry, 2016 ......................................................................................41
Figure 18. Mining Employment, by Activity, Full-time Equivalent Jobs, 2016 ....................................................................42
Figure 19. Mining Production Employment, by Mining Type, 2016 .......................................................................................42
Figure 20. Alaska Mining Industries Goods and Services Spending, by Type of Vendor, 2016 ..................................44
Figure 22. Percent of Positions Held by Nonresidents, by Sector, 2016 ..............................................................................47
Figure 23. Map of Alaska Communities Where Mining Employees Live ..............................................................................49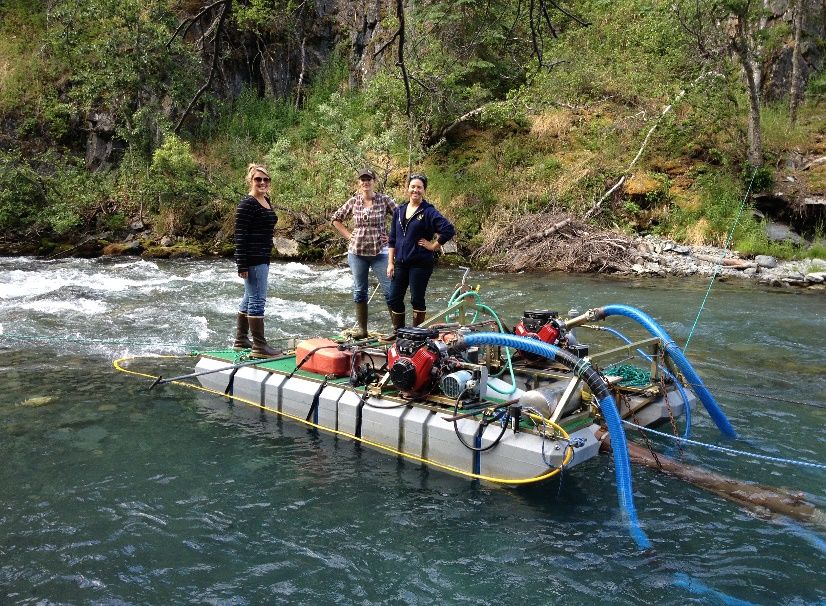
Executive Summary
Figure 1. Map of Alaska’s Mining Activity, 2017
This study measures the economic impact of
Alaska’s mining industry, which includes
exploration, mine development, and mineral
production. The industry produces zinc,
lead, copper, gold, silver, and coal, as well as
construction materials, including rock, sand
and gravel. New minerals, such as graphite
and rare-earth elements, may expand the
Alaska mining industry’s offerings. Mining is
a growing force in Alaska’s economy,
providing jobs for thousands of residents
and millions of dollars of personal income
statewide.
This study examines the direct, indirect, and induced economic impacts of the mining industry in 2016, with
some references to 2017.
Key Findings
Mining Industry Expenditures
EXPLORATION
• Mineral exploration expenditures in Alaska in 2016 totaled approximately $59 million. The preliminary
estimate for spending in 2017 is $110 million. Since 1981, $3.5 billion has been spent in Alaska on
mineral exploration programs.
• In 2016, there were 32 significant exploration projects in Alaska. Five operating mines accounted for 49
percent of 2016’s exploration spending.
• Exploration occurred throughout Alaska, but most of the expenditures were focused on six advanced
exploration projects: Graphite Creek (graphite), Livengood (gold), Palmer (copper, zinc, gold, and silver),
Pebble (copper, gold, and molybdenum), and Upper Kobuk Mineral Projects (copper, zinc, gold, and
silver).
DEVELOPMENT
• Since 1981, mining companies have invested $6.2 billion in development of Alaska mining projects.
• In 2016, $217 million was invested in eight mining projects in Alaska; the majority ($196 million)
occurred at existing operations, including Red Dog Operations, Fort Knox, Pogo, Greens Creek, and
Kensington mines.
The Economic Benefits of Alaska’s Mining Industry McDowell Group Page 1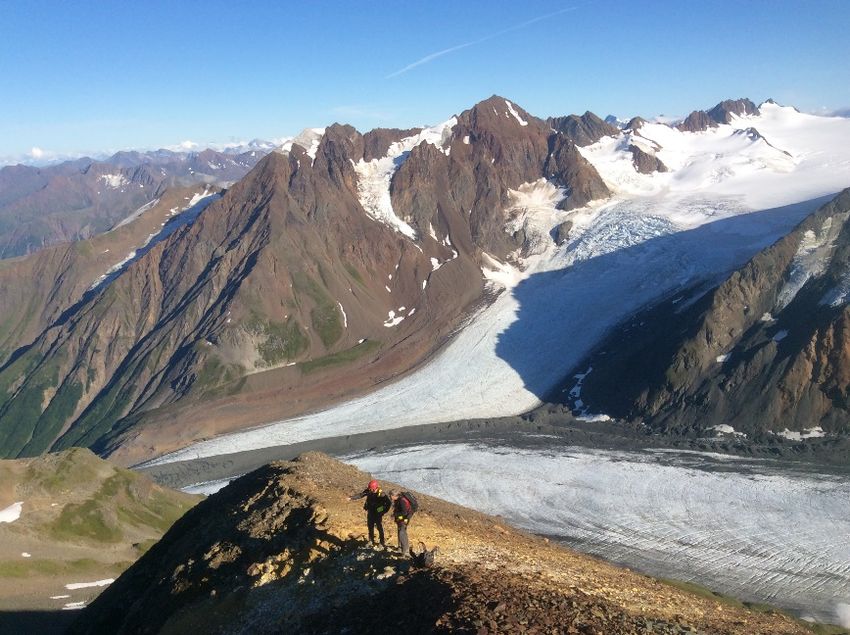
• One new project in the development stage – Donlin Gold – expects to complete its Environmental
Impact Statement review and permitting process in 2018. In December 2017, Pebble initiated its
permitting stage.
• The preliminary estimate for 2017 development spending is $213 million.
PRODUCTION
• Six major mines are operating in Alaska. Greens Creek, Red Dog Operations, Fort Knox, Pogo, and
Kensington are Alaska’s five major metal mines. Usibelli Coal Mine (UCM) is Alaska’s only operating coal
mine.
• In 2016, approximately 236 placer gold mines in Alaska produced 51,800 ounces of gold. Just over half
of Alaska’s active placer mines are in the Eastern Interior region.
• Approximately 120 sand and gravel operations, located throughout Alaska, reported at least $17 million
in production value on state lands.
• Zinc production accounts for 43 percent of mineral production value in Alaska. Gold ranks second (39
percent), followed by silver and lead (both 8 percent), coal (1 percent), and industrial minerals (rock,
sand, and gravel) (1 percent).
• Alaska’s mines generated an estimated $2.5 billion in total gross revenue in 2016.
• In 2016, $1.5 billion worth of minerals were exported to world markets, representing 35 percent of
Alaska’s total exports.
Mining Industry Employment
JOBS AND WAGES
• Alaska’s mining industry reported annual average employment of 2,788 workers in 2016, according to
the Alaska Department of Labor and Workforce Development. These workers had an average annual
wage of $108,624 in 2016, more than double the state’s all-sector average wage of $53,160.
• Total direct mining industry employment in Alaska averaged approximately 4,350 jobs in 2016 and $390
million in annual wages. This includes workers engaged in production (metals, coal and construction
materials), exploration activities, or mine development during 2016. This employment also includes self-
employed miners (often found in placer mines). Employment in 2017 is estimated at 4,500 jobs, with
$404 million in total annual wages.
• A 2014 study found that Alaska’s placer mining industry accounted for approximately 1,200 seasonal
jobs, with approximately $40 million in earnings in 2013.
• Multiplier effects stemming from expenditures on goods and services account for additional
employment and wages in Alaska. Including direct, indirect and induced employment, Alaska’s mining
industry accounted for approximately 8,600 jobs and $675 million in wages in 2016, and 9,000 jobs and
$700 million in annual wages in 2017.
The Economic Benefits of Alaska’s Mining Industry McDowell Group Page 2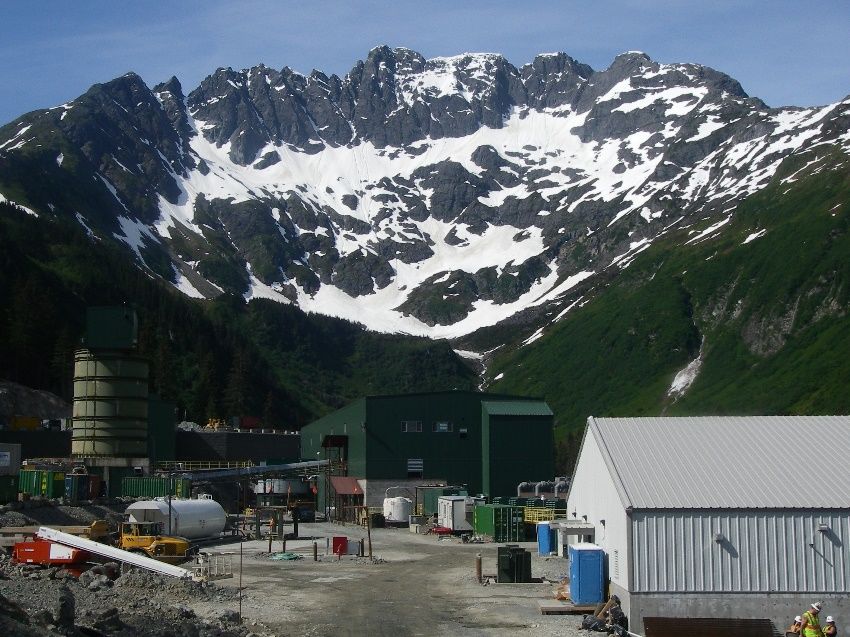
ALASKA RESIDENT AND RURAL ALASKAN HIRE
• Approximately 79 percent of employees of Alaska’s operating mines are Alaska residents, based on W2
tax data from all six producing mines.
• Workers in Alaska’s mining industry live in all regions of the state. Rotation schedules allow Alaskans to
live wherever they want while working at remote mines. Mines offer employment opportunities to
residents of rural Alaska, where few other job opportunities exist.
• Mining employees live in least 55 communities throughout Alaska (not including placer gold, and rock,
sand, and gravel production).
EMPLOYMENT OUTLOOK
• Several advanced exploration and new mine development projects could dramatically increase Alaska’s
mining employment over the next several years if they enter full production:
o Graphite Creek project, north of Nome, is expected to create 330 production jobs.
o Livengood Gold project, just north of Fairbanks, will also create 330 mining jobs.
o Donlin Gold project in Southwest Alaska is expected to require up to 1,200 workers during mine
operations.
o Pebble Project in Southwest Alaska would require an operations labor force of approximately
750.
o Exploration programs at all producing mines may extend mine life and sustain (if not increase)
employment.
Spending on Goods and Services
• Alaska’s six largest mines (Usibelli Coal, Greens Creek, Red Dog, Fort Knox, Pogo, and Kensington) and
advanced exploration projects spent an estimated $880 million in 2016 on a wide variety of goods and
services in support of operations.
• Two-thirds ($580 million) of this spending on goods and services occurred with approximately 600
Alaska vendors. This spending, combined with tax payments to state and local governments, creates
the mining industry’s high multiplier effects in Alaska.
Local and State Government Payments
LOCAL GOVERNMENT
• Mining companies pay the largest share of local taxes in the Northwest Arctic Borough, Fairbanks North
Star Borough, Denali Borough, and City & Borough of Juneau. In 2017, tax payments to local
government totaled an estimated $34 million.
The Economic Benefits of Alaska’s Mining Industry McDowell Group Page 3
o Fort Knox paid $8.7 million in property taxes to the Fairbanks North Star Borough, making the
mine the largest single property taxpayer in the Borough.
o Greens Creek Mine paid $1.7 million and Kensington paid $1.4 million in property taxes to the
City & Borough of Juneau. These two mines are the two largest tax payers in the City & Borough
of Juneau.
o Red Dog Operations paid $14 million in payment in lieu of taxes (PILT) to the Northwest Arctic
Borough in 2017, plus $8 million in payments to the new Village Improvement Fund. Red Dog
is the Borough’s single largest source of revenue. The Borough has no sales tax or property tax
revenues. Since 1989, Red Dog Operations has made more than $199 million in PILTs, payments
to the Northwest Arctic Borough School District, and payments to the Village Improvement
Fund.
o Usibelli Coal Mine pays taxes to the Fairbanks North Star Borough, Matanuska-Susitna Borough,
and Denali Borough.
o Several mining companies (including Bering Straits Native Corporation, Arctic Gold Mining,
Nome Gold Corporation, and Alaska Gold Company) pay real property taxes to the City of
Nome (approximately $97,000 in 2017).
o In certain jurisdictions, mining companies pay sales tax on their local purchases of goods and
services. For example, in 2016, Greens Creek Mine paid an estimated $616,000 in sales taxes to
the City & Borough of Juneau and Constantine (Palmer Project) paid approximately $28,000 to
the Haines Borough.
o Many local governments also receive revenue from locally-owned or leased rock quarries, and
sand and gravel pits.
STATE GOVERNMENT
• The mining industry pays a wide variety of taxes, rent, royalties and fees to the State of Alaska, including
$42 million in mining license fees in State Fiscal Year (SFY)2017. In total, the mining industry paid the
State of Alaska $61 million in rents, royalties, and fees in SFY2017.
• A portion of Alaska’s mining industry rents and royalty payments are earned on behalf of the Alaska
Permanent Fund. If state leases were issued on or before December 1, 1979, 25 percent of these
payments are earned for the Permanent Fund; after December 1, 1979, these earnings grow to 50
percent. In 2016, the Permanent Fund earned $4.9 million from the mining industry and in 2017, $5.2
million.
• Mining-related activity is an important source of revenue for the Alaska Railroad Corporation. In
SFY2017, the railroad earned approximately $21.2 million from movement of coal and rock, sand, and
gravel (representing about 31 percent of the railroad’s total revenue from freight).
• In SFY2017, the mining industry paid $24.8 million to the Alaska Industrial Development and Export
Authority for use of the DeLong Mountain Transportation System and the Skagway Ore Terminal.
The Economic Benefits of Alaska’s Mining Industry McDowell Group Page 4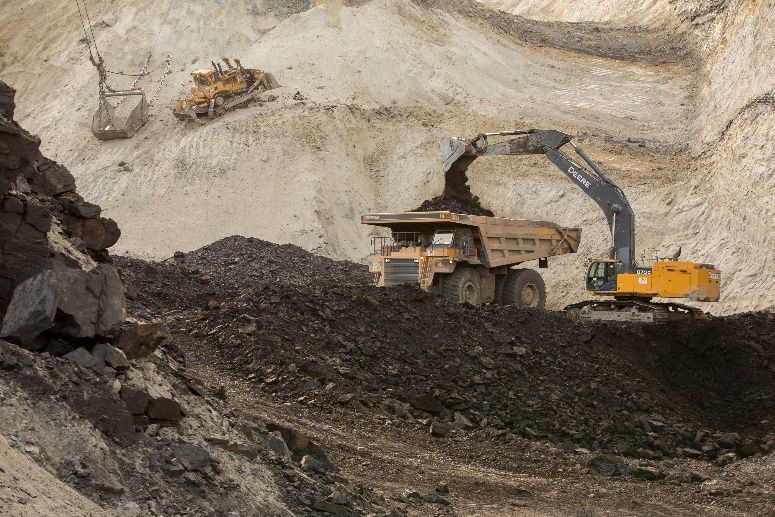
• In SFY2017, the mining industry paid $2.7 million to the Alaska Mental Health Trust for rents and royalty
payments as well as purchases of construction materials sales from Trust lands.
Partnerships with Alaska Native Corporations
All Alaska Native Corporations (ANC) benefit from mining activity through jobs for shareholders, 7(i) and 7(j)
royalty sharing payments (see below), or business partnerships.
ALASKA NATIVE AND SHAREHOLDER HIRE
• At Red Dog Operations, 55 percent of the year-round jobs are filled by NANA shareholders, including
jobs with Teck Alaska, NANA Lynden and NMS.
• At Trilogy’s Upper Kobuk Minerals Project, 59 percent of the employees and contractors were NANA
shareholders in 2017.
• In 2016, 37 percent of the development jobs at Donlin Gold were filled by Alaska Native employees.
ROYALTY PAYMENTS
• Regional ANCs are mandated to annually redistribute 70 percent of net revenue earned on subsurface
developments of their lands (also known as Section 7(i) payments) among all regional corporations.
These Regional ANCs then distribute payments to their respective village corporations (also known as
Section 7(j) payments).
o As part of a lease agreement, Red Dog Operations pays a royalty to NANA that totaled $247
million in 2017. Of the 2017 royalty payment, NANA redistributed $156 million to all regional
ANCs.
o Since 1989, NANA has distributed $1.1 billion (not including NANA’s distributive share) to the
other ANCSA corporations in Section 7(i) payments. Half of these Section 7(i) payments were
then redistributed to each village corporation and to at-large shareholders in the form of a
Section 7(j) payment.
o While some royalties have already been paid to Calista Corporation (and lease payments to The
Kuskokwim Corporation), the long-term benefit for Calista Corporation will come from royalties
once Donlin Gold is in operation.
BUSINESS DEVELOPMENT OPPORTUNITIES
• Two NANA subsidiaries – NMS and NANA Lynden Logistics – play major roles in Red Dog Operations.
Other subsidiaries, including NANA/Major Drilling, DOWL HKM, NANA Oilfield Services, NMS Security,
NANA WorleyParsons, NANA/Pacific, NMS Training Systems, and NMS Staffing all provide services to
Red Dog Operations and others in Alaska’s mining industry.
• Chuilista Services, a subsidiary of Calista Corporation, was created to provide camp structures,
equipment, and personnel in support of Donlin Gold development.
The Economic Benefits of Alaska’s Mining Industry McDowell Group Page 5
• The Pebble Partnership works directly with several village corporations, including Iliamna Development
Corporation (IDC), a wholly owned for-profit subsidiary of Iliamna Natives Limited. IDC provides The
Pebble Partnership with site support services, including food services, housekeeping, transportation,
waste disposal (incinerator) and other services, as well as leased space and buildings.
Other Measures of Economic Impact
• Mining offers additional benefits to the Alaska economy, including:
o Development of workforce skills that are often transferable to sectors of the economy other
than mining.
o Public and private infrastructure investment that has broad benefit beyond the primary use of
a mining venture, including roads, docks, and electric transmission.
o Charitable contributions to at least 385 nonprofit organizations throughout Alaska in 2016
totaling approximately $4.6 million. Another $300,000 went to many civic, business, and
industry organizations in Alaska through sponsorships and membership fees in 2016.
o Direct support for student performance (scholarships and internships) and endowments for
faculty and research at the University of Alaska.
Alaska’s Mineral Endowment and the Future of Mining in Alaska
• Although most of Alaska is unexplored, there are 7,200 known mineral occurrences, not including coal
or industrial/construction materials deposits. With this resource potential along with rising base and
precious metals prices, conditions are right for further growth in Alaska’s mining industry. Alaska is an
attractive target for mining industry exploration, as evidenced by the $1.4 billion in exploration between
2010 and 2017.
• As owners of 44 million acres of privately-held land, much of which was selected for its mineral potential,
ANCs and their shareholders are well positioned to play a key role in future development of the mining
industry in Alaska. In partnership with the mining industry, most of Alaska’s Regional ANCs continue to
evaluate mineral development opportunities on their lands, with potential resources ranging from
gravel operations to gold, silver, copper, nickel, lead, zinc, platinum, tungsten, manganese, strategic
minerals, jade, limestone, and coal deposits.
The Economic Benefits of Alaska’s Mining Industry McDowell Group Page 6Overall Summary
The table below highlights the economic impact of Alaska’s mining industry in 2016 and 2017.
Table 1. Summary of Statewide Economic Impact of Alaska’s Mining Industry
Category Amount
Direct Jobs and Wages
4,350 (2016)
Estimated mining industry jobs in Alaska
4,500 (2017)
$390 million (2016)
Estimated mining industry wages in Alaska
$404 million (2017)
Total Jobs and Wages (Including Multiplier Impacts)
8,600 (2016)
Total jobs attributable to the Alaska mining industry
9,000 (2017)
$675 million (2016)
Total wages attributable to the Alaska mining industry
$700 million (2017
Investment
$59 million (2016)
Exploration expenditures
$110 million (2017)
Total exploration investment in Alaska, 1981-2017 $3.5 billion
$217 million (2016)
Development expenditures
$213 million (2017)
Total development investment in Alaska, 1981-2017 $6.2 billion
Production (2016)
Number of placer mines 236
Estimated placer gold production 51,800 ounces
Number of sand and gravel operations 120
Value of Alaska’s mineral exports $1.5 billion
Mineral exports percentage of Alaska’s total exports 35 percent
Government Revenue
$81 million (2016)
Payments to State of Alaska
$109 million (2017)
$37 million (2016)
Rents, royalties, and taxes (including mining license tax)
$61 million (2017)
$24 million (2016)
AIDEA facilities user fees
$25 million (2017)
$18 million (2016)
Mining commodity movement by Alaska Railroad
$21 million (2017)
$23 million (2016)
Payments to local governments
$34 million (2017)
Payments to Alaska Mental Health Trust $3 million (both 2016 and 2017)
Native (ANCSA) Corporations
$111 million (2016)
7(i) payments to ANCSA Regional Corporations
$250 million (2017)
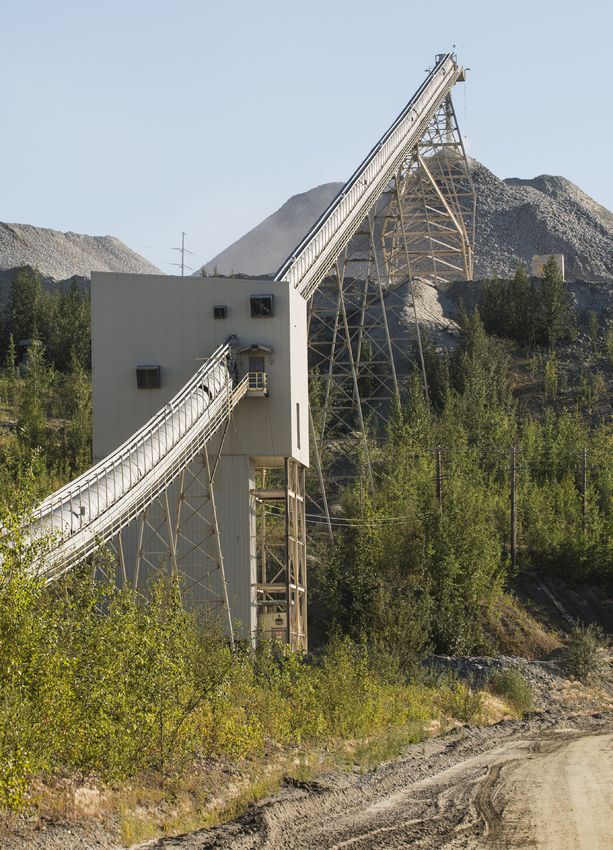
The Economic Benefits of Alaska’s Mining Industry McDowell Group Page 7Study Purpose and Methodology Purpose This study measures the economic impact of Alaska’s mining industry, which includes exploration, mine development, and mineral production. The industry produces zinc, lead, copper, gold, silver, coal, as well as construction materials, including rock, sand and gravel. New minerals, such as graphite and rare-earth elements (necessary for many of today’s high-tech electronics), may expand Alaska’s mining industry’s offerings. Mining is a growing force in Alaska’s economy, providing jobs for thousands of residents and millions of dollars of personal income statewide. This study examines the direct, indirect, and induced economic impacts of the mining industry in 2016, with 2017 estimates. Methodology To conduct the analysis, McDowell Group requested data on employment, resident hire, shareholder hire, vendor purchases and other operational spending, payments to local and state governments, and other activities from Alaska’s major mining companies (including exploration companies). Data was also compiled from various public sources, including the Alaska Departments of Labor and Workforce Development (DOLWD), Natural Resources (DNR), Commerce, Community and Economic Development (DCCED), and the federal Bureau of Economic Analysis (BEA). There is no comprehensive public source of data regarding mining employment and payroll. Sources of employment and payroll data include the BEA, DOLWD, and DNR’s, Division of Geology and Geophysical Survey employment data. Each source has advantages and disadvantages. McDowell Group therefore supplements public employment data (annual average and W2 tax form data) and payroll information with data obtained directly from the individual companies. IMPLAN™, a model for estimating the size and linkages of different types of economic activity, was used to help the study team assess the multiplier (so-called “ripple”) effects of different types of industry spending on the statewide and regional economies. The report includes a discussion of multiplier effects along with estimates of how Alaska’s mining industry indirectly affects employment and payroll statewide. Other measures of economic impacts are also discussed, for example the industry’s payments to local and regional governments, state government, and to Alaska Native corporations. The economic impact analysis is based on 2016 data; however, some preliminary 2017 information is also presented. This report begins with an overview of the mining industry, including a description of the mining cycle, from exploration through site reclamation. A summary of Alaska’s mine production activity and advanced exploration projects is also provided. All photos were provided by Alaska’s mining companies and Alaska Miners Association. The Economic Benefits of Alaska’s Mining Industry McDowell Group Page 8
FOR INFORMATIONAL PURPOSES ONLY This report is written for informational purposes only and is current only as of the date of this report. The data in this report have not been independently audited and are not intended to be used, relied on or considered in making any legal, financial, or business decision. Data and analysis presented are subject to change at any time with or without notice. Similarly, the data in this report are not an official financial statement or disclosure by any of the mining companies and should be not deemed as such. The Economic Benefits of Alaska’s Mining Industry McDowell Group Page 9
Overview of Alaska’s Mining Industry
The mining industry and the minerals and metals it produces are essential to the average American’s way of life.
According to the Mineral Information Institute, nearly 6.6 billion tons of minerals and energy fuels were
produced in 2017 to supply the needs of the U.S., an average of more than 40,600 pounds of minerals for each
American. 1 Based on statistics from the U.S. Geological Survey, the average American will require 3.2 million
pounds of minerals, metals and fuels during his or her lifetime. 2 Annually, the average person in America
accounts for:
• 10,500 pounds of stone to make roads, buildings, bridges, and other construction uses;
• 7,500 pounds of sand and gravel to make concrete, asphalt, roads, blocks, and bricks;
• 12 pounds of copper in buildings, electrical and electronic parts, plumbing, and transportation;
• 11 pounds of lead for transportation, batteries, electrical, communications, and TV screens;
• 5 pounds of zinc to make paint, rubber, skin creams, rust resistant metals, and for use in nutrition and
health care; and
• 4,500 pounds of coal to produce energy.
Mining is more than just extracting mineral resources from the earth. It involves reconnaissance exploration,
prospect assessment, advanced exploration, pre-development engineering and environmental research, mine
construction, production, final site reclamation and post-reclamation monitoring. This chapter describes the
various phases of the mining cycle of activity and provides examples of Alaska projects in each phase of this
cycle.
Reconnaissance Exploration and Advanced Exploration
The mining cycle begins with exploration. Reconnaissance exploration defines areas that are promising for a
specific mineral and/or previously unrecognized mineral deposits with economic potential in a region. Following
discovery comes more focused exploration, sometimes termed “target” or “advanced” exploration. During this
process, the deposit is sampled to determine grade and tonnage and the probability of profitable mining. This
is a complex stage of mineral resource development. Dozens of constantly changing economic, financial and
technical forces influence mine feasibility. Low grades, small tonnages, metallurgical recovery, infrastructure or
high costs may mean that a deposit never advances beyond the assessment stage. Alternatively, it may sit idle
for many years until rising metal prices or technological advances help turn the project into a profitable venture.
In recent years, mineral exploration has become increasingly sophisticated. Reconnaissance exploration
programs often begin with analysis of satellite or high altitude aerial photographs covering broad areas.
Depending on the target minerals, airborne geophysical surveys may be employed over large tracts of land.
Geochemistry also plays an important role in mineral exploration, whereby chemical analysis of stream sediment
and soil samples allows mining companies to make a preliminary assessment of mineral potential without
sampling the underlying bedrock.
1 https://mineralseducationcoalition.org/mining-minerals-information/mining-mineral-statistics/
2
Ibid.
The Economic Benefits of Alaska’s Mining Industry McDowell Group Page 10Following discovery, drilling, sampling, engineering, metallurgical analysis, financial analysis, and baseline
environmental analysis are all part of the effort to determine if profitable and environmentally responsible
mining is possible. Ore grade, tonnage, and mineral/metal prices are critical factors for mine feasibility, but so
are costs. These include the cost of preparing the ore body for mining, building a mill (concentrator), mining a
ton of ore, crushing, grinding, and refining a product from that ton of ore, and eventual shut-down and site
reclamation. This assessment process addresses the full life-cycle of the mine. Modern mines are designed from
the start to prepare for ultimate closure.
Exploration in Alaska
Exploration spending is again on the upswing in Alaska. According to the State of Alaska’s Division of Geological
and Geophysical Surveys (DGGS), exploration expenditures in Alaska in 2016 totaled approximately $58.9
million. The preliminary estimate for 2017 exploration expenditures is $110 million. Since 1981, mining and
exploration companies have spent $3.5 billion in Alaska on mineral exploration programs. 3 The global recession
dried up funding for exploration programs after more robust years in the 2007 to 2012 period. With improving
global economic conditions metal prices have recovered, and interest in exploration in Alaska has been renewed.
Figure 2. Exploration Expenditures in Alaska, 1981-2017, $million
$400
$350
$300
$250
$200
$150
$100
$50
$-
2017*
1981
1982
1983
1984
1985
1986
1987
1988
1989
1990
1991
1992
1993
1994
1995
1996
1997
1998
1999
2000
2001
2002
2003
2004
2005
2006
2007
2008
2009
2010
2011
2012
2013
2014
2015
2016
*Preliminary estimates.
Source: Alaska’s Mineral Industry 2016, State of Alaska, Department of Natural Resources, Division of Geological and Geophysical
Surveys.
3
http://dggs.alaska.gov/webpubs/dggs/sr/text/sr072.pdf p. 3
The Economic Benefits of Alaska’s Mining Industry McDowell Group Page 11In 2016, 32 individual exploration projects reported activity in Alaska (some companies managed multiple
projects). 4 Alaska’s five operating mines spent $28.6 million for exploration (or 49 percent of all exploration
spending). Since 1989, Red Dog has spent approximately $100 million in exploration of its deposits. 5 Six other
projects spent more than $1 million each. Fourteen projects spent between $100,000 and $1 million. Most of
this exploration funding came from Canadian and other international sources. Of the total $58.9 million in
exploration spending in 2016, $25.3 million (43 percent) was spent exploring polymetallic (combination of
different metals, $24.9 million (42 percent) for precious metals (platinum, silver, and gold), $7.8 million (13
percent) for base metals (copper, nickel, lead, and zinc), and just over $900,000 for rare-earth elements,
magnetite sands, gemstones, and graphite.
Figure 3. Exploration Spending in Alaska, by Commodity, 2016
Other,
$0.9 million Base metals,
2% $7.8 million
13%
Precious
Metals,
$24.9 million
42% Polymetallic,
$25.3 million
43%
Source: Alaska’s Mineral Industry 2016, State of Alaska, Department of Natural Resources, Division of Geological and Geophysical Surveys.
ADVANCED EXPLORATION PROJECTS
There are four projects currently considered in the advanced exploration stage: Upper Kobuk, Graphite Creek,
Livengood, and Palmer. Brief overviews of these four advanced exploration projects follow the map below.
Figure 4. Map of Alaska’s Active Advanced Exploration Projects, 2017
4 Ibid., p. 14
5
Email correspondence with Wayne Hall, Teck Alaska, January 30, 2018.
The Economic Benefits of Alaska’s Mining Industry McDowell Group Page 12Upper Kobuk (Arctic and Bornite) Trilogy’s 2017 budget for the Upper Kobuk exploration program was $17.1 million. Arctic Project The Arctic Project is Trilogy’s most advanced exploration/pre-development effort in its Upper Kobuk Minerals Project and in the Ambler Mining District. Located approximately 20 miles northeast of Kobuk, 26 miles from Shungnak, and 40 miles east-northeast of Ambler, the Arctic Project includes 112,000 acres of State of Alaska mining claims and patented federal mining claims. The Arctic deposit hosts 27 million metric tons of Indicated and Inferred resources containing copper, zinc, lead, gold, and silver. With an average copper grade of 3.2 percent and a copper-equivalent grade of 5.9 percent, the Arctic deposit is very high grade. The Arctic Preliminary Economic Analysis (PEA), completed by Tetra Tech in September 2013, found a surface mine and mill processing 10,000 tons of ore per day over a 12-year mine life could be economically feasible. The base case scenario assumes long-term metal prices of $2.90/pound for copper, $0.85/pound for zinc, $0.90/pound for lead, $22.70/ounce for silver, and $1,300/ounce for gold. The PEA assumes an access road from the Dalton Highway constructed and financed much like Alaska Industrial Development and Export Authority’s (AIDEA) Delong Mountain Transportation System. In 2017, the Bureau of Land Management (BLM) launched an Environmental Impact Statement (EIS) process for the Ambler Mining District Industrial Access Project (AMDIAP). While the AMDIAP EIS is being prepared, Trilogy hopes to complete a feasibility study for the Arctic deposit and carry out additional environmental baseline studies, as well as additional geotechnical and hydrologic modeling. While the Arctic Project is the most advanced project in the Ambler district, the likelihood and timing of development are uncertain. Several key factors are at play, including completion of the AMDIAP road, some increase in copper prices, and advancing the Bornite project. Bornite Trilogy is also assessing the development potential of the Bornite deposit, located approximately 11 miles southwest of the Arctic Project. Bornite is on property owned by NANA Corporation. Though lower-grade than Arctic, Bornite is a larger deposit, with potential for both surface and underground mining. The Bornite resource has been estimated to include more than 180 million metric tons of Indicated and Inferred resources, including 41 million tons of Indicated resource containing 913 million pounds of copper and 142 million tons of Inferred resource containing 5.5 billion pounds of copper. With grades ranging from 1 percent to 2.5 percent, the Bornite deposit contains just under 6.5 billion pounds of copper. The Bornite deposit has been an exploration target for many years. Over the course of 21 exploration seasons since 1957, a total of 234 core holes were drilled, totaling 256,000 feet. A preliminary economic analysis has not been prepared for Bornite, so little information is available on the potential scale of mining and concentrate production. However, it is evident that Bornite could play an important role supplementing or expanding the Arctic operation. Though the mineralogy of the Bornite and Arctic deposits differ (with different processing requirements), Bornite could provide mill feed and generate concentrate shipments for many years beyond the 12-year life modeled in the Arctic PEA. The Economic Benefits of Alaska’s Mining Industry McDowell Group Page 13
Trilogy’s largely seasonal employment in Alaska peaked in July 2016; 63 percent of the total workforce lived in the NANA region. Graphite Creek Graphite One Resources announced the results of its PEA in February 2017. The deposit contains an estimated 44 million metric tons of graphite mineralization at 7 percent graphite. An operation with a 40-year mine life would produce 60,000 metric tons per year of graphite concentrate at 95 percent graphite, once full production is reached in Year 6. At full production, the manufacturing plant is expected to convert 60,000 metric tons per year of concentrate into 41,850 metric ton per year of Coated Spherical Graphite (CSG) and 13,500 metric tons per year of purified graphite powders. Projected capital cost estimates total $363 million, including $43 million at the mine, $158 million for the processing plant, $32 million for supporting infrastructure, and $130 million for the manufacturing plant. Projected annual operating costs at full capacity are $98.2 million. Estimated project employment includes 174 workers at the mine site, 95 workers in the processing plant, 102 workers in the manufacturing plant for a total of 371 workers. 6 In 2017, the U.S. Geological Survey listed Graphite as one of 23 materials for which the U.S. is 100 percent import dependent and as a Critical Mineral Resource. 7 Livengood Gold Project Located 70 miles northeast of Fairbanks, the Livengood Gold Project is an advanced-stage exploration project aimed at developing a surface gold mine producing 52,600 tons of ore per day and 300,000 ounces of gold annually over a 23-year mine life. The latest estimates (2017) indicate the gold deposit contains 9.0 million ounces of proven & probable reserves and 11.5 million ounces of measured and indicated resources. A total of 783 drill holes totaling 717,435 feet define the resource. 8 The Livengood Gold Project Pre-Feasibility Study (PFS), completed in October 2016, estimates the Livengood Gold Project mineral resource is 497 million measured metric tons at an average grade of 0.68 g/metric ton (10.84 million ounces) and 28.0 million indicated metric tons at an average grade of 0.69 g/ metric ton (0.62 million ounces), for a total of 525.4 million metric tons at an average grade of 0.68 g/ metric ton (11.5 million ounces). The PFS mine plan would provide sufficient ore to support an average annual production rate during Years 1-5 of 378,300 ounces per year and an annual production rate of approximately 294,100 ounces per year over an estimated 23-year mine life, producing a total of approximately 6.8 million ounces of gold. At an optimal mine and mill production scale of 52,600 tons per day, this scale of operations would require approximately $1.84 billion in initial capital (development) expenditures and an estimated $2.7 billion spent over the life of the project. The mine expects to create 800 direct construction jobs for two years, peaking at 1,050 jobs. During production, it is estimated 331 direct operational jobs. 9 6 http://www.graphiteoneresources.com/projects/graphite-one-project-pea/overview/ 7 http://www.graphiteoneresources.com/news/news-display/index.php?content_id=267 8 http://www.ithmines.com/livengood-gold-project/project-highlights/ 9 http://www.ithmines.com/_resources/technical_reports/3661004_THM_NI43-101_Livengood_Gold_Project_PFS_2.pdf. p. 1-21. The Economic Benefits of Alaska’s Mining Industry McDowell Group Page 14
The most recent economic analysis of the project indicates an “all-in sustaining cost” of $1,263 per ounce of
gold. With gold currently at approximately $1,340 (as of January 12, 2018), consistently higher gold prices will
be required to support investment in Livengood project development.
International Tower Hill Mines announced a budget of $6.3 million to continue its exploration work in 2017.
Palmer
The Palmer Project is a joint venture
partnership between Constantine (51
percent) and Dowa Metals & Mining
Co., Ltd. (49 percent), with
Constantine as operator. It is a high-
grade copper-zinc deposit with the
potential for underground mining.
The mid-stage mineral exploration
project is located adjacent to the
Haines Highway, 37 miles northwest
of Haines.
Nearly $30 million has been invested
in the project since Constantine
began work in 2006. Work to date
includes exploratory drilling and
access road construction. Ongoing environmental and geotechnical studies are being conducted to establish a
baseline for additional permits required for additional exploration drilling and road construction work.
Up from the 2016 budget of $3.7 million, Constantine spent $7.0 million on its 2017 program focused on 7,000
meters of drilling, airborne geophysical surveying, geological mapping, and prospecting work. Other work
included additional road construction, engineering, environmental studies, and evaluation of a potential
exploration drift. 10 The current inferred resource estimate is 8.1 million metric tons with metal grades of 1.41
percent copper, 5.25 percent zinc, 0.32 g/ ton gold, and 31.7 g/ton silver. During the exploration season in 2017,
Constantine had 20 seasonal employees in Alaska. Of its Alaska resident workers, 94 percent live in Haines.
10
http://constantinemetals.com/projects/palmer/
The Economic Benefits of Alaska’s Mining Industry McDowell Group Page 15OTHER SELECTED EXPLORATION PROJECTS
Exploration occurs throughout Alaska. The table below details other active exploration by region, mine, and
mining company, followed by brief project overviews.
Table 2. Other Active Exploration Projects, 2017
Project Exploration Company Prospect
Northern Region
Lik Zazu Metals Corp. Zinc, lead, silver
Noatak Teck Alaska Zinc, lead, silver
Western Region
Copper, molybdenum, lead, zinc,
Round Top Western Alaska Copper & Gold
silver
Eastern Interior Region
Elephant Mountain Endurance Gold Corporation Gold
Shorty Creek Freegold Ventures Ltd. Copper, molybdenum
Circle-area claims Kinross Gold Inc. Gold
Tetlin Peak Gold LLC Gold, silver, copper
Red Mountain White Rock Minerals Polymetallic
Golden Zone Avidian Gold Inc. Gold, silver, copper
Honolulu Honolulu Prospect Corp. Silver, lead, zinc, copper, gold
Caribou Dome Coventry Resources Ltd. Copper
Stellar Millrock Resources Inc. Gold, copper
Fairbanks District
Fort Knox and District Fairbanks Gold Mining Inc. Gold
Golden Summit Freegold Ventures Ltd. Gold
Treasure Creek Treasure Creek Partnership Gold
Amanita Avidian Gold Inc. Gold
Richardson District
Richardson and Hilltop Northern Empire Resources Corp. Gold
Sam Great American Minerals Exploration Inc. Gold, silver
Goodpaster District
Pogo area Sumitomo Metal Mining Pogo LLC Gold
Skippy, Fog Stone Boy Inc. Gold
LMS Gold Reserve Inc. Gold
Goodpaster Millrock Resources Inc. Gold
Southcentral Region
Whistler GoldMining Inc. Copper, gold, silver
Willow Creek/Lucky Shot Miranda Gold Corp. and Gold Torrent Gold
Chisna Millrock Resources Copper, gold
Opal Ben Porterfield Gold
Ice Cape Alaska Mental Health Trust Land Office Heavy mineral concentrates
Southwestern Region
Copper Joe Kiska Metals Corp. Copper
Alaska Peninsula
Unga-Popov Redstar Gold Corp. Gold
The Economic Benefits of Alaska’s Mining Industry McDowell Group Page 16Project Exploration Company Prospect Southeastern Region Kensington/Jualin Coeur Alaska Inc. Gold Herbert Gold Grand Portage Resources Ltd. Gold Greens Creek Mine Hecla Greens Creek Mining Company Silver, gold, zinc, lead Zarembo Island Zarembo Minerals Co. LLC Gold, silver, lead, zinc, Niblack Heatherdale Copper, gold, silver, zinc Bokan Mountain/Dotson Ridge Ucore Rare Metals Inc. Rare-earth-element Sources: Alaska’s Mineral Industry 2016, State of Alaska, Department of Natural Resources, Division of Geological and Geophysical Surveys. Various company websites. SELECTED EXPLORATION PROJECTS – EASTERN INTERIOR ALASKA Caribou Dome Coventry Resources Ltd.’s Caribou Dome project is located about 155 miles north of Anchorage with road access from the Denali Highway. Two hunting lodges along the Denali Highway provide accommodation facilities, communications, logistics support, and supplies. 11 A 2016 drilling program identified high-grade copper mineralization with potential for surface mining. Coventry’s exploration objective is to outline 5 to 10 million metric tons of resource with a grade of 2.5-4.0 percent copper. The 2016 drilling program included a total of 22 holes totaling approximately 28,000 feet. Results released to date include intersects of 3.5 meters at 11.5 percent copper and 4.3 meters at 5.2 percent copper. The sediment-hosted deposit exhibits characteristics like the very rich Kennicott copper deposit. Preliminary metallurgical testing including conventional floatation has produced concentrates of about 25 percent copper. Coventry has undertaken a preliminary scoping study based on using the near surface material for a low capital cost, open-pit starter operation. 12 The estimated mineral resources is 2.8mt at 3.1 percent copper, containing 86,000 metric ton of copper. 13 Elephant Mountain The Elephant Mountain project is located 75 miles northwest of Fairbanks in the Rampart-Manley Hot Springs area. Endurance Gold Corporation is evaluating the prospect’s potential as an occurrence similar to Fort Knox Mine and the Ryan Load and True North deposits near Fairbanks. In 2016, Endurance completed four drill holes totaling about 2,000 feet. An induced polarization survey was conducted in 2017. Golden Summit Freegold Ventures Limited’s Golden Summit gold prospect is located about 18 miles northeast of Fairbanks and five miles from the Fort Knox Mine. The large relatively low-grade gold deposit has potential for development of a surface mine with heap leach and bioxidation gold extraction. At a cut-off grade of 0.3 grams per ton, the deposit includes 133 million tons of Indicated and Inferred resources. 11 http://www.polarx.com.au/caribou-dome-copper-project/ 12 “Alaska 2017 Mining in Review,” Alaska Business, November 2017, p. 51. 13 http://www.polarx.com.au/caribou-dome-copper-project/ The Economic Benefits of Alaska’s Mining Industry McDowell Group Page 17
A preliminary economic assessment (PEA) outlines a two-phase, 24-year open pit mine producing 10,000 tons
per day, with peak annual gold production of 158,000 ounces and annual average production of 96,000 ounces,
based on $1,300 per ounce of gold. Oxide ore would be mined during the first phase of production, with sulfide
ore mining starting in year 9. An initial investment of $88 million would be required to initiate mining and heap
leach operations. Another $348 million capital investment would be required over the life of the project to mine
and process the sulfide ore. 14 Next steps for Freegold at Golden Summit are to expand through additional
drilling the heap-leachable oxide resource.
Red Mountain
White Rock Minerals owns a potentially high-grade polymetallic (zinc-silver-lead-gold-copper) target in the
Bonnifield Mining District about 60 miles south of Fairbanks. Previous drilling intercepted numerous zones of
high-grade mineralization in two deposits, Dry Creek and West Tundra Flats. Intercepts over several meters of
15 to 24 percent zinc and 10 to 15 percent silver have been identified. In 2017, White Rock conducted surface
geochemical sampling and ground geophysics over known conductivity targets to define drill targets for follow
up.
SAM Project
Great American Minerals Exploration, Inc. (GAME) has the Monte Cristo and Uncle Sam prospects, now
collectively called the SAM project, encompassing a broad area about 40 miles west of the Pogo Mine. Previous
work noted an inferred resource containing 2.9 million ounces of gold and 51 million ounces of silver. The area
includes shallow and heap-leachable oxide deposits, as well as deeper and richer sulfide deposits.
Shorty Creek
Freegold Ventures also has the Shorty Creek Project, an early stage project located about 75 miles northwest of
Fairbanks. In 2016, Freegold conducted a drilling program, ground magnetics, and additional geochemical
sampling to evaluate the resource potential of a porphyry copper-gold-molybdenum system. 15 Though results
of drilling in 2016 are encouraging, with one drill intersect of 45 meters grading 1.06 percent copper equivalent,
no resource estimates have been made. Another drill hole found 93.5 meters grading 0.55 percent copper
equivalent. In 2017, Freegold continued a core drilling program to define the characteristics of the deposit. If
additional drilling proves promising, a preliminary economic analysis will be conducted.
Tetlin Project
In 2015 Royal Gold, Inc. and Contango Ore, Inc. formed a joint venture, Peak Gold, LLC, to advance the Tetlin
Gold Project, located 200 miles from Fairbanks and 15 miles south of Tok. Just under 10 million tons of Indicated
and Inferred resources with over 800,000 ounces of gold, with additional silver and copper values, have been
identified to date. From 2009 through 2016, a total of $40 million was spent studying the deposit, including $11
million in 2016. Additional drilling was conducted in 2017.
14 https://www.freegoldventures.com/site/assets/files/1862/pea_goldensummit.pdf p. 1
15
https://www.freegoldventures.com/site/assets/files/1932/shorty_creek_report_2017-06012017.pdf , p. 6-7.
The Economic Benefits of Alaska’s Mining Industry McDowell Group Page 18SELECTED EXPLORATION PROJECTS – SOUTHCENTRAL ALASKA
Willow Creek/Lucky Shot Project
The Lucky Shot Project, in the Willow Creek mining district, is located approximately 25 miles northeast of
Willow. Lucky Shot is a low tonnage, high grade deposit with 265,000 tons of Measured, Indicated, and Inferred
resource containing 157,000 ounces of gold. The project is a joint venture between Miranda Gold Corp and
Gold Torrent, Inc. Initial planning has the small but very high-grade deposit being mined over a five-year period,
potentially starting in 2018.
SELECTED EXPLORATION PROJECTS – SOUTHWESTERN ALASKA
Terra Gold
During 2016, WestMountain Gold, Inc. conducted surface mining and milling operations as part of its bulk-
sampling program at Terra gold mine, located approximately 125 miles west-northwest of Anchorage. A
landslide in September 2016 shut down the operation; however, prior to the slide 890 tons had been processed
with another 1,470 tons of stockpiled material available. The identified mineral resources include 128,913 ounces
of indicated resources and 811,286 ounces in estimated inferred resources.
SELECTED EXPLORATION PROJECTS – ALASKA PENINSULA
Unga-Popov
The Unga Gold Project covers portions of adjacent Unga and Popov Islands, approximately 550 miles southwest
of Anchorage and about 8 miles from Sand Point. During the summer of 2016, Redstar completed an advanced
drill targeting exploration program at the Shumagin Gold Zone, the Empire Ridge Gold Prospect, and Orange
Mountain Gold Prospect which included geochemical sampling, detailed structural mapping, and
reconnaissance mapping and surface bedrock sampling; exploring other known prospects within 240 square
km district-scale property position; and expanding and extending known mineralization at the Shumagin high-
grade gold zone. A follow-up geophysics program was started in April 2017, followed by a drilling program
from May-June 2017. 16
SELECTED EXPLORATION PROJECTS – SOUTHEASTERN ALASKA
Bokan Mountain-Dotson Ridge
The Bokan Mountain project is located about 37 miles southwest of Ketchikan. The project is owned by Ucore
Rare Metals and contains rare earth elements. The 1,500-metric ton/day underground operation would include
processing components – a material sorting and leaching process plant and an advanced separation process –
to produce rare earth oxide (REO) concentrates.
16
https://www.redstargold.com/projects/alaska/unga-project/
The Economic Benefits of Alaska’s Mining Industry McDowell Group Page 19You can also read