An Initial Assessment of Cannabis Production, Distribution, and Consumption in Oregon 2018 - An Insight Report First Edition - Updated Version ...
←
→
Page content transcription
If your browser does not render page correctly, please read the page content below

Insight Report

An Initial Assessment of Cannabis Production,
Distribution, and Consumption in Oregon 2018
- An Insight Report

First Edition - Updated Version
August 6, 2018

                 Oregon – Idaho High Intensity Drug Trafficking Area
                       4190 Aumsville Hwy, Salem, OR 97317

                                                                       1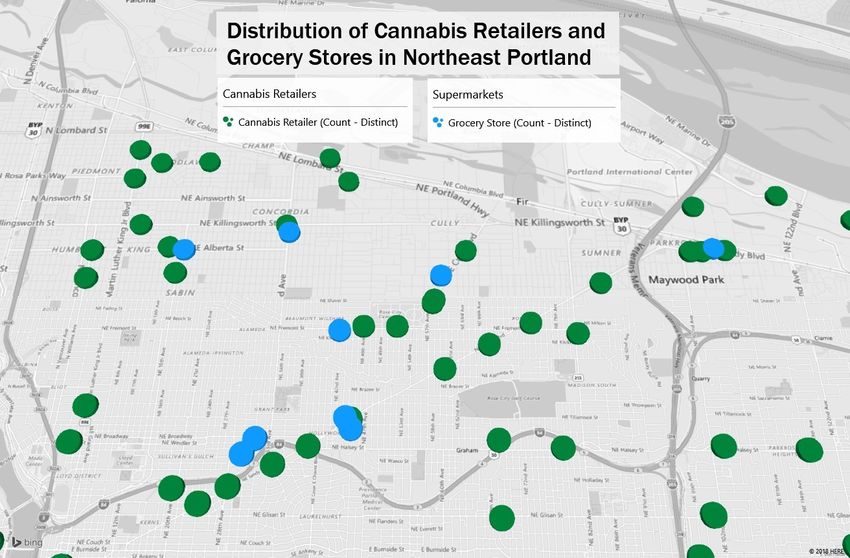
Page Intentionally Left Blank

    Prepared by the Oregon –Idaho High Intensity Drug Trafficking Area

2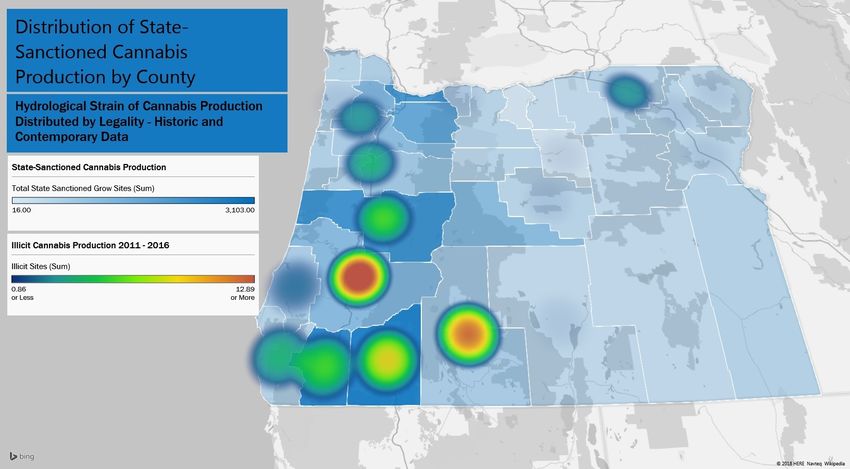
Table of Contents

Section I: Project Objectives, Research Design, and Analytic Scope - Pg. 5
Section II: Key Findings - Pg. 9
Section III: A Risk Based Socio-Economic Analysis - Pg. 13
     Part I: Production - Pg. 15
     Part II: Distribution - Pg. 20
     Part III: Consumption - Pg. 22
Section IV: A Risk Based Public Health Analysis - Pg. 24
     Part I: Production - Pg. 26
     Part II: Distribution - Pg. 27
     Part III: Consumption - Pg. 30
Section V: A Risk Based Law Enforcement Analysis - Pg. 34
     Part I: Production - Pg. 36
     Part II: Distribution - Pg. 38
     Part III: Consumption - Pg. 40
Section VI: Additional Areas of Research Pg. 42
Section VII: Technical Appendix - Pg. 44

                                                                             3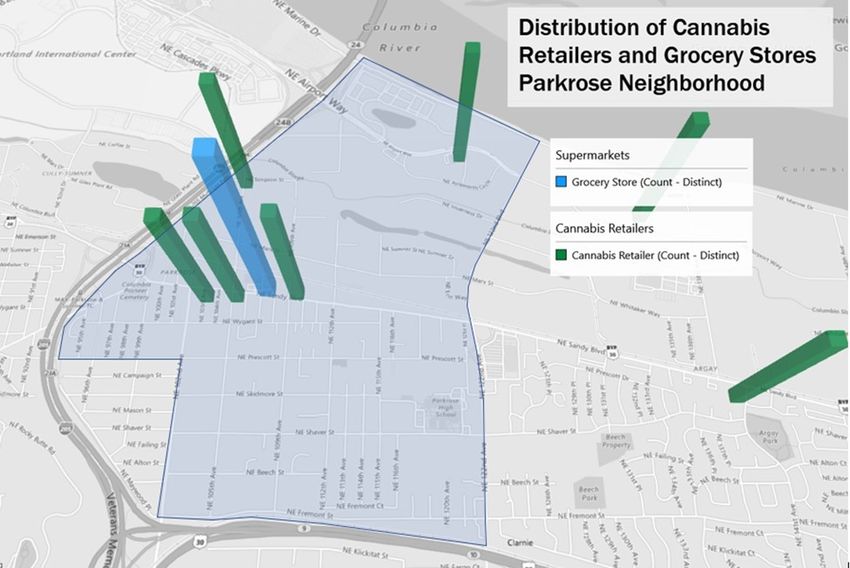
Section I: Project Objectives, Research Design, and Analytic Scope

    Report Purpose

        Oregon has had a state-authorized medical cannabis system since 1998, and, in November 2014,
 Oregon voters approved the Control, Regulation, and Taxation of Marijuana and Industrial Hemp Act
 (commonly known as Measure 91) to legally commercialize non-medical retail cannabis in the state
 implemented as of July 2015. As a result, the Oregon-Idaho High Intensity Drug Trafficking Area (OR-ID
 HIDTA) initiated the Oregon Cannabis Insight Report in recognition of the need to continuously examine the
 effects of cannabis production, distribution, and consumption in Oregon. The OR-ID HIDTA established a
 research framework based on shared concerns – areas of common interest to both the federal and state
 government – and then impartially gathered and examined readily available data, which is relevant to those
 concerns. Thereby, this project establishes an empirical foundation on which ongoing strategic analyses can
 be conducted. This research effort does not purport to be a policy evaluation or policy performance review;
 rather this assessment provides a verifiable analysis of assorted information and data, which has been
 centralized as part of this research effort.

 Research Design
        When establishing the research’s scope, the OR-ID HIDTA employed the now historic United States
 Department of Justice’s (USDOJ) “Cole Memo” and letter of the law codified by Measure 91, which, when
 combined, clearly defined areas of shared concern. Despite the rescission of the Cole Memo, the areas of
 concern (Enforcement Priorities) it identified became the bedrock of Oregon’s Ballot Measure 91. According
 to the August 29, 2013 memorandum by former USDOJ Deputy Attorney General James M. Cole, specific
 areas of concern are 1:
 •    Preventing the distribution of marijuana to minors;

 •    Preventing revenue from the sale of marijuana from going to criminal enterprises, gangs, and cartels;

 •    Preventing the diversion of marijuana from states where it is legal under state law in some form to other
      states;

 •    Preventing state-authorized marijuana activity from being used as a cover or pretext for the trafficking of
      other illegal drugs or other illegal activity;

 •    Preventing violence and the use of firearms in the cultivation and distribution of marijuana;

 •    Preventing drugged driving and the exacerbation of other adverse public health consequences associated
      with marijuana use;

1.Cole, James M. 2013. "Guidance Regarding Marijuana Financial Crimes." U.S. Department of Justice. August 29. Accessed September 26, 2016. https://
www.justice.gov/sites/default/files/usao-wdwa/legacy/2014/02/14/DAG%20Memo%20-%20Guidance%20Regarding%20Marijuana%20Related%20Financial%
20Crimes%202%2014%2014%20%282%29.pdf.

4
Report Purpose
•    Preventing the growing of marijuana on public lands and the attendant public safety and environmental
     dangers posed by marijuana production on public lands; and

•    Preventing marijuana possession or use on federal property.

Oregon’s Measure 91 follows similarly 2:

•    Eliminate the problems caused by the prohibition and uncontrolled manufacture, delivery, and
     possession of marijuana within Oregon;

•    Prevent the distribution of marijuana to persons under 21 years of age;

•    Prevent the revenue from the sale of marijuana from going to criminal enterprises, gangs, and cartels;

•    Prevent the diversion of marijuana from this state to other states;

•    Prevent marijuana activity that is legal under state law from being used as a cover or pretext for the
     trafficking of other illegal drugs or other illegal activity;

•    Prevent violence and the use of firearms in the cultivation and distribution of marijuana;

•    Prevent drugged driving and the exacerbation of other adverse public health consequences associated
     with the use of marijuana;

•    Prevent the growing of marijuana on public lands and the attendant public safety and environmental
     dangers posed by marijuana production on public lands; and

•    Prevent the possession and use of marijuana on federal property.

The guidance issued by former Deputy Attorney General James M. Cole was officially rescinded by the
January 4th, 2018 Memorandum from Attorney General Jeff Sessions3, which stated that:

 In the Controlled Substances Act, Congress has generally prohibited the cultivation, distribution, and
possession of marijuana. 21 U.S.C. § 801 et seq. It has established significant penalties for these crimes. 21
U.S.C. § 841 et seq. These activities also may serve as the basis for the prosecution of other crimes, such as
those prohibited by the money laundering statutes, the unlicensed money transmitter statute, and the Bank
Secrecy Act. 18 U.S.C. §§ 1956-57, 1960; 31 U.S.C. § 5318. These statutes reflect Congress' s determination
that marijuana is a dangerous drug and that marijuana activity is a serious crime.

       In deciding which marijuana activities to prosecute under these laws with the Department's finite
resources, prosecutors should follow the well-established principles that govern all federal prosecutions.
Attorney General Benjamin Civiletti originally set forth these principles in 1980, and they have been refined
over time, as reflected in chapter 9-27 .000 of the U.S. Attorneys' Manual. These principles require federal
prosecutors deciding which cases to prosecute to weigh all relevant considerations, including federal law

2.State of Oregon. "Measure 91 - the Control, Regulation, and Taxation of Marijuana and Industrial Hemp Act." Oregon Recreational Marijuana. 2014. http://
www.oregon.gov/olcc/marijuana/Documents/Measure91.pdf (accessed June 21, 2018).
3.Sessions, Jefferson B. 2018. Memorandum for All United States Attorneys. Memorandum, Washington D.C.: United States Department of Justice.

                                                                                                                                                             5
Report Purpose
enforcement priorities set by the Attorney General, the seriousness of the crime, the deterrent effect of
criminal prosecution, and the cumulative impact of particular crimes on the community.

       Given the Department's well-established general principles, previous nationwide guidance specific to
marijuana enforcement is unnecessary and is rescinded, effective immediately. This memorandum is intended
solely as a guide to the exercise of investigative and prosecutorial discretion in accordance with all
applicable laws, regulations, and appropriations. It is not intended to, does not, and may not be relied upon
to create any rights, substantive or procedural, enforceable at law by any party in any matter civil or
criminal.

The criteria listed above was used as the basis for hierarchal structured argumentation and problem
formulation. In this process, OR-ID HIDTA broke larger, more complicated intelligence questions into
manageable individual research topics, upon which, comprehensive research design was established.

6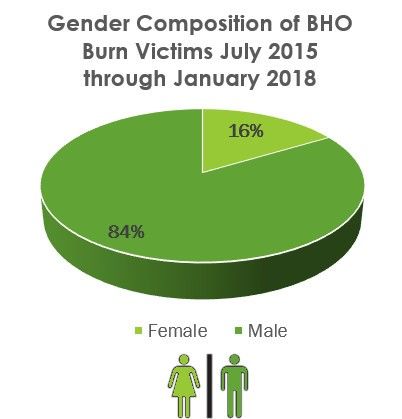
Report Scope and Analytic Framework
The OR-ID HIDTA recognized the differences in United States Code and Oregon Revised Statues, and
therefore chose to focus research efforts on the shared areas of concern that were identified in the now
obsolete federal guidance and subsequently crystallized into state law, along with the relevant considerations
for potential prosecution outlined by the U.S. Attorneys' Manual. The overlapping areas of interest were
evaluated through three primary frames of reference that centered on production, distribution, and
consumption of cannabis by using a mixture of reliable direct and indirect data sources. All sources were
evaluated using prescribed analytic standards from the Director of National Intelligence outlined in
Intelligence Community Directives.
Oregon Federal
Priorities Priorities
HIDTA
Analysis
Socio-Economic
Analytic Frames of Public Health
Reference
Law Enforcement
Cannabis Production
Key Areas of
Cannabis Distribution Research
Cannabis Consumption
7
History of Cannabis Legality at Federal and Oregon State Levels

                        United States              Oregon
                                         1937
         The Marijuana Tax Act -
      Effectively Prohibits Cannabis

                                         1970
      The Controlled Substances Act -           1973
       Officially Prohibiting Cannabis                   Oregon Decriminalization Bill
                     Use                               Allowing for Personal Possession

                                         1990
          Soloman - Lautenberg
               Amendment                        1998
         States Can Pass Laws of                          1998 Ballot Measure 67
        Mandatory Driver’s License                     (Oregon Medical Marijuana Act)
        Suspensions for Cannabis                         Legalizes Medical Cannabis
               Possession

                                                2012
                                                       Medical Marijuana Dispensaries
                                                          Legalized by Legislature
                                         2014
      Rohrabacher - Farr Amendment              July 2015
       Prohibits Justice Department                     Measure 91 - Decriminalization
        from Interfering with State                       of Recreational Use and
         Medical Marijuana Laws                                 Possession
                                                Oct 2015
                                                            Early Retail Sales of “Useable
                                                             Marijuana” through Medical
                                                                    Dispensaries
                                                June 2016
                                                       Early Retail Sales of Edibles and
                                                        Concentrates through Medical
                                                                 Dispensaries

                                                Oct 2016
                                                       Licenses Issued and Sales begin
                                                        through Retail Cannabis Stores

8
Section II: Key Findings
This section outlines key findings from the research that is covered in this assessment. The section has
three subsections that are divided into socio-economic, public health, and law enforcement perspectives. For
additional context into the research and analysis shown below, please refer to the parent section from which
these are derived.
Key Socio-Economic Perceptive Findings
Production Essential Elements of Information - On Pages 15—19
Oregon’s estimated current annual production capacity exceeds 911,000 kg (2 million lb), far outpacing
annual state consumption demands, which itself is between 84,400 to 169,000 kg (186,100 to 372,600 lb) i.
Oregon’s estimated current annual production capacity is capable of producing approximately $6.7 billion
worth of cannabis. In the period immediately following state-sanctioned legalization, Oregon had
approximately 417,000 active cannabis users (roughly 10% the state’s population) of varying usage
frequency. As of August 2018, within the state-sanctioned market, there is about one cannabis grow site for
every 25 users - reflecting current population estimates. Additionally, as a result of cannabinoid extract
production, the Oregon Burn Center spent $9.6 million for initial acute care treating inpatient burn victims
Production
from July 2015 through January 2018. In the same period of time, law enforcement investigated 64
clandestine cannabinoid extraction laboratories, 21 of which (33%) resulted in explosion or fire. As a result
of overproduction, impoverished counties that are heavily engaged in the cultivation of cannabis, such as
Jackson, Josephine, and Lane; face a critical economic risk from collapsing cannabis prices. Cannabis
production is resource intensive, on average a mature plant consumes 22.7 liters of water daily (more than a
vineyard grapevine) and a single kilogram of finished flower requires 5.2 megawatt hours yearly (twice the
average yearly consumption of a refrigerator), resulting in the release of 4.5 metric tons of carbon dioxide
(equal to the average yearly emissions of a passenger car). Due to historic use of and the exponential growth
of cannabis cultivation, the Rogue River Basin is under acute hydrologic strain.
Distribution Essential Elements of Information - On Pages 20—22
As of August 2018, there are 574 retailers and 126 wholesalers actively licensed by OLCC, with an
additional 352 retailers and 223 wholesalers applications awaiting agency review. Currently in Oregon,
analysis indicates that there are higher concentrations of state-sanctioned cannabis distributors in lower-
Distribution
income communities and historically disenfranchised areas – a potentially temporary trend. The highest
concentrations of recreational retailers are found in Multnomah, Lane, Marion, and Jackson Counties.
Coinciding with the exponential growth of state-sanctioned cannabis markets, there has been an aggressive
expansion of sub-sector digital currencies tailored for cannabis services. In Q-3 of 2017 alone, at least $88
million related to the distribution of cannabis was routed through financial institutions in Oregon.
i. Refer to Section II of the Technical Appendix for methods used to estimate Total State Production capacity and Total State Consumption rate.
9Key Socio-Economic Perceptive Findings Continued
Consumption Essential Elements of Information - On Pages 22 and 23
Among the roughly 417,000 cannabis users in Oregon, approximately 128,000 are multiple daily users. ii The
single largest portion of cannabis users are between the ages of 25 and 44; this population of roughly 164,000
individuals accounts for an approximate annual consumption of at least 38,400 kg (84,600 lb). Statewide,
Consumption
cannabis users consume an estimated 84,000 to 169,000 kg (185,100 to 372,600 lb) annually – a market value
of up to $1.3 billion in sales. And according to figures published from the Oregon Department of Revenue in
July 2018, the state has collected $173.1 million cumulatively in the last three fiscal years from “marijuana
taxes.” Yet, a glut of cannabis stockpiles stemming from overproduction has caused a 50% annual price drop
since 2016. Epidemiological research indicates that cannabis consumption is higher among medical users,
who are exempt from excise taxation. As of 2018, only 31% of available cannabis inventory was distributed,
leaving 69% unconsumed within the state-sanctioned recreational system.
ii.Multiple daily use is more than one use per-day.
10Key Public Health Findings
Production Essential Elements of Information - On Pages 26 and 27
Between July 2015 and January 2018, the Oregon Burn Center provided inpatient initial care to 71 burn
victims as a result of cannabinoid extract production, at least one of whom died. Medical staff at the Oregon
Production
Burn Center noticed a seasonal increase of cannabinoid extract burn victims during winter months –
hypothesized to be a result of decreased air circulation and potentially increased post-harvest processing. A
discernable public health risk is emerging among cannabis testing laboratories from a trade-off between
accuracy and expense; reduced cost gives reduced accuracy.
Distribution Essential Elements of Information - On Pages 27—30
In 2016 and 2017, 54.8% of adult Oregonians reported exposure to cannabis advertising in the last 30 days,
while only 29% of them reported having seen information about the health risks of cannabis use. As of 2017,
37.2% of 8th graders and 49.5% of 11th graders in Oregon reported exposure to online cannabis advertising in
Distribution
the last 30 days. Currently, Oregon allows cannabis advertising on media platforms where less than 30% of
viewership is underage, which is twice the recommended threshold by experts in prevention and reduction.
Additionally, it is unclear how audiences are identified or what entity carries the responsibility for ensuring
cannabis advertising is permissible. By 2016, cannabis was reported as easier to access than cigarettes among
11th graders in Oregon.
Consumption Essential Elements of Information - On Pages 30—33
Following state-sanctioned legalization, in 2016, 11% of current adult cannabis users self-reported less
frequent use, while 64% self-reported comparable use, and 25% self-reported more frequent use. As of
2017, 6.7% of 8th graders and 20.9% of 11th graders self-reported cannabis use in the last 30 days. iii
Perception of risk from weekly cannabis use among both 8th and 11th graders decreased between 2014 and
2016, though the change was not statistically significant. By 2017, nearly one in five 8th and 11th graders
Consumption
reported living in a household with an adult who uses cannabis. Between October 2015 and October 2016,
the rate of cannabis-related emergency department visits increased 85% from 3.4 per 1000 to 6.3 per 1000.
Cannabis-related calls to the Oregon Poison Control Center rose from 103 in 2014 to 348 by 2016;
tachycardia iv was the most commonly reported clinical effect. Among impaired driving fatalities, analysis of
toxicology results from 2010 through 2015 indicates that an average of 5% of drivers involved in traffic
fatalities were THC positive. Yet, in the same period, only 38% of traffic fatalities were subject to a
toxicology screening. Additional traffic fatality data indicates that there was a 50% increase in motor-vehicle
involved pedestrian fatalities between 2013 and 2016 – information gaps remain as to why this occurred,
further evaluation is required to determine the roots causes of this increase.
iii. Current use of cannabis means any use of a marijuana preparation, in any form, within the last 30 days. This is the standard definition on national and state health
surveys for both youth and adults.
iv. Abnormally rapid heart beat.
11Key Law Enforcement Findings
Production Essential Elements of Information - On Pages 36 and 37
As recently as 2016, illicit cannabis cultivation on public lands persisted unabated, despite the emergence of
the state-sanctioned cannabis production market. From 2011 through 2016, 84% of trespass illicit grow sites
Production
were found on U.S. Forest Service lands. In 2016 alone, over 26,500 plants – worth $362 million – were
removed from public lands across Oregon. In all, from 2011 through 2016, statewide illicit grow sites
produced $2.1 billion worth of cannabis. Aside from illicit grow operations, law enforcement in Oregon
investigated at least 64 clandestine cannabinoid extract laboratories between July 2015 and January 2018, 21
of which resulted in a fire or explosion.
Distribution Essential Elements of Information - On Pages 38—40
Illicit distribution of cannabis has persisted after the emergence of the state-sanctioned market. Between July
2015 and January 2018, 6,602 kg (14,550 lb) of trafficked Oregon cannabis was seized en route to 37 states -
worth more than $48 million. During that period of time, Oregon cannabis was most frequently illicitly
exported to Minnesota, Florida, Wisconsin, Missouri, Virginia, Illinois, Arkansas, Iowa, Maryland, and
Texas. By aggregate volume of exported cannabis, however, the states of Virginia, Ohio, Wisconsin, New
York, Missouri, Florida, New Jersey, Texas, and Illinois were the most common destinations. The majority
of illicitly exported Oregon cannabis was linked to Jackson, Multnomah, Josephine, Lane, Deschutes, and
Washington counties. SUVs are more commonly used in the trafficking of Oregon cannabis than passenger
cars. In-bound monetary seizures determined to be related to the out-of-state distribution of Oregon cannabis
Distribution
have aggregated to nearly $1.7 million from July 2017 through March 2018 at the Port of Portland
International Airport. In the same period of time, $861k worth of cannabis products were interdicted during
attempted exportation at the Port of Portland International Airport. Among in-bound monetary seizures, the
largest amounts originated from Chicago Illinois, Dallas Fort-Worth Texas, Atlanta Georgia, Phoenix
Arizona, and Los Angeles California – over $718k was seized from Chicago and Dallas alone. As of 2018,
Oregon cannabis products were found on multiple public internet markets (Online Classifieds), and
clandestine marketplaces online. The most commonly used digital currencies accepted by vendors of Oregon
cannabis on clandestine marketplaces were Bitcoin, Bitcoin Cash, Ethereum, Monero, and Litecoin.
Financial analysis of statewide regulatory reporting by financial institutions from Q-3 2017 indicates that
22.72% of all reported suspicious activity was cannabis-related.
Consumption Essential Elements of Information - On Pages 40 and 41
Between 2014 and 2016, statewide totals of Drug Recognition Expert (DRE) v examinations that resulted in a
Consumption
cannabis impaired opinion – all of which were validated by toxicological result – increased 66.28%, coming
to a total of 991 by 2016. From 2013 through 2015, among those of legal age to legally consume cannabis in
the state, the majority of cannabis-related DRE examinees fell between the ages of 21 to 31 years-old. In the
same period, however, roughly 20% of cannabis-related DRE examinees were under 21 years-old.
v.Drug Recognition Experts are police officers trained to recognize impairment in drivers under the influence of drugs other than, or in addition to, alcohol.
12Section III: A Risk Based Socio-Economic Analysis
Section Summary
This section presents finished intelligence findings related to the production, distribution, and
consumption of cannabis associated with Oregon through a socio-economic prism. This majority of the
analysis is centered on verifiable information and accessible data from the period after July 2015 — when
feasible.
Essential Elements of Information from Section
• Oregon has an estimated annual production capacity that exceeds 911,000 kg (2 million lb) – far beyond
the estimated annual consumption demands, which are between 84,400 to 169,000 kg (186,100 to
372,600 lb)
• In terms of value, Oregon’s estimated annual production capacity can yield roughly $6.7 billion worth of
cannabis (appraised internally).
• Following state-sanctioned cannabis legalization, Oregon had approximately 417,000 active cannabis
users – of all ages – of varying usage frequency.
• In the current state-sanctioned market, there is roughly one for grow site for every 25 users.
Production
• Between July 2015 and January 2018, the Oregon Burn Center spent $9.6 million for initial inpatient
care on cannabinoid extract burn victims.
• In the same period of time, law enforcement investigated 64 clandestine cannabinoid extraction
laboratories (all were operating illegally), 21 of which (33%) resulted in explosion or fire.
• As a result of overproduction, impoverished counties that are heavily engaged in the cultivation of
cannabis, such as Jackson, Josephine, and Lane, face a critical economic risk from collapsing cannabis
prices.
• Cannabis production is resource intensive, on average a mature plant consumes 22.7 liters of water daily
and a single kilogram of indoor finished flower requires 5.2 megawatt hours of electricity yearly,
resulting in the release of 4.5 metric tons of carbon dioxide.
• Due to historic use and the exponential growth of cannabis cultivation, the Rogue River Basin in
Southern Oregon is under acute hydrologic strain.
• As of August 2018, there are 574 retailers and 126 wholesalers actively licensed by OLCC, with an
additional 352 retailers and 223 wholesalers applications awaiting agency review.
Distribution
• Currently in Oregon, analysis indicates that there are higher concentrations of state-sanctioned cannabis
distributors in lower-income communities and historically disenfranchised areas – a potentially
temporary trend.
13Essential Elements of Information Continued
• The highest concentrations of recreational cannabis retailers are found in Multnomah, Lane, Marion, and
Jackson Counties.
Distribution
• Coinciding with the exponential growth of state-sanctioned cannabis markets, there has been an
aggressive expansion of sub-sector digital currencies tailored for cannabis services.
• In Q-3 of 2017 alone, at least $88 million related to the distribution of cannabis was routed through
financial institutions in Oregon.
• Among the roughly 417,000 cannabis users in Oregon, approximately 128,000 are multiple daily users.
• The single largest portion of cannabis users are between the ages of 25 and 44 (roughly 164,000
individuals); accounting for approximately 38,400 kg (84,600 lb) in annual consumption.
• Statewide, cannabis users consume an estimated 84,000 to 169,000 kg (186,100 to 372,600 lb) annually -
observations from OLCC fall within this range - a market valued at up to $1.3 billion in annual sales.
Consumption
• As of July 2018, according to figures published from the Oregon Department of Revenue, the state has
collected $173.1 million cumulatively in the last three fiscal years from “marijuana taxes.”
• A glut of cannabis stockpiles stemming from overproduction has caused a 50% annual price drop since
2016.
• Epidemiological research indicates that cannabis consumption is higher among medical users, who are
exempt from excise taxation.
• As of 2018, only 31% of available cannabis inventory was distributed, leaving 69% unconsumed within
the state-sanctioned recreational system.
14Analysis of Cannabis Production in Oregon
Production
Oregon continues to be a source of high-grade cannabis,
producing more than the state-sanctioned internal market
can consume. Although there is no singular source for Estimated Annual Total State
direct information on Total State Production (TSP) - both Production
legal and illegal - OR-ID HIDTA reviewed and analyzed Min = 440,000 kg Max = 911,500 kg
a mixture of indirect indicators to form a logical
estimate. Sources included publicly available information OLCC = 498,952 kg
from the Oregon Liquor Control Commission (OLCC)
Distribution
and registrant data from the Oregon Medical Marijuana
Program (OMMP), in addition to Law Enforcement
Sensitive (LES) data on illicit grow sites. The
culmination of these distinct sources resulted in a
probable estimate of annual TSP for 2016 and 2017. Calculated TSP
Using this model, Oregon can produce up to 911,500 kg
(approx. 2 million lb) of cannabis annually.1 –9 (See Figure 1)
Figures furnished by OLCC fall within the estimated Calculated TSC
Consumption
range, showing 498,952 kg (approx. 1 million lb) of
available inventory of “usable marijuana.”10 The value
of Oregon’s annual TSP rests at roughly $6.7 billion at
current average end-user prices in Oregon - calculated at
the time of the writing. 11, 12 (See Technical Appendix Section III)
A static snapshot of information reported by OLCC from Estimated Annual Total State Consumption
Min = 84,400 kg Max = 169,000 kg
August 2018 indicates that there are 1,073 active licensed
cannabis producers, with 1,282 pending applications OLCC = 154,221 kg
awaiting agency review.13 On May 30, 2018, OLCC
Figure 1: Comparison of Estimated Annual TSP and Estimated Annual
announced that applications received after June 15, 2018
TSC - See Technical Appendix for More Information; Includes Reported
would be delayed in order to process recreational license Observed Available Inventory and Distribution from 2018 OLCC Audit
renewals and previously submitted recreational license
applications.14Additionally, data from July 2018
indicates that there are 15,933 grow sites registered with
OMMP - down from 20,025 in January 2018.15 Current
1.Statistical Report. Accessed June 15, 2017. https://www.dea.gov/ops/cannabis_2015.pdf.
2.Crawford, Seth S. 2014. "Estimating the Quasi-Underground: Oregon's Informal Marijuana Economy." Humboldt Journal of Social Relations (36): 131.
3.Selsky, Andrew. 2018. "Tons of Legal Marijuana Leave Regulators Awash in Data." The Washington Post. April 26. Accessed April 26, 2018. https://
www.washingtonpost.com/business/technology/oregon-marijuana-lots-of-data-few-to-analyze-and-check-it/2018/04/26/e98eaf12-491f-11e8-8082-
105a446d19b8_story.html?noredirect=on&utm_term=.1c7841fbdc2c.
4.Oregon Liquor Control Commission. 2016. "Dispensary Survey Results: A Snapshot of Current Practices and Conditions." Accessed September 21, 2016. http://
www.oregon.gov/olcc/docs/commission_minutes/2015/DispensarySurveyResults.pdf.
5.Oregon Liquor Control Commission. 2018. "Oregon.gov." Marijuana License Applications. June 29, 2017. http://www.oregon.gov/olcc/marijuana/Documents/
mj_app_stats_by_county.pdf (accessed January 30, 2018).
6.Escondido, Nico. 2015. Nico's Nuggets: Plant Yields, Seeds and More. December 4. Accessed August 31, 2017. http://hightimes.com/grow/nicos-nuggets-plant-
yields-seeds-more/
7.Caulkins, Jonathan P. Estimated Cost of Production for Legalized Cannabis. Working Paper, RAND, 2010, Pg. 10.
8.Gettman, Jon. "Marijuana Production in the United States 2006." Drug Science Organization. 2006. http://www.drugscience.org/Archive/bcr2/estproc.html
(accessed September 5, 2017)
9.Oregon Health Authority. "The Oregon Medical Marijuana Program Statistical Snapshot [Series 2016—2018]." Oregon Health Authority Medical Marijuana
Program.
10.Oregon Liquor Control Commission. 2018. "Data Extracted from the Metrc Cannabis Tracking System." OLCC, May 1.
11.Drug Enforcement Administration. 2017. El Paso Intelligence Center. Accessed August 20, 2017. https://www.dea.gov/ops/intel.shtml#EPIC
12.Price of Weed. 2018. "Price of Weed, a Global Price Index for Marijuana." Price of Weed. January 5. http://www.priceofweed.com/
13.Oregon Liquor Control Commission. 2018. "Oregon.gov." Marijuana License Applications. August 1, 2018. http://www.oregon.gov/olcc/marijuana/Documents/
mj_app_stats_by_county.pdf (accessed August 6, 2018).
14. - "News Release." OLCC. May 30. Accessed August 6, 2018. https://www.oregon.gov/olcc/docs/news/news_releases/2018/Application_temp_stop_final.pdf.
15.Oregon Health Authority. "The Oregon Medical Marijuana Program Statistical Snapshot July 2018." Oregon Health Authority Medical Marijuana Program.
Accessed August 6, 2018.
15comprehensive data is not available on illicit cannabis
grow sites as Oregon chose not to apply for funding Ratio of Cannabis Users to State
Production
from the Drug Enforcement Administration's Domestic
Cannabis Eradication and Suppression Program (DCE/ -Sanctioned Grow Sites
SP). Nevertheless, as recently as 2016 over 26,000
plants were removed from 18 sites on public land Oregon Has
across the state.16 A mixed-methods analysis of self-
reported user rates from the Oregon Behavioral Risk
Factor Surveillance System (Oregon BRFSS) Oregon
Health Authority (OHA), National Survey on Drug Use
Distribution
and Health (NSDUH), and Oregon Student Wellness
Survey (OSWS), indicates that there are some 417,000
cannabis users in Oregon of varying frequency -
consistent with 10% of the state population estimates
from 2017.17 - 19 This information means that the ratio of
state-sanctioned grow sites to users has changed from
one to 19 in early 2018 to roughly one grow site for 1 Grow Site
every 25 users in August 2018. (See Figure 2) For Every
Consumption
As a commodity, the raw value of Oregon’s cannabis
production exceeds that of any other agricultural 25 Cannabis Users
commodity produced.20, 21 Yet, there is a scarcity of
precise information on employment rates involved in
cannabis production. The totality of cannabis
production in Oregon is opaque and crosses regulatory
boundaries, extending into the so-called “informal
marijuana economy.” 22, 23 According to information Single Annual Per-Plant Yield
from the Oregon Governor’s Cannabis Policy Advisor,
as of June 2017 there were over 12,394 OLCC “worker
permits” issued with wages anticipated to exceed $315
million annually before taxes and benefits - assuming 1.2 kg (2.64 lb)
consistent employment and uniform wage distribution. of Finished
24
Another estimate from former State Economist Beau 1 Plant Cannabis Flower
Whitney places average hourly wages in Oregon’s
“cannabis sector” at $12.13 hourly on the retail side.25 Figure 2: Ratio of Cannabis Grow Sites in Oregon Q-3 2018, Calculated Using
Health Survey Data and State Reported Statistics from OMMP and OLCC 16-18,
and 26
and Average Annual Per-Plant Yield - See Technical Appendix on Yield
16.Drug Enforcement Administration. 2015. 2015 Domestic Cannabis Eradication/Suppression Program Statistical Report. Accessed July 21, 2016. https://
www.dea.gov/ops/cannabis_2015.pdf
17.Dilley, Ph.D., M.E.S., Julia, Caislin Firth, M.P.H., Erik Everson, M.P.H., and Julie Maher, Ph.D. 2016. "Marijuana use, attitudes and health effects in Oregon."
Marijuana Report (Oregon Health Authority - Oregon Public Health Division) 22. https://apps.state.or.us/Forms/Served/le8509b.pdf
18.Oregon Health Authority. 2016. 2016 Oregon Student Wellness Survey. Annual Public Health Survey Results, Portland: Oregon Health Authority
19.Substance Abuse and Mental Health Services Administration. 2004 to 2014. National Survey on Drug Use and Health (NSDUH). Accessed October 2016. http://
datafiles.samhsa.gov/study-series/national-survey-drug-use-and-health-nsduh-nid13517
20.Mapes, Jeff. 2015. "Oregon's Big Marijuana Harvests: How Do You Bring All That Pot into the Legal Market?" Oregonlive/ the Oregonian. May 23. Accessed
August 31, 2017. http://www.oregonlive.com/mapes/index.ssf/2015/05/oregons_big_marijuana_harvests.html
21.Oregon Department of Agriculture. 2016. "Oregon Agriculture Facts & Figures ." United States Department of Agriculture - National Agricultural Statistics
Service. August. Accessed February 8, 2017. https://www.nass.usda.gov/Statistics_by_State/Oregon/Publications/facts_and_figures/facts_and_figures.pdf.
22.Crawford, Seth S. 2014. "Estimating the Quasi-Underground: Oregon's Informal Marijuana Economy." Humboldt Journal of Social Relations (36)
23.The Associated Press. 2018. "Oregon Officials Struggle to ID which Cannabis Grows Are Legal." Leafly. February 21. Accessed March 8, 2018. https://
www.leafly.com/news/politics/oregon-officials-struggle-to-id-which-cannabis-grows-are-legal.
24. Rhoades, Jeff. 2017. "Oregon Marijuana Regulation." Office of Oregon Governor Kate Brown. June 9. Accessed August 8, 2018. https://drive.google.com/file/
d/0BzMvBq_LbaUUbFpselFHTUxzMjA/view.
25.Ibid
16The distribution of OLCC and OMMP grow sites Adam Koh, of Cannabis Benchmarks, highlighted some
spans the state, with clustering around the potential causes driving cannabis prices to hit rock-
Production
Portland Metro Area and several of the most bottom in Oregon, including a lack of production limits,
poverty stricken counties.26—28 The most recent relative absence of vertical integration, and market
data from the United States Census Bureau overproduction.34 Meanwhile, a tangible cost derived
indicates that Oregon has a median household from cannabis production in Oregon arises from the
income of $53,270 and a per capita income in the illicit manufacture of cannabis concentrates - butane
last 12 months of $28,822, with 13.3% of hash oils (BHO). Open source and law enforcement
Oregonians living in poverty.29 The risk of price reporting indicate that there are many methods for
Distribution
collapse within the state’s cannabis market is a producing cannabinoid extracts and concentrates. The
particularly acute hazard in counties such as most common technique, however, employs the highly
Jackson, Josephine, and Lane, where median combustible solvent butane.35 From July 2015 through
household incomes fall between $38,000 and January 2018, there were 64 clandestine cannabis
$45,000 and unemployment rates range from 6.0% concentrate labs discovered by law enforcement
to 7.8%.30, 31 Josephine County was identified by personnel. 36 (See Figure 3) In the same period, the Legacy
the Oregon Secretary of State (OR SOS) as being Emmanuel Oregon Burn Center provided treatment to
Consumption
particularly vulnerable to financial distress and 71 BHO burn victims - costing upwards of $9.6
has the second highest number of total grow sites million.37 (See Figure 3)
(OMMP and OLCC) of any county in the state.
31—33
From July 2015 through January 2018
Figure 3: Total Number of
Burn Victims Resulting
from the Manufacture of
64 LE Discovered Clan
BHO and Associated Cost Cannabinoid Extraction Labs
of Initial Acute Care in
Oregon From July 2015
through January 2018 - See
Technical Appendix for
71 BHO Burn Victims
Analytic Procedures. Total Treated at OBC
Clandestine Cannabinoid
Extraction Labs Found in
Oregon as Reported to El
Paseo Intelligence Center
(EPIC) for July 2015
$9.6 Million in Inpatient
through January 2018. Initial Treatment Cost
26.Oregon Liquor Control Commission. 2018. "Oregon.gov." Marijuana License Applications. June 29, 2017. http://www.oregon.gov/olcc/marijuana/Documents/
mj_app_stats_by_county.pdf (accessed January 30, 2018).
27.Oregon Health Authority. "The Oregon Medical Marijuana Program Statistical Snapshot [Series]." Oregon Health Authority Medical Marijuana Program. Accessed
January 3, 2018.
28.United States Census Bureau. 2015. United States QuickFacts. July 1. Accessed August 23, 2016. https://www.census.gov/quickfacts/map/PST045215/00.
29.Ibid
30.Ibid
31.Atkins, Jeanne P, and Mary Wenger. 2016. Oregon Counties: 2016 Financial Condition Review. Audit Report, Salem, Oregon: Oregon Secretary of State.
32.Oregon Liquor Control Commission. 2018. "Oregon.gov." Marijuana License Applications. June 29, 2017. http://www.oregon.gov/olcc/marijuana/Documents/
mj_app_stats_by_county.pdf (accessed January 30, 2018).
33.Oregon Health Authority. "The Oregon Medical Marijuana Program Statistical Snapshot [Series]." Oregon Health Authority Medical Marijuana Program. Accessed
January 3, 2018.
34.Kennedy, Bruce. 2018. "Wholesale Cannabis Prices Tumbled in 2017 - And They Have Yet to Hit Rock Bottom." The Cannabist. March 8. Accessed March 10,
2018. https://www.thecannabist.co/2018/03/08/marijuana-prices-2017-cannabis-benchmarks/100103/.
35.Drug Enforcement Administration. 2016. 2016 National Drug Threat Assessment Summary. Annual Threat Assessment, U.S. Department of Justice - DEA: 119.
36.Drug Enforcement Administration. 2017. El Paso Intelligence Center. Accessed August 20, 2017. https://www.dea.gov/ops/intel.shtml#EPIC
37.Legacy Emmanuel Oregon Burn Center. 2013-2017. "BHO Burn Victims." Legacy Emmanuel Oregon Burn Center. Accessed 2016 and 2018
17Cannabis production requires the use of finite it has been estimated that cannabis cultivation facilities
natural resources, affecting the economic account for a power density equivalent to that of data
Production
sustainability of unrestrained cannabis cultivation centers and that illicit grow operations account for 1%
in the state.38—40According to research published of the U.S. average energy usage. 43 Even in terms of
in the Journal of Environmental Science and water consumption, definitive information varies about
Technology, cannabis cultivation consumes 5.2 the water needs of cannabis cultivation with estimates
MWh/y/kg of electricity and produces roughly ranging widely from 1 to 15 gallons daily.44 According
4.6 metric ton of CO2/kg of product.41 (See Figure 4) to research published by Scott Bauer, however, a
The researchers highlight the fact that no mature cannabis plant can consume upwards of 22.7
significant studies have been conducted on which liters of water per-day during the growing season –
Distribution
to base assessments of the probable consequences grape vines tend to use 12.64 liters of water per-day by
of large-scale cannabis production, leaving comparison.45 (See Figure 4)
information gaps on the potential impacts of this
industry on indoor and outdoor air quality from Although total environmental impact is a concern, the
highly reactive organic compounds. 42 Nationally, risk of water consumption and resource strain is acutely
Consumption
Relative Resource Consumption of Cannabis Cultivation
A Single Mature A single kg of indoor
Cannabis
Plant Consumes
Nearly Twice As
Much Water Daily as
- Releases 4.6
Tonnes of
Same as a
Passenger Car
in a Year
- Uses 5.2 MWh
Yearly 2X as Much as
a Refrigerator
22.7 liters/day 12.64 liters/day on Average in
Year
Figure 4: The resource requirements of cannabis production; comparative data on carbon dioxide from EPA and energy consumption from
EnergyStar 46, 47
38.Butsic, Van, and Jacob C Brenner. 2016. Cannabis (Cannabis Sativa or C. Indica) Agriculture and the Environment: A Systematic, Spatially-Explicit Survey and
Potential Impacts. Environmental Impact Summary, IOP Science: 1-2.
39.United States. Environmental Protection Agency. 1997. The Economics of Sustainability. Distance Learning Module, Washington D.C.: U.S. EPA.
40.Harkinson, Josh, Brett Brownell, and Julia Lurie. "24 Mind-Blowing Facts About Marijuana Production in America." Mother Jones. March/April 2014. http://
www.motherjones.com/environment/2014/03/marijuana-pot-weed-statistics-climate-change (accessed July 5, 2016).
41.Ashworth, K, and W Vizuete. 2017. "High Time to Assess the Environmental Impacts of Cannabis Cultivation." Environmental Science and Technology 2531-
2533.
42.Ibid
43.Ibid
44.Bauer, Scott, Jennifer Olson, Adam Cockrill, Michael Van Hattem, Linda Miller, Margaret Tauzer, and Gordon Leppig. 2015. "Impacts of Surface Water
Diversions for Marijuana Cultivation on Aquatic Habitat in Four Northwestern California Watersheds." PLoS One.
45.Ibid
46.United States Environmental Protection Agency. 2018. EPA - Green Vehicle Guide. March. Accessed July 4, 2018. https://www.epa.gov/greenvehicles/
greenhouse-gas-emissions-typical-passenger-vehicle.
47.EnergyStar. 2018. Energy Star Most Efficient 2018 - Medium, Large, and X-Large Refrigerators. Accessed July 4, 2018. https://www.energystar.gov/most-
efficient/me-certified-refrigerators.
18significant in areas of high-volume cannabis cultivation such as the Rogue River Basin. 48, 49 (See Map 1)
Research from the OR SOS found that there is scant reliable reporting and collection of water supply data -
only 20% of water rights holders are subject to mandatory reporting of consumption to the Water Resource
Production
Department.50 The SOS report also indicates that agriculture activities constitute an estimated 85% of water
use in the state, but are not subject to required reporting of water use. 51
Distribution
Consumption
Map 1 Geographic Distribution of State-Sanctioned Cannabis Cultivation Sites 2018 and the Distribution of Illicit Cannabis Cultivation sites 2011 through 2016
Plotted for Analysis of Hydrological Demand. From 2011 through 2016, Illicit Cannabis Cultivation Consumed an Average of 442,200 Gallons of Water Daily -
Worth 122 Olympic Swimming Pools
An additional aspect that merits consideration is the increasing corporatization and market consolidation of
cannabis production in the state, which may affect the boom in tax revenue.52 In an interview with GQ,
molecular and evolutionary biologist Mowgli Holmes emphasized the activity of BioTech Institute LLC,
which has been hurriedly registering highly restrictive utility patents on the cannabis plant. 53—55 The State’s
policy toward cannabis lacks economic protectionism for native companies in Oregon and has made it
possible for large out-of-state cannabis conglomerates to overrun local growers. 56 The combination of patent-
trolling and corporatization could dramatically change the market landscape in the near future – potentially
disrupting state tax revenue and impeding the long-term sustainability of small companies in Oregon.
48.Mann, Damian. 2016. "Officials Worry Water Will Go to Pot." Mail Tribune. December 19. Accessed December 26, 2016. http://www.mailtribune.com/
news/20161219/officials-worry-water-will-go-to-pot.
49.Drug Enforcement Administration (DEA). 2016. "Oregon Domestic Cannabis Eradication and Suppression Program (DCE/SP)." Reported Statistics 2011 to 2016.
DEA. Accessed November 18, 2016. https://www.dea.gov/ops/cannabis.shtml.
50.Atkins, Jeanne P, and Mary Wenger. 2016. Oregon Water Resources Department: Enhancing Sustainability Efforts and Agency Planning Needed to Better Address
Oregon's Water Supply Needs. Audit, Salem: Oregon Secretary of State.
51.Ibid
52.Kaplan, Jennifer. 2018. "Canadian Company Seeks to be the Starbucks of American Marijuana." The Cannabist. March 27. Accessed 30 March, 2018. https://
www.thecannabist.co/2018/03/27/canada-marijuana-golden-leaf-starbucks/102501/.
53.Janis, Mark D. 2001. "Sustainable Agriculture, Patent Rights, and Plant Innovation." Indiana Journal of Global Legal Studies 91-117.
54.Chicago Lewis, Amanda. 2017. "The Great Pot Monopoly Mystery." GQ. August 23. Accessed August 24, 2017. https://www.gq.com/story/the-great-pot-
monopoly-mystery
55.Korfhage, Matthew. 2017. "Portland Companies are Fighting a Secret Plot to Monopolize Cannabis." The Portlander - Willamette Week. December 20. Accessed
December 26, 2017. http://www.wweek.com/cannabis/2017/12/20/portland-companies-are-fighting-a-secret-plot-to-take-over-all-of-cannabis/.
56.Schaneman, Bart. 2018. "'Decimated' by Oversupply, Oregon Wholesale Prices for Outdoor-Grown Trim, Flower for Oil Drop to $50 a Pound." Marijuana
Business Daily. January 31. Accessed February 9, 2018. https://mjbizdaily.com/decimated-oversupply-oregons-wholesale-marijuana-prices-drop-50-pound/.
19Analysis of Cannabis Distribution
Related to Oregon
Production
As of August 2018, there are 574 retailers and instructive microcosm in this regard, where the majority
126 wholesalers actively licensed by OLCC, with of people live within “easy walking distance” of a
an additional 352 retailers and 223 wholesalers cannabis retailer, but are over a mile away from a full-
applications awaiting agency review.57 service supermarket.62 Considerable information gaps
Meanwhile, according to data from July 2018, on the socio-economic composition of Oregon’s
there are 15,592 “caregivers” registered with cannabis market remain. Thus, the micro-temporal
Distribution
OMMP.58 The highest concentrations of OLCC analysis of cannabis retailer concentrations should be
retailers are found in Multnomah, Lane, Marion, thoroughly studied, as there has been a concern voiced
and Jackson Counties.59 The social experiment of from within the cannabis market that the cannabis
state-sanctioned cannabis legalization is sector embodies disparity of opportunity.63
disproportionately manifesting in communities of Many businesses have developed a niche within the
lower socio-economic status - a trend that has cannabis sector by facilitating access to financial
been characterized as temporary.60, 61 While this services – vendor payment, payment processing,
Consumption
trend may be temporary, evidence indicates that depository services, and digital tokens. OR-ID HIDTA
there is a high concentration of cannabis retailers surveyed commonly used sector-specific digital
operating within communities of lower economic currencies and found that many offer services that allow
status, such as upper Northeast Portland. (See Map 2 retailers to circumvent banking regulations. PotCoin
& 3)
The Portland neighborhood of Parkrose is an (POT), CannabisCoin (CANN), DopeCoin (DOPE),
Map 2 and Map 3 Distribution Recreational Cannabis Retailers and Full-Service Grocery Stores in Northeast Portland and Parkrose Neighborhood
57.Oregon Liquor Control Commission. 2018. "Oregon.gov." Marijuana License Applications. August 1, 2018. http://www.oregon.gov/olcc/marijuana/Documents/
mj_app_stats_by_county.pdf (accessed August 6, 2018).
58.Oregon Health Authority. "The Oregon Medical Marijuana Program Statistical Snapshot July 2018." Oregon Health Authority Medical Marijuana Program.
Accessed August 6, 2018
59. Oregon Liquor Control Commission. 2018. "Oregon.gov." Marijuana License Applications. August 1, 2018. http://www.oregon.gov/olcc/marijuana/Documents/
mj_app_stats_by_county.pdf (accessed August 6, 2018).
60. McVey, Eli. 2017. "Chart: Recreational Marijuana Stores Are Clustered in Low-Income Areas of Denver, Seattle." Marijuana Business Daily. July 31. Accessed
April 1, 2018. https://mjbizdaily.com/chart-recreational-marijuana-stores-clustered-low-income-areas-denver-seattle/.
61.Smith, Phillip. 2017. "Why Are Pot Shops Mainly in Poor Neighborhoods?" The Daily Chronic. August 9. Accessed August 11, 2017. http://
www.thedailychronic.net/2017/75557/pot-shops-mainly-poor-neighborhoods/.
62.Diehl, Caleb. 2018. "In Some Portland Neighborhoods, It's Easier to Find Weed than Food." Oregon Business. February 2. Accessed April 3, 2018. https://
www.oregonbusiness.com/article/cannabis/item/18186-in-some-portland-neighborhoods-it-s-easier-to-find-weed-than-food.
63.Jan, Tracy, and Fenit Nirappil. 2017. "Battling the Racial Roadblocks to Joining the Legalized Marijuana Trade." The Washington Post. June 2. Accessed October
22, 2017. https://www.washingtonpost.com/business/economy/battling-the-racial-roadblocks-to-joining-the-legalized-marijuana-trade/2017/06/02/7321de02-416f-
11e7-9869-bac8b446820a_story.html?noredirect=on&utm_term=.5e06e822c506
20HempCoin (THC), and CannaCoin (CCN) are Cannabis Subsector Digital Currencies
among the most widely used.64 (See Figure 5) These BTC Blockchain ETH Blockchain
designer digital monies promise to reduce the
Production
cash-on-hand issue associated with commercial Value - $0.13
Value - $0.49
cannabis retailers. Yet, many of these digital Circulating
Market Cap -
Supply – PotCoin Nuvus
currencies “…aren’t well suited for consumer- 219,885,338 $48,921,980
end cannabis purchases…” due to the slow Token (POT) Token (GETX)
transaction time, high fees, and currency
volatility.65 The debit payment platform
CanPay debuted services in cannabis
dispensaries across Oregon in 2017, and links
Distribution
Value - $0.05 Value - $0.07
directly to a consumer’s bank account – Circulating Circulating
potentially reducing the risk of cash-intensive CannaCoin Supply – GreenMed Supply –
transactions and increasing financial data. 66 91,859,176 10,757,400
Token (CANN) Token
Information gaps exist on the extent of adoption (GRMD)
of CanPay among retail cannabis centers in
Oregon.
Consumption
Yet as the normalization of cannabis Value - $0.18
Value - $0.05
transactions continues to grow, there is an Circulating Circulating
DopeCoin Paragon
emergence of potentially suspicious financial Supply – Supply –
116,845,228 65,936,600
activity growing in parallel, bringing with it a Token (DOPE) Token (PRG)
wave of novel financial crimes. During the third
quarter of 2017 alone, information acquired
through regulatory reporting indicates that at
least $88 million related to cannabis retail sales
was routed through financial institutions in the Value - $0.11 Value - N/A
Circulating Circulating
state.67 In the same period, at least $2.7 million HempCoin
Supply – Chex Supply –Still
of cannabis related activity was routed through 230,478,760 in ICO
depository institutions for financial services Token (THC) Symbol (CHX)
related to the cannabis sector in Oregon.68
Revenue generated from cannabis distribution
continues to be placed into the licit economy by
a number of methods, some of which Value - $0.03 Value - N/A Agro Tech
misrepresent the nature of the source of funds Circulating Circulating Farms
to secure full access to financial services.69 Supply - Sativa Coin Supply – Still
7,092,478 in ICO
Endemic financial crimes can destabilize local Token (STV) Symbol (ATF)
economies by eroding stability in the state-
sanctioned legitimate cannabis sector.70
Figure 5: A Selection of Cannabis Subsector Digital Currencies Bases off BTC and ETH
Blockchains; Values Retrieved from Online Databases of Digital Currencies, May 2018
64.Krishna, Mrinalini. 2018. "Top 5 Marijuana Cryptocurrencies."
Investopedia. April 20. Accessed April 21, 2018. https://www.investopedia.com/news/top-marijuana-cryptocurrencies/.
65.Stangel, Matt. 2018. "Oregon Grew More Cannabis Than Customers Can Smoke. Now Shops and Farmers Are Left with Mountains of Unwanted Bud."
Willamette Week. April 19. Accessed April 24, 2018. http://www.wweek.com/news/2018/04/18/oregon-grew-more-cannabis-than-customers-can-smoke-now-shops-
and-farmers-are-left-with-mountains-of-unwanted-bud/.
66.Peterson, Susie. 2017. "Oregon Dispensaries Have a New Payment Solution." Daily Marijuana Observer. June 29. Accessed February 3, 2018. https://
www.dailymarijuanaobserver.com/single-post/2017/06/29/Oregon-Dispensaries-Get-a-Payment-Solution
67.Department of the Treasury Financial Crimes Enforcement Network. 2018
68.Ibid
69.Ibid
70.McDowell, John, and Gary Novis. 2001. "The Consequences of Money Laundering and Financial Crime." Economic Perspectives - An Electronic Journal of the
U.S. Department of State 6-8.
21Financial crimes frequently use front companies entities – undermining the free market principles of
to co-mingle funds and can offer products at legitimate business.72 Additionally, financial crimes
unreasonably low prices compared to legitimate can result in liquidity shortages at depository
Production
entities. 71 Effectively, this crowds out law-abiding institutions, leading to destabilization.73, 74
Fundamentals of “Cannabis Coins”
Purchaser Digital Wallet Digital Currency
Funds are Uploaded Exchanged for Cannabis Physical
Products Cannabis
Products
Distribution
Consumption
Cannabis Coin Exchange
Retailer Fiat Currency Converted
into Digital Coin
Figure 6: The Basic Exchange Cycle of a Cannabis Sector Digital Currency
Analysis of Cannabis Consumption in
Oregon
OR-ID HIDTA arrived at an estimate of the are estimated to annually consume between 84,000 kg
domestic cannabis user population using a mixed- to 169,000 kg (186,100 to 372,600 lb) of cannabis
methods analysis of self-reported user rates from (representing TSC) - worth between $623 million and
health surveys. According to these data sources, $1.3 billion in sales. 80, 81 Recent price drops in
there are roughly 417,000 cannabis users in cannabis, however, reveal a market volatility that could
Oregon of varying frequency that account for result in revenue reductions for businesses involved in
internal demand. 75, 76 The largest portion of users the cannabis sector, and, consequently, state tax
- ages 25 through 44 - are thought to annually revenue. As of July 2018, according to figures
consume roughly 38,400 kg (84,600 lb) of published from the Oregon Department of Revenue,
cannabis.77—79 In total, “active users” in the state “marijuana taxes” have generated $173.1 million
71.Quirk, Peter J. 1997. "Money Laundering: Muddying the Macroeconomy." Finance and Development 7-9
72.McDowell, John, and Gary Novis. 2001. "The Consequences of Money Laundering and Financial Crime." Economic Perspectives - An Electronic Journal of the
U.S. Department of State 6-8
73.Ibid
74.Quirk, Peter J. 1997. "Money Laundering: Muddying the Macroeconomy." Finance and Development 7-9
75.United States Census Bureau. 2015. United States QuickFacts. July 1. Accessed August 23, 2016. https://www.census.gov/quickfacts/map/PST045215/00.
76.Dilley, Ph.D., M.E.S., Julia, Caislin Firth, M.P.H., Erik Everson, M.P.H., and Julie Maher, Ph.D. 2016. "Marijuana use, attitudes and health effects in Oregon."
Marijuana Report (Oregon Health Authority - Oregon Public Health Division) 48. https://public.health.oregon.gov/PreventionWellness/marijuana/Documents/oha-
8509-marijuana-report.pdf.
77.Ibid
78.Conrad, Chris. A Guide to the Production and Use of Medical Marijuana. Industry White Paper, El Sobrante: Safe Access Now, 2015.
79.Kilmer, Beau, and Greg Ridgeway. 2016. "Bayesian Inference for the Distribution of Grams of Marijuana in a Joint." Drug and Alcohol Dependence 175-180.
80.Drug Enforcement Administration. 2017. El Paso Intelligence Center. Accessed August 20, 2017. https://www.dea.gov/ops/intel.shtml#EPIC
81.Pirce of Weed. 2016. Price of Weed, a Global Price Index for Marijuana . Accessed April 5, 2016 - April 5, 2018. http://www.priceofweed.com/.
22You can also read