THE CASE OF OBESITY PREVENTION IN ITALY - The Role of Communication in Public Health Policies
←
→
Page content transcription
If your browser does not render page correctly, please read the page content below
The Role of Communication in
Public Health Policies

THE CASE OF OBESITY
PREVENTION IN ITALY
Yevgeniy Goryakin, Michele Sechi Gatta,
Aliénor Lerouge, Thierry Pellegrini,
Michele Cecchini

July 2017
The Role of
Communication in Public
   Health Policies
 THE CASE OF OBESITY
 PREVENTION IN ITALY
The Role of Communication in Public Health Policies
         THE CASE OF OBESITY PREVENTION IN ITALY

REFERENCE: DI160109 (former DI151361)

 Authors: Yevgeniy Goryakin, Michele Sechi Gatta, Aliénor Lerouge,
 Thierry Pellegrini, Michele Cecchini

  This work is published on the responsibility of the Director of the OECD Directorate for
  Employment, Labour and Social Affairs. The opinions expressed and arguments employed herein do
  not necessarily reflect the official views of the Organisation or of the governments of its member
  countries.

  This document and any map included herein are without prejudice to the status of or sovereignty over any
  territory, to the delimitation of international frontiers and boundaries and to the name of any territory, city
  or area.

  © OECD 2017

  You can copy, download or print OECD content for your own use, and you can include excerpts from OECD publications, databases and multimedia
  products in your own documents, presentations, blogs, websites and teaching materials, provided that suitable acknowledgment of the source and
  copyright owner is given. All requests for public or commercial use and translation rights should be submitted to rights@oecd.org. Requests for
  permission to photocopy portions of this material for public or commercial use shall be addressed directly to the Copyright Clearance Center (CCC) at
  info@copyright.com or the Centre français d'exploitation du droit de copie (CFC) at contact@cfcopies.com.

                                                              Health Division

                                                              www.oecd.org/health

                                                              Directorate for Employment, Labour and Social Affairs
TABLE OF CONTENTS
EXECUTIVE SUMMARY .............................................................................................................................4
1. Background ..............................................................................................................................................6
2. Communication policies: what are the options? ......................................................................................6
3. A quantification of the effectiveness of interventions .............................................................................9
i) Food labelling .......................................................................................................................................9
ii) Regulation of advertising of unhealthy products to children .............................................................11
iii) Restaurant menu labelling ................................................................................................................14
iv) Prescription of physical activity by primary care physicians............................................................16
v) Mass media campaigns ......................................................................................................................18
vi) Smartphone Apps ..............................................................................................................................21
4. Main results............................................................................................................................................24
5. Case studies in communicating healthy lifestyles in OECD and beyond ..............................................31
i) The Change4Life mass media campaign: a case study from the United Kingdom ............................31
ii) Smartphone Apps to tackle obesity: a case study from Singapore ....................................................33
iii) A comprehensive multi-stakeholder mass media campaign: a case study from Italy ......................34
6. Conclusions and key policy implications...............................................................................................36
ANNEX 1 ......................................................................................................................................................37
REFERENCES ..............................................................................................................................................38
THE ROLE OF COMMUNICATION IN PUBLIC HEALTH POLICIES © OECD 2017 3EXECUTIVE SUMMARY
This paper evaluates the evidence on the effectiveness of communication-based strategies to
prevent obesity, unhealthy diets and physical inactivity. Specifically, the attention is focused on the
enforcement of regulation of food advertising to children; on the implementation of food labelling
schemes; on the introduction of menu labelling programmes in restaurants; on the introduction of physical
activity prescriptions in the primary care sector; on the broader use of public health campaigns; as well as
on encouraging healthy behaviours with the help of smartphone applications.
The reviewed evidence suggests that nutrition labels (both for foods sold in shops and in
restaurants) are generally perceived as a highly credible source of information, and that they are effective
in prompting consumers to make healthier food choices. Almost all OECD countries mandate the use of
nutrition labelling on packaged foods, although the content and design of the mandatory labels varies
between them.
In addition, there is ample evidence that regulation of food advertising is an important driver of
food purchasing behaviour. Using information from nine experimental studies on children, the OECD has
modelled an impact of a total ban of food advertising targeting children below 18 years of age on
television, finding that for every 1% decrease of food commercials, there is a 0.99% reduction in calorie
intake. Based on the average exposure to food advertisements by children living in OECD countries, a ban
would potentially result in 4.16% reduction in total calorie consumption and about 1.86% reduction in
body weight. The review also suggests that there is a positive impact of physical activity (PA) prescriptions
on at least physical activity and BMI, although the evidence for other outcomes (e.g. blood pressure,
diabetes) is more limited.
There are also numerous public health campaigns to increase public awareness about healthier
nutritional choices in OECD countries, for example promoting fruit and vegetable consumption. A
qualitative analysis was conducted of the impact of Change4Life (C4L) - an ongoing social marketing
campaign established in 2009 in the UK to create awareness about tackling the obesity problem, through
the promotion of healthy food choices and physical activity. Preliminary results suggest that the campaign
was successful in reaching its target audience; that their logo is well recognized; that there was positive
impact on the propensity of participants to switch to healthier foods.
The impact of these interventions on the health of the Italian population was carried out by using
a newly built microsimulation model, assuming the start of the interventions in 2018 and their continuation
until 2100. Food and restaurant menu labelling interventions were found to be the most cost effective, by
having a large impact on the number of years lived without disease, as well as by having positive effect on
health expenditures. On the other hand, mass media campaigns, smartphone apps and advertising
regulations were less cost effective, although still representing value for money based on the conventional
cost effectiveness thresholds.
This paper has demonstrated that several communication interventions can be very cost-effective,
in particular in the context of Italy, where people eat out more regularly than in many other countries. In
particular, based on the assumption that approximately 50% of people older than 20 respond positively to
the intervention, menu labelling intervention was found to be approximately as cost-effective as food
labelling; not only generating large gains in years lived without disease, but also potentially leading to big
savings in health expenditures over time. Several other interventions, such as restricting food and beverage
advertising targeting children on TV; smartphone applications and mass media campaigns promoting
physical activity are also potentially very cost-effective.
THE ROLE OF COMMUNICATION IN PUBLIC HEALTH POLICIES © OECD 2017 4In all cases, the impact of the interventions will take some time to materialize, which is especially true for the advertising campaign and smartphone apps, which are projected to become cost-effective only a few decades after their implementation. Prescribing physical activity by physicians was the only intervention not found to be cost-effective, which was mainly due to the limited coverage of this intervention, as well as its focus on middle-aged people who already have risk factors predisposing them to ill-health. Nevertheless, this conclusion was based on certain assumptions about the costs of running the intervention (i.e., about 90 Euros per targeted person). The intervention may become cost-effective if it is run more efficiently than assumed in the model. THE ROLE OF COMMUNICATION IN PUBLIC HEALTH POLICIES © OECD 2017 5
1. Background

1.         Communication-based approaches represent a significant share of disease prevention policies put
in place by OECD countries, and may take a number of forms. For example, they can be employed as part
of health promotion and social marketing campaigns aimed at changing behaviours adversely affecting
health. They can also be used to support other disease prevention policies, such as enforcement of drunk-
driving laws, as well aid health education campaigns targeting specific population groups such as school
children or vulnerable groups. Communication strategies may also involve policies designed to regulate
and restrict exposure of the public to the commercial marketing of potentially harmful products.

2.       Although recently there has been a great increase in the use of communication strategies to
prevent chronic illnesses, the evidence on their effectiveness and economic value is lacking. In this project,
the OECD studies health and economic impact of communication programmes targeting prevention of
obesity, unhealthy diets and physical inactivity. The evidence on the policy impact of various
communication interventions comes from a variety of sources, some of which provide inputs to the newly
built population-level microsimulation model. Although the project focuses on Italy, the analyses rely on
evidence collected for other OECD countries as well.

3.        This paper starts with a review of the effectiveness of various communication policies to prevent
chronic diseases. The quantitative evidence collected was used to feed the microsimulation model, which
in turn generated estimates of (cost)-effectiveness impact of these policies in preventing various adverse
health events. A qualitative analysis of case studies of policies implemented in several high-income
countries, with the objective of identifying key factors underpinning the success of the selected policies,
was conducted.

4.         The remainder of this report is structured as follows. Section 2 discusses existing options for
communication-based public health interventions. Section 3 summarizes evidence on their effectiveness
and cost-effectiveness. Section 4 describes three cases studies to analyse drivers of success in the
implementation of best practices. Section 5 discusses policy implications of this analysis, and outlines the
next steps.

2. Communication policies: what are the options?

5.         Information and communication policies can potentially play an important role in affecting health
outcomes. For example, there is widespread consumer interest in EU countries concerning the nutrition
information on food packages (Grunert and Wills, 2007). There is also evidence that consumers adjust their
behaviour when given relevant health-related information. For example, in Spain, high correlation was
found between nutritional label use and healthier food purchases (Barreiro-Hurlé et al., 2010). In China,
people diagnosed with hypertension reduced their fat intake per day by 7.7g upon receiving relevant health
advice (Zhao et al., 2013, Hollands and Marteau, 2015). Children and adolescents are particularly
vulnerable to the influence of unhealthy foods advertising, which is why it is often subject to additional
restrictions (Lau et al., 2011).

6.        Table 1 presents a summary of the main communication policies that have been identified in this
paper, which can be divided into the following 6 broad categories: i) food labelling; ii) media restrictions;
iii) public health campaigns; iv) nutritional advice and counselling; v) parental education and school
curriculum; vi) advising in the workplace.

THE ROLE OF COMMUNICATION IN PUBLIC HEALTH POLICIES © OECD 2017                                             6
Table 1. Overview of communication policies to reduce obesity

         Food labelling
                                               Nutrient lists on food packages
         Nutrition label standards and         Clearly visible ‘interpretive’ and calorie labels
         regulations on the use of health      Menu labelling
         claims and implied claims on foods    Shelf labels
                                               Rules on nutrient & health claims
         Media restrictions
                                               Restrict advertising to children that promotes unhealthy diets in
                                               all forms of media
         Restrict food advertising and other   Sales promotions
         forms of commercial promotion         Packaging
                                               Product placement
                                               Sponsorship
         Public-health campaigns
                                               Mass media
                                               Social marketing
         Inform people about food and
                                               New technology (mobile app)
         nutrition through public awareness
                                               Education about food-based dietary guidelines
                                               Community and public information campaigns
         Clinic-based counselling
                                               Nutrition advice for at-risk individuals
                                               Prescribing exercise as preventive therapy
         Nutrition advice and counselling in
         health care settings                  Telephone advice and support
                                               Clinical guidelines for health professionals on effective
                                               interventions for nutrition
         Parental education and school curriculum
                                               Nutrition education programme (parents and children)
         Give nutrition education and skills   Food production skills
                                               Cooking classes (parents and children)
         Advising in the workplace
         Set standards in specific settings    Workplace health schemes with physical activity
Source: OECD analysis, 2016

7.          The main messages for each of these categories are as follows:

     •      Food-labels can be an effective, cost-effective and highly credible source of information for
            shoppers (Sacks et al., 2011, Campos et al., 2011). For example, a review of 58 studies conducted
            in 2003–2006 in the EU-15 countries found that there was widespread consumer interest in
            nutritional information on food packages (Grunert and Wills, 2008). Another review concluded
            that food labelling was associated with an approximately 18% increase in the number of people
            selecting healthier food products (Cecchini and Warin, 2016). Some evidence also demonstrates
            the positive impact of menu labelling in restaurants on healthier food choices (Pulos and Leng,
            2010, Morley et al., 2013) as well as public support for such policies (Mah et al., 2013).

THE ROLE OF COMMUNICATION IN PUBLIC HEALTH POLICIES © OECD 2017                                                    7
• Food advertising is an important driver of food purchasing behaviour and dietary intake, and
therefore it is often subject to regulatory interventions. At present, almost all restrictions on the
nutrition-related advertising apply to the marketing of foods and beverages for children and
young adults, with a number of OECD countries tightening their regulation since 2011 (OECD,
2015). Studies suggest that statutory restrictions on commercial food advertising and promotion
can have a significant effect on dietary intake, as in Quebec, where implementation of this policy
was followed by a reduction in calorie consumption at fast-food restaurants of between 5.6
billion and 7.8 billion per year (Dhar and Baylis, 2011). Another study in Australia concluded
that banning TV advertising for energy-dense foods during children’s peak viewing times was
highly cost-effective (Magnus et al., 2009). On the other hand, a recent systematic review
concluded that voluntary pledges to restrict high-calorie advertising may not be as effective in
reducing exposure of children to advertisements, which may be due to the lack of enforceability
or penalties for non-compliance (Galbraith‐Emami and Lobstein, 2013).
• A number of public health mass media campaigns to increase public awareness about healthier
nutritional choices have recently been launched in OECD countries. For example, there is almost
universal governmental promotion of fruit and vegetable consumption, not only of the well-
known “5 a day” target (e.g. Chile, Germany, Italy, Mexico, New Zealand, Spain) but also of "6 a
day" (Denmark), " 2+5 a day" (Western Australia), “Fruits & Veggies – More Matters” (United
States) or “5-10” (France) (World Cancer Research Fund International, 2016). In France, the
public health campaign “Eat Move” has been implemented since 2001 and is part of the National
Nutrition and Health Programme (PNNS), spreading messages through mass media,
informational videos, home advertising and a website (Manger Bouger, 2016). Still, empirical
evidence on the effectiveness of these campaigns is limited. One recent example includes the
Australian “LiveLighter” campaign, which has been encouraging healthy eating and being
physically active with the help of free resources such as healthy recipes, meal and activity
planner since 2012. The evaluation of the programme found increased and sustained levels of
population-level awareness, compared to other obesity campaigns. The campaign was also found
to be well-targeted (Morley et al., 2016).
• In recent years, public health promotion campaigns have increasingly been delivered through
innovative communication channels, such as online marketing, social networks (e.g. Facebook or
Twitter), or mobile applications. As this is only a recent development, rigorous long-term
evaluations of these campaigns is still lacking. However, some evidence indicates that they can
be effective. For example, about 58% of individuals targeted by the “Change4Life” (a health
promotion campaign carried out in the UK) switched to lower fat dairy products, compared to
26% in the comparison group. In addition, a recent systematic review and meta-analysis
concluded that the use of a mobile phone applications was related to a significant decrease in
body weight of about 1 kg, corresponding to a drop in body mass index (BMI) of about 0.43
kg/m2 (Mateo et al., 2015).
• Other communication-based interventions include nutrition counselling; education on the benefits
of healthier lifestyle; as well as prescriptions of sessions of physical activity by healthcare
workers. A recent meta-analysis found that school-based lifestyle interventions can lead to
reduction of BMI of 0.054 kg/m2 (Oosterhoff et al., 2016). Worksite interventions can aim to
achieve nutrition improvements through changes in the selection of daily menus and snacks,
integrated with a promotion of physical activity through discounts or reimbursement of health
club annual fees. Thus, a two year Seattle-based multicomponent worksite program was found to
increase consumption of fruit and vegetables by 0.3 servings a day (Afshin et al., 2015).
THE ROLE OF COMMUNICATION IN PUBLIC HEALTH POLICIES © OECD 2017 83. A quantification of the effectiveness of interventions 8. Based on the results of the review presented in section 2 of this report (Table 1), our focus is on selected number of policies, including i) enforcement of regulation of food advertising to children; ii) implementation of food labelling schemes; iii) introduction of menu labelling programmes in restaurants and cafeterias; iv) introduction of physical activity prescriptions in the primary care sector; v) broader use of public health campaigns; and vi) use of mobile apps. The reminder of this section describes, for each of the policies mentioned above, the characteristics of the modelled intervention, the process to collect and evaluate its effectiveness and the key drivers underlying the implementation costs. i) Food labelling a) General introduction 9. Almost all OECD countries mandate the use of nutrition labelling on packaged foods. The exceptions are South Korea, where the lists have to be provided for selected food categories only; Switzerland, where labelling is mandatory only for food sold in the EU; and Turkey, where labelling is mandatory only where a health claim is made. In the EU, Regulation 1169/2011 on the "Provision of Food Information to Consumers” has required that the following nutrients be listed at the back of the pack of most pre-packaged foods from 2016: energy value; the amounts of fat, saturates, carbohydrates, sugars, protein and salt. However, the content and design of the mandatory labels varies between countries, whereby some require information on added sugars or trans fats at the back of the panels, and others mandate special front package labelling of high salt content foods. 10. In addition to mandatory schemes, some voluntary initiatives have also been adopted recently. For example, in 2013 “Health Star Rating” front of pack (FoP) labelling initiative was approved in Australia, which requires participating businesses to disclose several macronutrients on packaging, both potentially harmful to health (energy, saturated fat, sodium and total sugars), and beneficial (fruit and vegetable content, dietary fibre and proteins). On the basis of this information, stars are assigned, ranging from 1 (least healthy) to 5 (most healthy). In Denmark, Norway and Sweden, the “Keyhole Labelling System” was launched in 2009, with stricter criteria coming into force in 2015. When a product has less fat, less sugar, less salt, more dietary fibre and whole grain, compared to other foods of the same type, the companies are allowed to put a keyhole logo on the front of the pack, assuming one or more of these criteria are met. One study found that about 95% of consumers were aware of the Keyhole Logo in Sweden, and that its purpose was also broadly understood, and could be used correctly to identify healthier food options within the same product category (Grunert and Wills, 2008). b) Selection of the evidence 11. Selection of evidence to model the effectiveness of food labelling interventions is based on a recent systematic review by Cecchini and Warin (2016), who measured the effect of food labelling on the selection of healthier products, and on calorie consumption, by meta-analysing data from nine randomized trials. They also studied the effect of traffic-light schemes, a particularly easy-to-interpret food labelling system based on three colours to identify the amounts of unhealthy nutrients in the product, on food choices made. c) Characteristics of the intervention; 12. The modelled intervention consists of statutory policy changes, requiring all manufacturers/retailers to provide information on the nutritional composition of foods sold in stores/supermarkets. Such information should either include nutrient lists, for example “informative” calorie labels, or clearly visible “interpretive” labels. This type of labelling aims to inform consumers THE ROLE OF COMMUNICATION IN PUBLIC HEALTH POLICIES © OECD 2017 9
about the nutritional value of food products, and may either warn about potentially negative issues (e.g. on
salt, sugar, saturated fats content), as well as highlight positive aspects (such as about dietary fibre and
protein content). As a rule, it is applied to pre-packaged products, and may be attached to the front [i.e.
front-of-pack (FOP)] or to the back [i.e. back-of-pack (BOP)].

d) Effects of the interventions

13.        In a recent meta-analysis of randomized studies conducted by OECD (Cecchini and Warin,
2016), food labelling, relative to no intervention, was estimated to increase the average number of people
making a healthier food choice by about 18% (CI: +11.24% to +24.66%). In addition, it was found that
traffic lights were more effective [an increase of 29% (CI: 19.73% to 39.00%)] than other food labels [an
increase of 15% (CI: 3.56% to 25.82%)] and Guideline Daily Amount (GDA) schemes (an increase of
12%; CI: 5.43% to 18.28%). Food labelling interventions were also found to lead to a reduction in average
calorie intake by 3.59% (Cecchini and Warin, 2016), although the effect was not statistically significant
(CI -8.9% ; + 1.2%).

14.       Based on this information, food labelling was modelled to lead to a decrease in the average
calorie intake by about 3.59%. However, the confidence intervals on this estimate are wide (between -
8.9%; to +1.2%). In addition, this evidence only applies to shopping in supermarkets, and excludes calories
consumed while eating out (in Italy, 80% of people are assumed to eat out at least once a week), as well as
food purchased in smaller shops/farmer’s markets. Therefore, we have made a simplifying assumption that
this reduction will apply to 50% of calories consumed, i.e. the intervention will reduce calorie intake by
1.8%.

15.     As our model relies on the impact of interventions on BMI (rather than calories consumed), we
have used the following tool to convert energy intake changes into changes in BMI, by implementing
methodology described in the Lancet article “Quantification of the effect of energy imbalance on
bodyweight” (Hall et al., 2011): https://www.supertracker.usda.gov/bwp/index.html.

     •    Based on the average adult characteristics for Italy, a 1.8% reduction in energy intake over 100
          days was estimated to lead to about 0.88% lower BMI. An important point is that this reduction is
          not absolute, but relative to the counterfactual of no intervention.

     •    After 100 days, the participants’ new BMI is modelled to continue in parallel to the
          counterfactual old trend, but on a lower level, until the end of life. In other words, we assume that
          people will not only get used to processing the food labelling information during the introductory
          period of 100 days, but also will maintain this habit until the end of their life.

     •    The eligible population are everyone older than 20, but only two thirds of the population are
          assumed to be affected by the intervention (i.e. to read and act upon the information that will be
          on the food label).

     •    The cost is assumed to be 0.92 Euros per capita (constant 2017 Euros). It includes expenses on
          policy administration, planning and enforcement in the form of food inspections, but does not
          account for the additional costs associated with designing and printing nutrition labels and for the
          potential cost associated with the reformulation of certain foods, likely to be borne by the private
          sector.

     •    The intervention is modelled to last from the beginning of 2018 until the end of 2099.

THE ROLE OF COMMUNICATION IN PUBLIC HEALTH POLICIES © OECD 2017                                              10
ii) Regulation of advertising of unhealthy products to children a) General introduction 16. Consumption of unhealthy foods may contribute to the development of overweight and obesity, and food marketing represents a key factor that incentivises the consumption of high-calorie and nutrient- poor foods through persuasive messages (Adams et al., 2012b). As children are usually not fully aware of marketing intent, and are incapable of critically interpreting marketing messages, regulating food advertising for them is often of particular importance. More persuasive techniques of marketing for children are developed through product placement in TV programmes, movies or in toys. There exist numerous examples of character licensing, celebrity endorsements or cellular-telephone text messages to influence children audience’s choices (Nestle, 2006). 17. Food advertisements can be streamed through a variety of media, both traditional (e.g. television or radio) and modern (e.g. social network and mobile apps) (Chambers et al., 2015). However, despite the public health guidance put in place by the World Health Organization (2010b), only relatively few countries have implemented advertising restrictions to preserve healthy diet for children (Boyland et al., 2016). In the OECD, seven countries have tightened such restrictions since 2011, focussing mostly on marketing of potentially unhealthy foods and sweetened beverages directed to children and young adults (OECD, 2017). Some food manufacturers have adopted self-regulation, but it has been argued that it is not always sufficiently effective (Galbraith‐Emami and Lobstein, 2013). b) Selection of the evidence; 18. Several systematic reviews, summaries of evidence and meta-analyses (Boyland et al., 2016, Sadeghirad et al., 2016, Chambers et al., 2015, Cairns et al., 2013, Jenkin et al., 2014, Sonntag et al., 2015) have been selected as evidence to analyse the impact of food advertising bans. Sadeghirad et al’s (2016) meta-analysis of randomized control trials (RCTs) indicates that exposure to unhealthy food marketing is related to an increase of dietary intake by about 30.4 kcal. Boyland’s (2016) systematic review and meta- analysis likewise suggests that unhealthy food advertising increases food intake by the standardized mean difference of 0.37. Chambers (2015) concluded that statutory regulations of advertising can reduce the children's exposure to advertising for unhealthy foods, while the evidence on the impact of self-regulatory approaches is more varied. Cairns (2013) presented a retrospective summary of evidence, concluding that “there is a convergence of evidence […] indicating marketing is modifiable risk factor for children’s health”. 19. Other literature reviews and qualitative reports have also been analysed, e.g. (Kelly and King, 2014, Cairns et al., 2009, Hastings et al., 2003, Hastings et al., 2006, Livingstone, 2006, Dalmeny et al., 2003, Escalante de Cruz et al., 2004, McGinnis et al., 2006). Their analysis broadly supports the above- mentioned conclusions. c) Characteristics of the intervention; 20. The intervention being modelled was defined as a total statutory ban of food advertisement on television, targeting children below 18 years of age, with the intent of limiting their consumption of unhealthy food. The intervention is assumed to be initiated by a government, and may include both regulatory and enforcement components, to support maintenance of healthier dietary patterns among children. 21. Similar interventions are already in place in Iceland, Sweden and Norway, through policies focussing on children under 12 years of age (World Health Organization, 2013). Chile, with a law fully implemented in 2016, combines advertising and food labelling restrictions at a school level, more recently THE ROLE OF COMMUNICATION IN PUBLIC HEALTH POLICIES © OECD 2017 11
extending the advertising restriction to other media (e.g. cinemas, radio and on the internet). Countries
such as Ireland and Mexico have implemented a ban on unhealthy food advertising in TV programs for
children. France has established that any potentially unhealthy food and beverage advertising must be
accompanied by a message emphasizing principles of dietary education (World Cancer Research Fund
International, 2016).

d) Effects of the interventions;

22.        Boyland’s systematic review and meta-analysis (2016) of nine laboratory or school-based
experiments represents the best evidence to translate food advertising bans into children’s calorie intake
change. Girls and boys were randomly selected at school and in summer camps: one group was exposed to
unhealthy food or non-alcoholic beverage advertising on television, and another to non-food advertisement
or a no-advertisement control. The maximum exposure time could vary between 10 and 40 minutes, with
food commercials not to exceed 5 minutes. This is consistent with analysis by Kelly (2010), who found
that, on average, there were maximum five food commercials per hour, totalling 2.5 minutes per hour.

23.        We assume that a ban of advertising would produce, over a one year period, a reduction of
calorie intake in children equal to a situation with non-exposure to advertisement on TV. Based on the
evidence identified in the paper by Boyland (2016), an advertising scenario ban would result in a decrease
of children’s calorie intake of 26.9% in a random effects model (95% confidence interval [CI] 9.6 to 44.2).
However, such a decrease is based on an average exposure to food advertising corresponding to about 27%
of total screen time, which is significantly higher than the average exposure in the real world. For this
reason, we modelled a meta-regression (Figure 1) where the percentage of unhealthy TV announcements
on total stream time was added as an explanatory variable. The rate outcome of 0.99 [95% CI: 0.17 to 1.80]
explains that for every 1% increase of food commercials as screen time, there is a 0.99% rise of calorie
intake.

24.       Kelly et al (2010) found that on average, across 11 (mostly OECD) countries, there were five
food advertisements per hour per channel. Assuming each advert takes about 30 seconds, the advertising
exposure corresponds to approximately (5*30)/3,600= 4.2% of total streamed viewing time. Next,
according to our meta-regression, reducing this exposure to zero would result in 4.2%*0.99= 4.16%
reduction in total calorie consumption, or in 1.86% reduction 1 in body weight 2 (Swinburn et al., 2006).
Finally, given the distribution of height and weight among children in the UK 3, this reduction would
correspond to about 0.31 kg/m2 lower average BMI among this group. This is also consistent with a
previous OECD study (Sassi, 2010a), where a reduction of BMI of between 0.13 to 0.34 kg/m2 among
children was estimated.

25.       Results in other studies mostly agree with this analysis. Andreyeva (2011) estimated that TV
advertising increases children’s soft drink consumption by 9.4%, with a confidence interval that is close to
the one analysed (CI 4.3 to 14.5) 4. Magnus (2009) demonstrated how removing television advertising of
high-fat and/or high-sugar food and beverages to children reduces the probability of consuming energy-
dense and nutrient-poor food by 13% (CI 3 to 25), and decreases the likelihood of sweetened beverage
consumption by 4% (CI 1 to 8). Furthermore, Magnus (2009) estimated that the modelled intervention
would produce a reduction of 3% in the total daily energy intake 5, in line with Veerman (2009) study

1 According to Swinburn et al (2010), a 10% reduction in energy balance among children would lead to 4.5% reduction in body weight.
2 Given that the height is fixed, this also corresponds to 1.86% reduction in BMI.
3 http://www.rcpch.ac.uk/improving-child-health/public-health/uk-who-growth-charts/uk-who-growth-charts-0-18-years
4 Remember that our estimates predict that a ban on advertising would result in 4.16% drop in total calorie consumption- close to the lower bound of the above
confidence interval.
5 Again, this value is close to our estimated value of 4.16% drop in total calorie consumption which would result from the total advertising food ban for children.

THE ROLE OF COMMUNICATION IN PUBLIC HEALTH POLICIES © OECD 2017                                                                                                       12
where a total ban “would decrease total consumption by 4.5%”. It’s also notable that despite being
estimated with different methodologies, the implied elasticities of BMI with respect to changes in energy
are very close under food labelling and advertising restriction scenarios: in the former, it is 0.47, and in the
latter it is 0.45.

26.      Based on our meta-regression study, restricting food advertising to children aged between 5 and
18 is expected to result in the decrease of average BMI by 0.31 kg/m2. The following time pattern is
assumed in the microsimulation model:

      •                 Gradual change in BMI with full effect reached after 1 year: -0.12 for children between 5 and 12
                        years (reached at 6 for most, then constant until 12), -0.31 between 12 and 18 years (reached at
                        13 for most then constant until 18).

      •                 The new BMI is parallel to the upward trend that would have happened without the intervention.

      •                 When children (previously exposed) reach the age of 18, they have linear decrease of
                        effectiveness until reduction of BMI to 0.155 compared to counterfactual of no intervention,
                        over 1 year, which then stay for the rest of life

      •                 It is expected that the intervention will last from the beginning of 2018 till the end of 2099.

      •                 The cost of the intervention is assumed to be 0.41 Euros per capita, i.e. it will apply to everyone
                        in the population in the intervention scenario, and not just to children. This cost will include
                        expenses on administration and planning at the national and local levels, as well as monitoring
                        and enforcement costs. In addition, minor training may be required for communication authority
                        staff charged with the task of overseeing the implementation of the scheme.
                                                                 Figure 1. Meta-regression for the impact of regulation of advertising

                                                       125
          Additional cal intake as share of baseline

                                                       100

                                                       75

                                                       50
                              (%)

                                                       25

                                                        0

                                                       -25

                                                       -50
                                                             0               10               20              30             40          50
                                                                                  Food advertisement as share of screen time (%)

Note: the colour of the dots provides information about the contribution of each study in determining the meta-regression coefficient.
The value of each study is weighted according to the number of participants. Studies with a higher number of participants have a
higher weight compared to studies with a smaller sampling size. Red dots represent the three studies with the highest weight; violet
dots represent the three studies with intermediate weight; while yellow dots represent the three studies with the lowest weight.
Studies have similar weights: average weight 11.1% (min 6.5% and max 13.9%).
Source: Authors' analysis on Boyland (2016)

THE ROLE OF COMMUNICATION IN PUBLIC HEALTH POLICIES © OECD 2017                                                                               13
iii) Restaurant menu labelling a) General introduction 27. Nutritional labelling of restaurant menus can be another instrument to empower health-conscious consumers 6. In the UK, as of 2016, 45 businesses voluntarily committed, as part of the Government’s Responsibility Deal, to providing nutritional information on their menus (World Cancer Research Fund International, 2016). In USA, all chain restaurants 7 will be required to clearly show calorie information on their menus in 2017 (World Cancer Research Fund International, 2016). Several municipalities and states in the US are already implementing related legislation. For example, in New York, chain restaurants are required to put a warning label for dishes that exceed 2,300 mg of sodium. In addition, from mid-2018, these regulations will also cover vending operators of at least 20 machines (World Cancer Research Fund International, 2016). In Australia, several states introduced legislation in 2016 requiring fast food outlets of certain size to display the energy content of their menu items (World Cancer Research Fund International, 2016). In Ontario, Canada, restaurants and other venues selling hot foods, with at least 20 locations, have been required to list calorie counts on their menus since January 2017 8. 28. After the introduction of labelling in six full-service restaurants in the Washington State, USA, there was a small drop of about 15 calories and 1.5 grams of fat per entrée sold (Pulos and Leng, 2010). This was also true for the chain restaurants there, as the introduction of labelling on the menus was found to lead to a significant decrease in the average amount of calories per purchase both in food and coffee chains, especially among women (Krieger et al., 2013). In Victoria, Australia, consumers who were exposed to menu labelling information selected meals with about 120 kcal lower energy content compared to the reference unexposed group (Morley et al., 2013). On the other hand, there was little evidence that the introduction of menu calorie labelling in New York City affected the amount of calorie purchased, although one study found that almost 28% of those who saw calorie labelling reported that this information affected their purchasing decisions (Elbel et al., 2009). Besides influencing consumer behavior, there is emerging evidence that mandatory menu labelling may encourage restaurants to reformulate their menus by offering lower calorie content (Block and Roberto, 2014, Bleich et al., 2015). The differences in results between some studies may be due to the type of labelling used, e.g. purely informative vs interpretive. 29. Indeed, the ideal format, placement and contents of menu labels still have to be determined. For example, several studies suggest that “informative” menu labelling with calorie content alone has no or little effect. However, when contextual (e.g. on the recommended daily calorie intake for an adult) or interpretive (e.g., traffic lights systems) information is given, menu-labelling appears to be more effective (Pang and Hammond, 2013, Ellison et al., 2013, Swartz et al., 2011). 30. Menu labelling may impact some subgroups differently. Thus, women seem to be more receptive to menu labels than men (Nikolaou et al., 2014, Swartz et al., 2011, Sinclair et al., 2014, Afshin et al., 2015). In Nikolaou’s study (2014), more females (63%) than males (40%) reported being influenced by calorie-labels when choosing foods. Detailed research into specific socio-economic and demographic segments, e.g. the elderly (Feldman et al., 2011) is still missing. Furthermore, health and nutrition literacy, education (Fernandes et al., 2016) and preference for healthy eating (Vyth et al., 2011) may also impact the effectiveness of the labels. 6 Menu labelling involves listing information on the calorie content of items on the menu, as well as on the content of other nutrients, such as salt and sugar, at points- of-purchase of restaurants and cafeterias. This can be done with or without contextual information like recommended daily calorie intake, or interpretive information such as a traffic light system or PACEs (physical activity calorie equivalent) labels that indicate the number of minutes of exercise needed to burn off the calories consumed. 7 Defined as having 20 or more outlets. 8 https://www.ontario.ca/page/calories-menus THE ROLE OF COMMUNICATION IN PUBLIC HEALTH POLICIES © OECD 2017 14
b) Selection of evidence

31.       The evidence on this intervention was selected by reviewing papers referenced in 2 systematic
reviews (Swartz et al., 2011, Sinclair et al., 2014), one meta-review (Afshin et al., 2015) and some more
recent articles found through PubMed. Mainly two kinds of studies exist: those testing the effect of menu
labelling on restaurant’s proposed food items, and those testing the effect on customers’ food choices.
Available research would benefit from relying more on pre-post designs with control groups (Krieger et al.,
2013, Thunström and Nordström, 2011). There are also not enough studies measuring long-term effect, or
taking into account factors such as hunger, time pressure, costs and marketing practices, which may likely
influence real-world behavior. Most studies included in this review have been conducted in the United
States, and only few elsewhere (in the UK, the Netherlands, Australia, and Sweden).

c) Characteristics of the intervention

32.       A statutory menu labelling intervention is comprehensively implemented in restaurants and other
foodservice establishments (e.g., fast food places). The labelling has to be provided on the menus, and may
include information on the calorie content of foods, as well as on other nutrients (e.g., sodium, fats, sugar).
In addition to simply informing (e.g. on the total amount of calories per portion), such menu labels may
provide some contextual information (e.g., on the recommended daily caloric intake for an average adult),
and/or have an interpretive dimension (e.g. with the help of a traffic lights system; or with a warning sign).

d) Effects of the intervention

33.      Of greatest relevance to us is the recent systematic review and meta-analysis by Sinclair et al
(2014). The authors found that for all the studies combined, participants in the menu label group selected
43 fewer calories (P=0.03) and consumed 41 fewer calories (P=0.03) compared to the control group.
However, when restricted to interventions where contextual (e.g. on the recommended daily caloric intake
for an average adult) or interpretive (e.g. traffic lights) information was added, the effect on calorie
consumption was a larger reduction of 81 kcal (P=0.007). On the other hand, labelling containing
information only on total calories had no effect on calorie purchase/consumption. Finally, the authors
concluded that the labelling interventions had stronger effect on women, although it was not clear what the
magnitude of this effect modification was.

34.        In a recent systematic review, Fernandes et al (2016) considered broad definition of menu
labelling, going beyond total calories. Similar to (Sinclair et al., 2014), they concluded that qualitative
information, such as health-food symbols and traffic-light labeling, was more effective in promoting
healthy eating, than information labelling alone.

35.      Based on Sinclair et al (2014), menu labelling with contextual or interpretive information is
expected to lead to the reduction in the calories consumed (per purchase) of about 81 kcal.

       •      We calculated that, in Italy, people will eat out about every 3rd day(Censis, 2010), which
              suggests that they will be exposed to this intervention about 100 days a year.

       •      Given the same input parameters for the converting tool mentioned above 9, this will translate into
              1.09% decrease of average BMI after 1 year of intervention (or 100 days of cumulative exposure
              a year). Again, this decrease in BMI will be relative to the counterfactual “business as usual”
              BMI.

9 https://www.supertracker.usda.gov/bwp/index.html

THE ROLE OF COMMUNICATION IN PUBLIC HEALTH POLICIES © OECD 2017                                                15
• Once their BMI drops by 1.09%, it will continue on the new, lower trajectory.
• We assume that the eligible population is all adults older than 20 years, and that 53% will be
actually exposed to the intervention 10.
• The cost is assumed to be 0.92 Euros per capita. It includes expenses on policy administration,
planning and enforcement in the form of food inspections, but does not account for the additional
costs associated with designing and printing menu labels and for the potential costs associated
with the reformulation of certain foods, likely to be borne by the private sector.
• The intervention is modelled to last from the beginning of 2018 until the end of 2099.
iv) Prescription of physical activity by primary care physicians
a) General introduction
36. The importance of physical activity (PA) policies was underlined in the “Global
Recommendations on Physical Activity for Health” report, published by WHO in 2010 (World Health
Organization, 2010a). Amongst other priorities, it proposed the implementation of PA-promoting policies
in the primary care (PC) sector.
37. In the developed countries, up to 80% of the population visits their GPs at least once a year
(Sanchez et al., 2015), implying that GPs may be ideally suited to provide advice on adequate PA levels.
There is general consensus that PA interventions in the PC settings may increase PA levels of sedentary
patients, at least in the short-term (Campbell et al., 2015, Orrow et al., 2012, Lin et al., 2010, Sanchez et
al., 2015). At the same time, there are still significant gaps in the evidence base. For example, existing
meta-analyses of the intervention do not take into account intensity of exercise, nor are such interventions
always specific to the PC settings (Foster et al., 2005, Conn et al., 2011).
b) Selection of evidence
38. 15 systematic reviews were identified, of which 10 were found through one literature review of
reviews published in 2015 (Sanchez et al., 2015). All references of the systematic reviews had been
screened and, if considered relevant, extracted and categorized by intervention type. The evidence on the
intervention effectiveness was collected from peer-reviewed articles with a randomized control trial (RCT)
design. As the focus of this review is on patients with an increased risk of NCDs, only studies with
populations having an elevated risk of NCDs were considered. This means, for instance, that the examined
group would be overweight or obese, sedentary, hypertensive and/or with a family history of chronic
disease. We did not exclude any age groups or geographical areas from the literature search. However, no
study for children or adolescents was found.
c) Characteristics of the intervention
39. The modelled intervention had to be more than just a simple brief advice, and thus could include
exercise on referral (ERS)11 or exercise on prescription (EoP) schemes, 12 or another form of personalized
counselling. Some parts of the intervention could take place outside the primary care sector, for example
10 This proportion consists of two parts: 80% of the population in Italy are assumed to be eating out regularly, and of this group, about 66% (two thirds) are assumed, in
line with the food labelling intervention assumption, to care to read and act upon the menu labelling information.
11 Under ERS, patients are referred to a third provider (e.g. leisure centre), and subsequently can enrol in a PA program.
12 Under EoP, patients receive a prescription of PA by the GP. It includes an individualized exercise plan and can in some cases be linked to a third provider.
THE ROLE OF COMMUNICATION IN PUBLIC HEALTH POLICIES © OECD 2017 16with the exercise program being run by a wellness provider. However, eligible studies had to be linked to
the PC sector in a meaningful way (such as, for example, through being initiated there, or through at least
one interaction between healthcare workers and the patients). The control group received either usual care
or brief advice on the benefits of PA.
d) Effects of the intervention
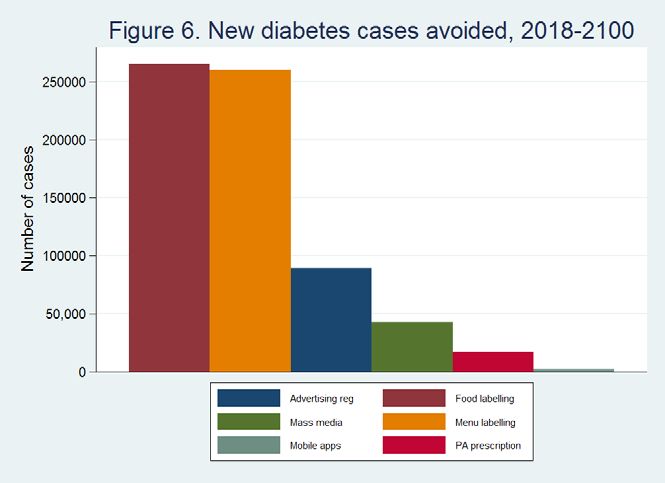
40. Our main interest was in the effect of PA interventions on the amount of energy expenditure,
expressed as METS*h/week. In 11 out 18 studies, interventions had a positive effect. Figure 2 below
demonstrates that this translates into about 1.56 greater METS*h/week on average, with the effect being
statistically significant.
Figure 2. Pooled estimation of METS*h/week
Study %
ID ES (95% CI) Weight
Taylor et al. -8.89 (-23.54, 5.76) 0.44
(1998), moderate
Taylor et al. -4.20 (-17.23, 8.83) 0.54
(1998), total
van Sluijs et al. -3.95 (-10.13, 2.23) 2.06
(2005), moderate or vigorous
Kinmonth et -0.23 (-9.68, 9.23) 0.99
al. (2008), total
Pinto et al. -0.03 (-0.04, -0.02) 10.62
(2005), vigorous
Swinburn et al. (1998), 0.00 (-0.93, 0.93) 9.70
moderate and vigorous
Smith et al. (2000), 0.08 (-0.41, 0.56) 10.35
light, moderate and vigorous
Kolt et al. (2007), light 0.54 (0.22, 0.87) 10.50
Grandes et al. (2009), 1.27 (0.38, 2.16) 9.78
moderate or vigorous
Aittasalo 2006, 1.73 (-0.65, 4.01) 6.67
moderate and vigorous
Taylor et al. 2.11 (-39.39, 43.60) 0.06
(1998), vigorous
Elley et al. (2003), 2.67 (0.48, 4.86) 6.98
moderate or vigorous
Morey et al. 2.87 (0.61, 5.13) 6.82
(2009), endurance
Pinto et al. 3.08 (2.76, 3.40) 10.50
(2005), moderate
Morey et al. 3.71 (3.08, 4.33) 10.19
(2009), strength
Kolt et al. (2007), total 6.17 (-5.54, 17.87) 0.67
Kolt et al. 7.08 (-5.14, 19.30) 0.62
(2007), moderate
Elley et al. 9.38 (3.96, 14.81) 2.53
(2003), total
Overall (I-squared = 96.9%, p = 0.000) 1.56 (0.57, 2.55) 100.00
NOTE: Weights are from random effects analysis
-43.6 0 43.6
41. When the analysis was restricted to studies in which health professionals were actively engaged
with the participants since the start of the intervention, the pooled effect was yet stronger, at 2.24
METS*h/week, or about 134.1 extra MET*minutes per week. Assuming the lower bound of 3 METs for
moderate activity, this implies about 45 extra minutes of moderate-level exercise per week due to PA-
promoting interventions. Such an increase would account for about a third of the 150 minutes per week of
moderate exercise recommended by the WHO, which is certainly not a trivial amount. This was not the
case when the studies were restricted to those where there was only some initial interaction between
patients and healthcare workerless.
42. The intervention is modelled to have maximum effect (134.1 extra MET*minutes per week) after
half a year, which then gradually wears off to zero by the end of the year. The eligible population includes,
in line with the studies reviewed, population aged 40-70 years with at least one chronic condition/risk
factor: overweight/obese; physically inactive; with diabetes (other conditions not supported yet by the
THE ROLE OF COMMUNICATION IN PUBLIC HEALTH POLICIES © OECD 2017 17microsimulation model: hypertension; smoking; high cholesterol; high salt consumption). After the effect
of the intervention wears off, still eligible individuals can again be randomly picked up for participation.
43. The participation is modelled to be 26.4% among the eligible pool, which is due to the three
components gathered from the literature:
• primary care visiting in a year is assumed to be 80%;
• 60% of GP/practitioners are likely to participate in the PA-prescribing intervention;
• 55% of patients will respond positively to the prescription.
The cost of prescription has two components: 1) 0.68 euros per capita; and 2) 81.7 euros per target person.
The per capita cost will come from expenses on program administration and on recruitment of doctors;
while the target costs- from doctor-provided consultations; maintaining contacts with the participating
patients; as well as, in some cases, expenses on health membership fees through third providers.
v) Mass media campaigns
a. General introduction
44. Various mass media (or social marketing) campaigns can be implemented to raise public
awareness about the benefits of healthy diet and physical activity (Mozaffarian et al., 2012, Bauman et al.,
2001). Health promotion through traditional (television, radio, newspaper) or new media (internet, social
networks, mobile apps) is frequently introduced at a national level.
45. These campaigns are often implemented as part of a policy package, which may make evaluation
of their effectiveness complicated (Afshin et al., 2015). Still, such studies do exist. For example, in
Australia, LiveLigher campaign, which has been encouraging healthy eating and being physically active
with the help of free resources such as healthy recipes, meal and activity planner, was found to increase
population-level awareness, compared to other obesity campaigns (Morley et al., 2016). The evaluation of
the 2+5 mass marketing campaign in Western Australia concluded that the program was successful in
reaching the target audience and in increasing awareness about the importance of adequate fruit and
vegetable consumption, and that it contributed to the population-wide increase in the mean intake of fruit
and vegetable servings by about 0.2 over 3 years (PArticles cited in each of these publications were retrieved and assessed with the objective to categorize
their results according to the following dimensions: name of the campaign, type of media, target
population, duration of the campaign, sample size, changes in awareness and in behavioural outcomes.
Relevant information on level of PA and dietary improvements were also collected.
48. The selection process identified a number of papers that reported homogenous evidence that was
used to assess the effectiveness of mass media campaigns (Bauman et al., 2001, Reger et al., 2002, Miles et
al., 2001, Booth et al., 1992, Hillsdon et al., 2001, Reger-Nash et al., 2006, Reger-Nash et al., 2005, Reger-
Nash et al., 2008, Brown et al., 2006, John-Leader et al., 2008, Craig et al., 2006, Craig et al., 2009,
Matsudo et al., 2010, De Cocker et al., 2007, Sharpe et al., 2010, Berkowitz et al., 2008, Huhman et al.,
2010, Stern et al., 1976, Foerster et al., 1998, Dixon et al., 1998, Stables et al., 2002, Reger et al., 1999,
Jason et al., 1991)
c) Characteristics of the intervention
49. Our focus is on the effect of traditional media campaigns (radio, television,
newspapers/magazines) on physical activity levels, and does not cover the impact of campaigns aired
through the social media. We assume that the modelled intervention will include two 15-second television
paid commercials, as in the mass-media campaign to promote physical activity in the state of New South
Wales, Australia, in 1998 (Bauman et al., 2001). In addition, the TV commercials will be combined with
some other resources, such as adverts in printed media, posters, leaflets, postcards, web sites and public
relations events, as in the Active For Life campaign in the UK (Hillsdon et al., 2001). We assume that the
mass media campaign intervention will cover all adults aged 18 years or older.
d) Effects of the intervention
50. In evaluating and summarizing studies, this report exploits Kahn (2002) method which relies on
a “standardized abstraction form” to evaluate the intervention effectiveness. With this approach, different
measurements for the same outcome variables can be used (e.g., number of times per week spent doing at
least moderate exercise; self-reported physical activity scores; MET*hours per week exercising). The
effect sizes were estimated as a net percent change from the baseline, according to one of the following
three approaches, depending on the data availability:
a) The first, and the most desirable approach, is used when the study includes both intervention
and control groups, and the measurement is performed both before and after the intervention. In this case,
the measured effect is calculated according to the following formula:
I post − I pre C post − C pre
−
I pre C pre
b) The second approach is used if the study does not have a control group, and relies on pre and
post measurements in the intervention group only:
I post − I pre
I pre
THE ROLE OF COMMUNICATION IN PUBLIC HEALTH POLICIES © OECD 2017 19You can also read