UNIVERSITY OF
  LOUISVILLE
DIVERSITY PLAN
     2017-2021
←
→
Page content transcription
If your browser does not render page correctly, please read the page content below
UNIVERSITY OF
LOUISVILLE
DIVERSITY PLAN
2017-2021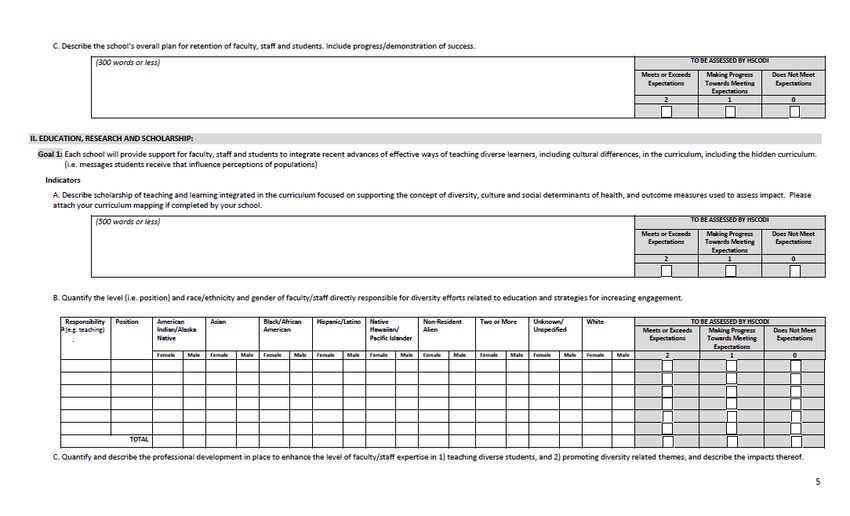
Table of Contents

Background, University Profile and Introduction ................................................................................... 3
        Mission Statement ............................................................................................................................... 3
        Research ............................................................................................................................................... 4
        Community Engagement and Service ............................................................................................... 4
        Diversity Vision Statement ................................................................................................................. 5
        Operational Definition of Diversity ................................................................................................... 5
The University of Louisville Diversity Plan .............................................................................................. 6
   I.      Opportunity ..................................................................................................................................... 7
        Total Population Estimates as of July 1, 2015 .................................................................................. 7
        Total Population Poverty Status Estimates, 2011-2015 5-year Time Period ................................. 7
        College Age Population 18-24 as of July1, 2015 ............................................................................... 8
        Undergraduate Student Enrollment.................................................................................................. 8
   II. Student Success ................................................................................................................................ 13
        Student Retention 1ST to 2ND Year ............................................................................................... 13
   Strategies to Improve Graduation Rates ............................................................................................ 17
   Undergraduate Graduation Rates and Degrees Awarded ................................................................ 19
        Undergraduate Six Year Graduation Rates ................................................................................... 19
   Graduate and Professional Student Enrollment ................................................................................ 19
   III.        Impact ........................................................................................................................................ 21
   Workforce Diversity ............................................................................................................................. 21
        Faculty................................................................................................................................................ 23
        Staff .................................................................................................................................................... 25
Campus Climate and Cultural Competency .......................................................................................... 27
   Campus Climate .................................................................................................................................... 27
   Cultural Competency............................................................................................................................ 27
Assessment Plan ........................................................................................................................................ 29
   Opportunity ........................................................................................................................................... 30
   Success.................................................................................................................................................... 30
   Impact .................................................................................................................................................... 31
Services to Other Groups/Areas of the Diversity Plan .......................................................................... 31
   Gender Equity ....................................................................................................................................... 31

                                                                                                                                                                   1
Title IX ................................................................................................................................................... 33
Disability Services and ADA ................................................................................................................ 33
Globalization and International Affairs ............................................................................................. 34
LGBT Services ...................................................................................................................................... 35
Religious Diversity ................................................................................................................................ 36
Diversity of Thought and Ideas ........................................................................................................... 36
Veterans/Military Services ................................................................................................................... 37
Community Engagement ...................................................................................................................... 37
Conclusion/Next Steps .............................................................................................................................. 38
Appendix A ................................................................................................................................................ 39
Undergraduate Recruitment and Retention Strategies ..................................................................... 39
Recruitment ........................................................................................................................................... 39
Retention ................................................................................................................................................ 40
Appendix B ................................................................................................................................................ 44
Recruitment and Retention .................................................................................................................. 44
School of Interdisciplinary and Graduate Studies ......................................................................... 44
School of Dentistry ............................................................................................................................ 46
Brandeis School of Law .................................................................................................................... 48
School of Medicine ............................................................................................................................ 49
Appendix C ................................................................................................................................................ 54
Campus Climate Survey Models ......................................................................................................... 54
Cultural Competency Research Project.......................................................................................... 57
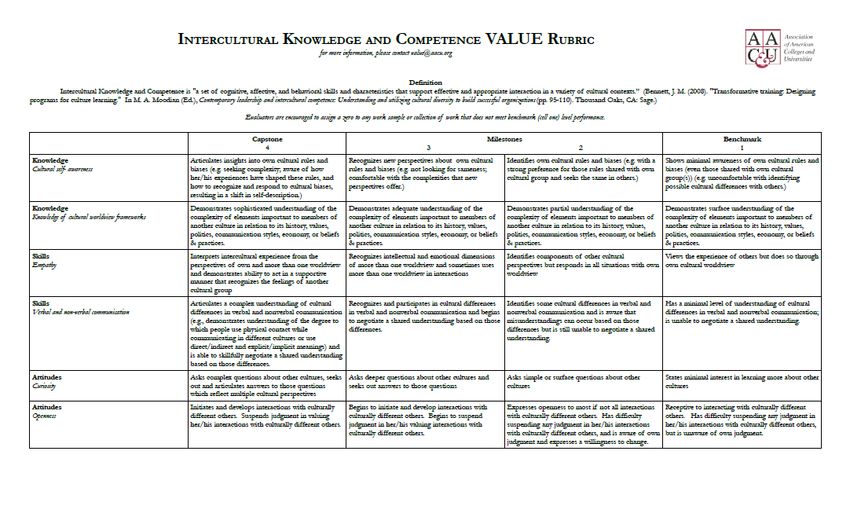
Intercultural Knowledge and Competence Values ........................................................................ 58
Diversity Accountability Form ........................................................................................................ 62
2University of Louisville Diversity, Equity and Inclusion Plan
2017-2021
Background, University Profile and Introduction
Established in 1798, the University of Louisville (UofL) has become a major public research
institution. In 1997, Kentucky’s General Assembly approved the Higher Education Reform that
included a mandate for the University of Louisville to become a preeminent metropolitan
research university by 2020.
In 2008, UofL developed its strategic plan and set goals that are to be achieved by the year 2020.
Components of the plan include Educational Excellence; Research, Scholarship and Creative
Activity; Community Engagement; Creative and Responsible Stewardship; and Diversity,
Opportunity and Social Justice. In addition, in 2015, the university developed a 21st Century
University Initiative that builds on and powers the 2020 Strategic Plan. The three major areas of
the 21st Century Initiative are: Academic and Research Initiatives, Culture of Excellence and
Financial Health. The Culture of Excellence focuses on building a diverse and inclusive campus
climate with the tenets of equity, fairness, recognition, dignity and respect.
The University of Louisville is one of fewer than sixty universities in the nation designated by
the Carnegie Foundation as both a Community Engaged University and a university with "very
high research activity." The university offers graduate, professional, baccalaureate, and associate
degrees, as well as certificates, in over 170 fields of study through 12 schools and colleges. The
student body exceeds 22,000. There are approximately 16,000 undergraduate student and 5,800
graduate, of which 20% are diverse students (URM). There are over 7,000 faculty and staff, and
more than 130,000 alumni reside in the United States and abroad.
Mission Statement
The University of Louisville pursues excellence and inclusiveness in its work to educate and
serve its community through 1) teaching diverse undergraduate, graduate, and professional
students in order to develop engaged citizens, leaders, and scholars, 2) practicing and applying
research, scholarship and creative activity, and 3) providing engaged service and outreach that
improve the quality of life for local and global communities. The university is committed
to achieving preeminence as a nationally recognized metropolitan research university.
University of Louisville, About UofL, 2017 http://louisville.edu/about/
3Research
As a Carnegie-classified research university, the University of Louisville is acclaimed for
innovation and discovery as evidenced by the following:
• FirstBuild – a partnership with General Electric (GE) that established the country’s first
microfactory where GE engineers team up with students to invent the next generation of
kitchen appliances.
• The nation’s first successful hand transplant.
• The world’s only 100 percent effective, FDA-approved cervical cancer vaccine –
Gardasil.
Community Engagement and Service
As a metropolitan university, UofL has a strong commitment to community service as evidenced
by the establishment in 2008 of the Office of the Vice President for Community Engagement
(OVPCE). OCVPE is responsible for planning and coordinating the University-wide mission of
engaged service and outreach, advising the President on the University’s strategic objectives in
the area of community engagement and work with external partners. Annual data collection
efforts organized by OVPCE show that in academic year 2015-16, UofL schools, colleges, and
administrative units reported over 1500 community engagement activities that include: 310
community partnerships; 518 direct services; 633 curricular engagements: and 42 engaged
scholarship projects by faculty. In 2015, UofL was recertified as a Carnegie Community
Engagement institution, a distinction held by fewer than 200 institutions nationwide, which
recognizes a university’s strong commitment to community engagement. In one year alone,
University of Louisville students, faculty, and staff contributed more than $25.1 million to
charitable organizations through volunteerism and direct donations.
Community engagement at UofL encompasses all work with external partners locally, statewide,
nationally, and internationally. A major body of that work locally is embodied in the Signature
Partnership Initiative, which is a coordinated series of projects working with community
organizations, local government and residents to improve the social, cultural, educational, health
care, and economic development services in underserved areas of west Louisville. In the past
decade UofL has garnered over $30 million in grants and contracts for engaged research and
service projects that directly benefit the residents of west Louisville, and UofL students have
engaged in over 250,000 hours of service related to the Signature Partnership Initiative.
4Diversity Vision Statement
The University of Louisville adopted a diversity vision statement in 2007 with tenets of expected
behaviors for all members of the campus community.
The University of Louisville strives to foster and sustain an environment of inclusiveness that
empowers us all to achieve our highest potential without fear of prejudice or bias. We commit
ourselves to building an exemplary educational community that offers a nurturing and
challenging intellectual climate, a respect for the spectrum of human diversity, and a genuine
understanding of the many differences-including race, ethnicity, gender, socio-economic status,
national origin, sexual orientation, disability, and religion-that enrich a vibrant metropolitan
research university. We expect every member of our academic family to embrace the underlying
values of this vision and to demonstrate a strong commitment to attracting, retaining, and
supporting students, faculty, and staff who reflect the diversity of our larger society.
University of Louisville, Diversity: About Us, http://louisville.edu/about/
Operational Definition of Diversity
Diversity embraces all human differences while building on the commonalities that bind us
together. It serves to eliminate discrimination, marginalization, and exclusion based on race,
ethnicity, gender, gender identity and expression, sexual orientation, age, socioeconomic status,
disability, religion, national origin or military status. Diversity also includes the diversity of
thought and political ideologies.
Diversity focuses on building community through:
Composition of a diverse faculty, staff and student body
Curricula and learning experiences that prepare students to live and work in a diversity
and global society
Climate of inclusiveness with principles of mutual respect, fairness and social justice that
is conducive for everyone to develop to his/her fullest potential.
Campus life that allows students to develop leadership skills, civic responsibility and
social skills while excelling academically, faculty to teach, serve and conduct research
that enhances knowledge and improves the quality of life, and staff to work in supportive
workplace environments
University of Louisville, Diversity: About Us, http://louisville.edu/about/
5The University of Louisville Diversity Plan
The Diversity, Equity and Inclusion Plan for the University of Louisville will focus primarily on
three groups: (1) African American (includes two or more races of which one is African
American), (2) Hispanic/Latino, and (3) low-income, although services to other diverse groups
will be included in the narrative. The three components of the plan are Opportunity, Success
and Impact. The plan gives details of the strategies, actions and tactics that are designed to
enhance student enrollment and success. These strategies and tactics will be assessed in terms of
their impact. Diversity goals will include metrics and goals for student enrollment, retention and
graduation. The impact section includes metrics and goals for increasing the number of diverse
faculty and staff. Equal attention is given to the strategies and best practices that are used to
support faculty through the tenure and promotion process as well as professional development
and promotional opportunities for staff. It also delineates the structures that are in place to
enhance cultural competency for students, faculty and staff and the tools that are used to monitor
and improve the campus climate. Finally, it includes an assessment plan for each strategy. The
conclusion summarizes the plan and identifies barriers and what is being done to minimize them.
The diversity planning process is robust and ongoing. Each college/school/unit has a diversity
committee appointed by the dean/vice president and is charged with planning for diversity
programs and services. The chairs of the unit diversity committees, comprised of students,
faculty and staff, and the Campus Environment Team, which includes the chairs of the Faculty
and Staff Senates, have been involved in the planning process for developing goals and strategies
for the diversity plan. Additionally, the Executive Vice President of the Student Government
Association (SGA) and the President of the Association of Black Students (ABS) have been
involved in the development of the plan, providing input from their constituents. The plan will
also go through a vetting process to get input from the Council of Academic Officers, the
President’s Executive Leadership Team, the Faculty and Staff Senates, the Student Government
Association, the Commission on Diversity and Racial Equality, and the Commission on the
Status of Women. The president and provost will present the plan to the Board of Trustees for
approval at their August or September 2017 meeting.
6I. Opportunity
The University of Louisville is located in the largest metropolitan area in Kentucky which has a
diverse population from which to recruit underrepresented students. The tables below show the
population of Jefferson and other counties in our Area of Geographic Responsibility (AGR),
which includes Jefferson, Oldham, Trimble and Shelby Counties.
Total Population Estimates as of July 1, 2015
Jefferson County Oldham County Shelby County Trimble County
Estimate Percent Estimate Percent Estimate Percent Estimate Percent
Total 763,623 64,875 45,632 8,769
White 526,229 69% 57,163 88% 36,884 81% 8,268 94%
Black 161,960 21% 2,917 4% 3,274 7% 56 1%
Asian 20,201 3% 1,028 2% 455 1% 44 1%
Hispanic 37,359 5% 2,673 4% 3,993 9% 274 3%
Other 17,874 2% 1,094 2% 1,026 2% 127 1%
Source: US Census Bureau, 2011-16 American Community Survey. Provided by the Kentucky State Data Center at
the University of Louisville, March 2017.
It is also important to note the poverty status for the populations in the university’s AGR. The
table below delineates the percentages of low-income individuals within the service area:
Total Population Poverty Status Estimates, 2011-2015 5-year Time Period
Jefferson County Oldham County Shelby County Trimble County
Estimate Percent Estimate Percent Estimate Percent Estimate Percent
Population for whom
poverty status can be
determined 740,545 58,701 42,890 8,558
Population with
income below
poverty level 121,683 16% 3,503 6% 5,566 13% 1,486 17%
Non-White
Population for whom
poverty status can be
determined 225,606 5,897 8,463 313
Non-White
Population with
income below
poverty level 64,510 29% 814 14% 2,462 29% 4 1%
Source: US Census Bureau, 2011-16 American Community Survey. Provided by the Kentucky State Data Center at
the University of Louisville, March 2017.
7According to TalkPoverty.org, the 2016 poverty data shows that Kentucky has one of the highest
percentages (18.5%) of people living with incomes below the poverty level. It ranks 47th out of
the 50 states. The poverty rate for African Americans is the highest in the state at 30.8%,
followed, Hispanic/Latinos at 29.2%, and Native Americans at 21.4%. Seventeen percent (17%)
of Whites live in poverty and Asians have the lowest poverty rate at 13.3%. Education is key in
eliminating poverty and improving the quality of life, and UofL is committed to providing
opportunity/access and services that lead to the success of low-income students.
College Age Population 18-24 as of July1, 2015
Jefferson Oldham
County County Shelby County Trimble County
Estimate Percent Estimate Percent Estimate Percent Estimate Percent
Total 66,619 5,351 3,875 722
White 41,159 62% 4,598 86% 2,778 72% 658 91%
Black 17,463 26% 316 6% 507 13% 5 1%
Asian 2,003 3% 46 1% 45 1% 1 0%
Hispanic 3,737 6% 260 5% 411 11% 48 7%
Other 2,257 3% 131 2% 134 3% 10 1%
Source: US Census Bureau, 2011-16 American Community Survey. Provided by the Kentucky State Data Center at
the University of Louisville, March 2017.
UofL embraces diversity in the composition of the student body and seeks to increase the
enrollment of students from underrepresented groups. Census data show that the growth
populations in UofL’s AGR are African American and Hispanic/Latino. American
Indians/Alaskan Natives and Native Hawaiians/Pacific Islanders are not significantly
represented. Therefore, the plan will focus on increasing diversity primarily among African
Americans and Hispanic/Latino students and closing any achievement gaps in comparison to
White students over the next five years.
Undergraduate Student Enrollment
The student body at the University of Louisville is one of the most diverse in the Commonwealth
of Kentucky. In the fall of 2016, 11.1% of the students were African American, 4.4% were
Hispanic/Latino and 4.8% were other underrepresented minority groups (URM) or U.S. diverse
students. Over 80% of these students come from all parts of Kentucky and the average ACT
scores for incoming students range from 23-25. Approximately, one-third of these students are
8low-income or Pell eligible. We have implemented one of the best practices for recruiting and
retaining by requiring all first year students to live on campus. The campus thrives with
activities and leadership development opportunities with over 350 recognized student
organizations. UofL is also committed to preparing our students to become global citizens and
over 900 students study and travel abroad each year. Since 2003, 104 UofL students have won
Fulbright Scholarships, which is more than all of the Kentucky universities combined.
Academic and recreation facilities as well as social programs inspire students to strive for
excellence by serving the community and being committed to social justice.
Low-Income Undergraduate Student Enrollment
Given our metropolitan mission and Areas of Geographic Responsibility (ARG), the majority
(76.6%) of students are from Jefferson, Oldham, Shelby counties and high schools in Lexington,
Elizabethtown, Paducah, Owensboro, Hopkinsville and others. While these may not be
considered to be impoverished areas, it is important to note that almost one-third (32.6%) of
undergraduate students enrolled at the UofL are low-income as identified by their eligibility to
receive federal Pell grants for low-income students and 20.8% are First Generation or the first in
their family to go to college. The table below shows the enrollment of undergraduate students
who are low-income/Pell eligibility, first generation and county income status by race and
ethnicity.
9Pell Eligible Undergraduate Student Enrollment (Fall 2016)
Source of Impoverished County: 2015 Poverty and Median Household Income Estimates from the 2016 US Census
Bureau.
Total undergraduate: 16,033
Total Pell Eligible: 5,231
Total First Generation: 3,328 (1,754 are ‘Yes’ First Generation AND Pell Eligible) + (1,574 are ‘Yes’ First
Generation AND NOT Pell Eligible)
Total undergraduate from Kentucky Counties: 12,853 (561 in Impoverished) + (12,292 in Count Not Impoverished)
Total from an Impoverished KY County: 561
Total Not from an Impoverished KY County: 12,292
Total Not from a KY County: 3,180
Percent of undergraduates who are Pell Eligible: 5,231/16,033 = 32.6%
Percent of undergraduates who are First Generation: 3,328/16,033 = 20.8%
Percent of First Generation who are Pell Eligible: 1,754/5,231 = 33.5%
Total Pell Eligible from an Impoverished KY County: 253 (102 are ‘Yes’ First Generation) + (151 are NOT First
Generation)* - not visible on table above
Percent of Pell Eligible from an Impoverished KY County: 253/561 = 45.1%
Total Pell Eligible who are First Generation in an Impoverished County: 102
Percent of undergraduates from Kentucky Counties who are Pell Eligible and First Generation from an
Impoverished County: 102/12,853 = 0.8% (less than 1%)
10UofL is committed to increasing the overall enrollment of students. To help UofL reach this
goal, UofL has hired a Vice Provost for Strategic Enrollment Management and Student Success.
The plan is to increase the number of students enrolled while focusing on the retention and
academic success of all students.
The top 10 schools in Kentucky that serve as feeder schools for UofL for African American and
Hispanic/Latino students include:
Du Pont Manual High School Fern Creek High School
Central High School Eastern High School
Male High School Ballard High School
Butler High School Seneca High School
Atherton High School Lexington Bryan Station
In addition to all other high schools in Louisville and southern Indiana, other top 25 feeder
schools include: Tates Creek, Paul Lawrence Dunbar and Henry Clay high schools in Lexington,
KY; John Hardin High School in Elizabethtown; Martha Layne Collins High School in
Shelbyville, KY; Paducah Tilghman High School; and Owensboro High School.
Undergraduate Student Enrollment
Target Population 2016-17 2017-18 2018-19 2019-20 2020-21
African American 11.1% 11.8% 12.5% 13.3% 14.0%
Hispanic/Latino 4.4% 4.8% 5.2% 5.6% 6%
Total Underrepresented 20.3% 20.5% 21.3% 22.2% 23%
Diverse Students (URM) as a
percent of Total Fall
Undergraduate Enrollment
The table above indicates an overall increase of approximately 3% (over three year average) for
African American students with a gradual increase in the earlier years. For Hispanic/Latino
students, while there a projected increase in the Hispanic population by 2020, the enrollment
11projection is conservative to reflect concerns that may result from the current political climate as
it relates to immigration status and access to federal financial aid for undocumented students or
their families.
Strategies/Tactics/Actions
Strategies that have proven to be effective to enhance the number of URMs will continue to be
used. In addition, other best practices will be implemented to increase the enrollment of URMs.
The diversity plan will focus on two areas: outreach and financial assistance.
Outreach
UofL offers a number of programs and services designed to recruit underrepresented students.
The programs below highlight best practices to achieve this goal – a more extensive list is
included in the Appendices.
The Diversity Outreach and Recruitment Program has implemented several effective strategies to
recruit URM students. These include Up Close and Personal, Order Your Education Steps (O-
YES), and Think College Now. Over 1,800 URM students and families participated in these
programs during the 2016-17 academic year.
In addition, special recruitment efforts for African American and Hispanic/Latino students
include the Woodford R. Porter receptions and brunches, and dinners for prospective students
and their parents. The yield of these efforts has resulted in increasing numbers of URM students
accepting scholarships and enrolling at UofL.
Recruitment of In-state and Out-of-state students – UofL recruiters will live in cities such as
Chicago, Cincinnati and Nashville with the goal of recruiting more students including URM
students.
Financial Aid/Scholarship Assistance
Reduction in Application Fee – The admission application fee has been reduced from $50 to $25
to increase the number of applications.
Scholarships – UofL provides numerous scholarships to students who meet the requirements.
These include admission-based scholarships, transfer and adult scholarships, study abroad, and
federal financial aid as well as preparing students to be competitive for national and international
scholarships.
12II. Student Success
UofL is committed to the success of all students. Student success will be measured by student
retention, six-year graduation rates and the number of degrees conferred. The table below shows
the 1st to 2nd year retention goals with gradual increases over the next five years.
Student Retention 1ST to 2ND Year
Target Population 2016-17 2017-18 2018-19 2019-20 2020-21
Total 79.9% 80.3% 80.8% 81.2% 82%
Underrepresented 78.3% 78.6% 78.9% 79.2% 80.5%
Minorities (URM)
Low-income 75% 75.6% 76.2% 77% 77.5%
Strategies/Tactics/Actions
The listing below includes best practices and a comprehensive overview of the academic support
services provided to students. We continue to enhance current retention programs and
implement high impact strategies that focus on retention and improving the graduation rates.
Cardinal Pledge – One of the most effective strategies for increasing the success of low-income
students is to provide financial support. UofL has established a new institutional fund to more
widely distribute funds to low-income students with unmet needs. The University of
Louisville’s Cardinal Covenant Program has provided financial support for students from low-
income families to fund their education. The University of Louisville's Cardinal Covenant was
the first program of its kind in the Commonwealth of Kentucky. Realizing the need to provide
financial support to more low-income students, a new program called the Cardinal Pledge has
been established and will distribute funds to help more students persist to graduation. The
Cardinal Pledge provides support to students designated as 150% of the poverty level, are
admitted by June 1, and have a FAFSA on file in the Financial Aid Office. For the fall of 2017,
it is projected that over 400 students will be assisted through the Cardinal Pledge program and
the number of students served will continue to increase. In addition to providing scholarships,
13the program focuses on students’ academic success by monitoring their academic progress,
providing financial literacy sessions and peer mentoring.
Living Learning Communities (LLC) are considered to have a large impact on the retention of
students and they continue to increase on our campus. They provide students with an
opportunity to network with other students, a peer advisor, an academic advisor, and faculty
members that share a common major or interest. LLCs are open to students living on campus
and commuter students seeking a greater connection to campus. There is no additional cost to
participate in a LLC.
UofL offers LLCs for honor students and academic units, and, in Fall 2012, the Bayard Rustin
LLC for students interested in LGBT issues and social justice was established. Beginning Fall
2017, LLCs for the African American Male Initiative (AAMI) and the Porter Scholar LLC will
open in collaboration with the Cultural Center, the College of Arts Sciences, and Housing and
Residence Life. The activities in the LLC will focus on academic success, mentoring,
developing peer connections and gaining leadership skills. Additionally, Porter Scholars will
receive encouragement and support to maintain their scholarship through graduation. During the
fall semester, both LLC cohorts will take a common set of courses together, including Freshmen
Orientation (Gen 101), and one or more additional courses, including English 101. There may be
additional courses that will vary by community.
Summer Bridge Programs (Early Arrival Programs) were created to help ease the transition from
high school to college for incoming African American and Hispanic/Latino students. Through a
series of discussions and activities, the aim is to allow participants to network, build community
and become active and engaged students during their time at UofL. Topics discussed include
money management, becoming familiar with academic resources and support services, and the
importance of establishing relationships. The Early Arrival Program works collaboratively with
the Office of First Year Initiatives, and, in Fall 2017, transfer students will be invited to
participate. In addition, the Speed School of Engineering has a summer bridge program for
incoming engineering freshmen to prepare them academically and personally. The two-week,
residential enrichment program is designed to assist students with their transition into college
14through: academic prep, peer support, faculty relationship-building and student success
programming.
Cultural Center Retention Program provides supplemental support for underrepresented students
at UofL and has been expanded to include all African American and Hispanic/Latino students.
Students participating in the Cultural Center Retention Program receive individual coaching and
have access to programming focused on personal and professional development. Coaching
provides intimate, one-on-one support to help students examine academic concerns and
perceived barriers to success. Coaches provide students with semester-long academic support in
areas such as time management, test preparation, note-taking, study skills, and reading strategies.
They work individually with students, assess their strengths and needs, and devise a personalized
plan of action. Students are also encouraged to take advantage of tutoring and other support
services provided by REACH.
Mid-term Grades - In addition to the monitoring of students’ academic progress, efforts will be
made to implement mandatory midterm grades in order to let students know exactly where they
are by the middle of the semester so they know what they must do in order to obtain their desired
grade. This practice has proven to be beneficial for all students, but has been particularly
successful as it relates to the retention of URM students.
While some units already provide mid-term grades, efforts will be made to implement mandatory
mid-term grades over the next five years. Faculty involvement in student success is one of the
most effective strategies to assist in the retention of students. A Plan of Action will be developed
that will involve the deans, department chairs and faculty in a collaborative effort to assist with
student retention and persistence to graduation. Faculty buy-in is critical if this is to be
implemented. A part of the plan will involve making faculty aware that a part of their success is
tied to student success. Faculty will be asked to submit mid-term grade information to be
uploaded into the CardSmart alert system so that faculty and advisors can work in tandem to
provide early intervention and support to students determined to be at risk.
15Undergraduate Academic Advising Assessment Plan - In 2015, the U of L Board of Trustees
asked that the university create an advising assessment plan for undergraduate academic
advising. Building on the university’s academic advising mission and vision, a committee of
academic advisors created three goals for academic advising. In 2016, an academic advising
assessment pilot program was created to gather data in order to set targets for advising
improvement through the year 2021. The three goals addressed what academic advisors could
do to support student success. The Advising Assessment Committee will create student learning
outcomes for advising for inclusion on the university’s 2018 advising assessment plan.
A university “Identity Center” to house and concentrate diversity programming and staff is a key
element of campus student engagement for diversity. It may be possible to identify existing
space freed up by the opening of the new academic building or to mount an advancement
campaign with a new building as its goal. The Vice Provost for Diversity and International
Affairs is working with SGA to further refine this idea and to present it to the campus
community.
Society of Woodford R. Porter Scholars – The Society of Porter Scholars is the largest
recognized student organization that is comprised of and serves African American students. Its
purpose is to provide academic and social support to the Woodford R. Porter Sr. Scholarship
recipients with the goal of increasing the retention and graduation rates of Porter Scholars. The
organization also promotes interaction, enhances leadership opportunities and personal
development as well as encourages professional/graduate education. Other Recognized Student
Organizations (RSOs) are also available for membership. Some examples include the
Association of Black Students, Black Nurses’ Association, National Society of Black Engineers
(NSBE) and others.
Book-in-Common (BinC) is an opportunity for all new students to come to campus with at least
one shared experience: that of reading the same book. It is a great starting point for conversation,
and the variety of perspectives reflects the diversity of opinions and experiences that comprise
our UofL community. Book-in-Common is about more than just reading; what really brings
those pages to life are the different conversations and events that take place around the book
year-long.
16A community-wide reading for UofL’s entire campus, BinC brings together students, faculty,
and staff who read and explore a common text which is incorporated into courses across
disciplines. To enhance classroom learning, BinC partners with campus and local community
members to host a year-long event series aimed at highlighting the themes and issues raised
throughout the text.
Through related programming, Book-in-Common
Increases student-faculty interaction and helps build community among new students.
Connects in-class and out-of-class experiences.
Creates opportunities for interdisciplinary and active and collaborative learning.
Develops students’ critical thinking skills.
Addresses complex issues relevant to our students’ transitions to college and to our
community at large.
Promotes self-discovery and exploration of diverse ways of thinking and being.
One recommendation from students is to make sure the books are more consistently diverse by
authors and content. Over the course of the next five years, more efforts will be put in place to
make sure BinC includes books that focus on diverse people and/or race and social justice issues.
The anticipated outcome of all of the academic and social support services for undergraduate
students will be measured based on the six-year graduation rates and number of degrees
conferred as reflected in the goals set in the tables that follow. Therefore, we will continue to
implement strategies and best practices for student retention that will lead to an increase in the
number of degrees awarded.
Strategies to Improve Graduation Rates
Flight Plan
All of the retention strategies listed in the previous section are intended to result in student
success and graduation. However, the following strategies focus specifically on graduation.
17In order to improve student persistence and graduation rates, in Spring 2016, the university
purchased two new software programs: Education Advisory Board’s Student Success
Collaborative and The Burgundy Group’s Smart Planner.
Education Advisory Board’s (EAB) Student Success Collaborative
EAB’s Student Success Collaborative is a predictive analytics program where 10 years of U of L
data were entered into the EAB system and resulted in the identification of risk levels of
undergraduate students (low risk, moderate risk, high risk). In Fall 2016, the university renamed
the system, CardSmart and academic advisors began utilizing it in Fall 2016 to easily identify
students with whom they believe would benefit from an intervention—either an academic
advising appointment or participation in campus student support resources. Academic advisors
can sort students by risk level, GPA, major, classification and many other factors. CardSmart
downloads information from PeopleSoft nightly and allows advisors to be proactive in reaching
out and working with students, instead of waiting for students to find them. This information is
used to provide early alerts to the students and refer them to tutoring or other resources based on
their need.
Flight Planner
Smart Planner software is an addition to PeopleSoft and allows students to easily plan their
degree completion by moving courses to semesters in the planner. In Fall 2016, a pilot program
with the Speed Engineering students was launched and the software was renamed Flight Planner
to support the university’s Flight Plan program. Flight Planner is automatically populated for
students with their specific course requirements for the degree program they select. Flight
Planner is interactive and pulls in data from the student’s degree audit (advisement report) in
PeopleSoft. As students complete courses, their grades are imported into the planner and
students can easily see what they have left to complete their degree. As students move courses in
the planner, they can see how that decision will affect their graduation date. The university plans
to roll out Flight Planner in Fall 2017 to students in the College of Arts and Sciences and then
add students enrolled in other units of the university each semester until all undergraduate
students are in the system.
18Undergraduate Graduation Rates and Degrees Awarded
Both the six-year graduation rate and number of degrees conferred are reflected in the tables
below. Both show projected increases over the next five years.
Undergraduate Six Year Graduation Rates
Target Population 2016-17 2017-18 2018-19 2019-20 2020-21
Total – All Students 54.3% 55.7% 57.1% 58.6% 60.1%
Underrepresented Minorities (URM) 50.1% 51.5% 53.% 54.5% 58.5%
Low-income 45.7% 47.8% 49.9% 52.0% 54.1%
Undergraduate Degrees Awarded
Total number of degrees awarded during an academic year (July 1 – June 30)
Target Population 2016-17 2017-18 2018-19 2019-20 2020-21
Total 2,805 2,879 2,953 3,027 3,100
Underrepresented Minorities (URM) 507 531 548 567 585
Low-income 1,186 1,230 1,271 1,313 1,356
Graduate and Professional Student Enrollment
Several strategies have led to the increased enrollment of African American, Hispanic/Latino and
other URM graduate students. The School of Interdisciplinary and Graduate Studies (SIGS)
provides financial support for UofL departments and programs to assist in the matriculation and
graduation of qualified, underrepresented ethnic minority students. A more extensive list of
initiatives by SIGS and the Schools of Dentistry, Law and Medicine is included in Appendix B.
19We continue to strive to increase the enrollment of graduate and professional students as
reflected in the table below.
Graduate and Professional Student Enrollment
Target Population 2016-17 2017-18 2018-19 2019-20 2020-21
Underrepresented Minorities (URM) 14.5% 14.8% 15% 15.3% 15.5%
Examples of high-impact best practices include:
Recruitment
Along with hosting graduate preparatory workshops and initiating programs that target
underrepresented groups, regional and national recruiting trips play a significant role in sparking
interest for prospective students. The recruitment of international students have also helped to
shape the landscape for creating a diverse student body at the graduate level. Areas included in
the SIGS plan for recruitment and outreach include:
• The Atlanta Consortium, which includes Spelman, Morehouse and Clark Atlanta as
partners
• The Alabama Connection that spans the state of Alabama with an emphasis on HBCUs
• Tennessee State University
• Fisk University
• Kentucky State University
SIGS hosts graduate visitation days and group appointments, and through these efforts UofL has
been successful in attracting students from Marshall University, University of Tennessee-
Knoxville, Troy University, University of Cincinnati and Berea College.
Specific strategies for the recruitment and retention of professional schools (Law, Dentistry and
Medicine) are found in Appendix B.
Financial Aid/Scholarship Assistance
20Funding for graduate school is provided in the form of scholarships and tuition awards,
fellowships, and graduate assistantships. A more complete listing is included in Appendix B.
Partnerships with the Southern Regional Education Board (SREB) and the National GEM
Consortium assist in providing multiple layers of support to underrepresented minority students.
Retention
In an effort to support student retention, human resources have been made available to students
on both the Belknap and Health Science Center (HSC) campuses. These sources of support
between the department and graduate students have helped to manage the retention rates of
graduate students, in particular, graduate diverse students. Students on both campuses interact
regularly with the Associate Director of Graduate Admissions and Diversity Recruitment to gain
advice about coping with internal and external challenges. Mentorship is intentionally threaded
through all programs in the School of Interdisciplinary and Graduate Studies. Programs like the
Diverse Faculty, Staff and Graduate Student Welcome Day, Check-in and Connect, the Minority
Association of Graduate Students (MAGS), and the Directors of Graduate Studies’ (DGS) Lunch
and Learn Series all help support student persistence to graduation. Effective strategies have
been implemented by the professional schools of Dentistry, Law and Medicine and can be found
in Appendix B.
III. Impact
The impact section focuses on workforce diversity that includes faculty, (full, part-time,
tenure/tenure track and non-tenure-track); professional staff; and administrators. It will also
include information on the campus climate and cultural competency and other underrepresented
groups that UofL serves.
Workforce Diversity
One of the major indicators of impact is having a diverse workforce. Attention is paid to the
recruitment and retention of faculty and staff. The table below shows the race and gender of full
21and part time faculty, followed by a table that shows the goals for increasing diverse faculty for
the next five years.
22Faculty
Full and Part-time by Race and Gender, 2016
TOTAL
FULL TIME PART TIME
GENDER
GENDER
FEMALE MALE FEMALE MALE
RACE
American Indian/Alaska 2 . 1 . 3
Native
Asian 73 166 10 12 261
Black/African American 62 53 25 6 146
Hispanic/Latino 20 31 5 6 62
Native Hawaiian/Other Pacific 1 2 1 . 4
Islander
Non-Resident International 28 51 4 3 86
Two or More Races 5 7 2 1 15
Unspecified 1 8 . . 9
White 566 766 275 246 1,853
Total 1,084 323 274 2,439
758
URM Tenured and Tenure Track Faculty as a percentage of all Tenured
and Tenure Track Faculty
Target Population 2016-17 2017-18 2018-19 2019-20 2020-21
Underrepresented Minorities (URM) 10.7% 10.7% 10.9% 11.2% 11.5%
Faculty Recruitment
23UofL uses best practices in the recruitment and retention of under-represented faculty, including
intentional language in position descriptions that emphasize and promote an inclusive campus
community, such as:
Advertising in key diverse publications
Using the SREB data directory
Participating in and recruiting at research and diversity conferences and other
professional development programs that traditionally attract diverse faculty
Providing training to search committees to decrease the incidences of unconscious bias
Revising the current exit interview instrument and using the results to address problem
areas. UofL is also exploring the idea of having the survey administered by an entity
outside of the university.
Faculty Retention
To support the retention of faculty from underrepresented groups, each academic unit is required
to have its own faculty mentoring program. The Provost asks each dean to ensure that all new
faculty are offered a mentor and some units credit faculty mentoring activity as evidence of
teaching proficiency.
The Office of the Provost offers a year-long professional development series for new faculty
which includes workshops on topics such as “What You Need to Know About Promotion and
Tenure”, “Teaching Jumpstart: Strategies and Guidance for New Faculty”, “How to Write
Proposals that Get Funded and Papers that Get Published,” and “Facilitating Authentic
Conversations about Race in the Classroom.”
With regard to extension of the tenure clock, UofL’s governing document, The Redbook, allows
faculty on tenure-track (“probationary”) status to request an extension when facing “extenuating
circumstance.” Examples of extenuating circumstances are personal illness, the birth or adoption
of a child, or care of an ill family member. Up to two extensions may be granted, each for a
minimum of six months and a maximum of two years. The full policy is described at:
http://louisville.edu/provost/redbook/contents.html/chap4.html#4a2s2.
24Staff
Professional and classified staff are essential employees in the operation of the university. UofL
pays attention to recruiting and retaining staff by focusing on opportunities for educational and
professional development and improving the workplace environment. The table below shows
the race and gender of full time staff, followed by a table that shows the goals for increasing
diverse professional (exempt) staff for the next five years.
Staff by Race and Gender, 2016
Race Exempt Staff Non-Exempt Staff *Other Total
American Female Male Female Male Female Male Female Male
Indian/ Alaska
Native 2 2 1 1 0 0 3 3
Asian 43 41 47 9 35 58 125 108
Black/African
American 93 34 231 162 24 30 348 226
Hispanic/Latino 10 17 22 22 12 17 44 56
Native
Hawaiian/Other
Pacific Islander 1 0 1 0 2 0 4 0
Non Resident 49 78 5 7 20 51 74 136
Two or More
Races 10 2 12 7 8 7 30 16
Unspecified 4 3 5 3 2 4 11 10
White 857 386 945 447 302 403 2,104 1,236
TOTAL 1,069 563 1,269 658 405 570 2,743 1,791
*Other is comprised primarily of house staff in the School of Medicine and support staff on
temporary contracts within the Department of Athletics.
Professional Staff
Target Population 2016-17 2017-18 2018-19 2019-20 2020-21
Underrepresented Minorities (URM) 11.1% 11.1% 11.4% 11.6% 11.9%
Special attention will be given to ensure that URMs are not disproportionately affected by the
budget cuts.
25Strategies/Tactics/Actions
Use personal and professional networks to recruit professional diverse employees
Provide mentoring and coaching for career advancement
Create an apprenticeship program for physical plant staff to provide them with
promotional opportunities.
Executive /Administrative /Managerial
Target Population 2016-17 2017-18 2018-19 2019-20 2020-21
Underrepresented Minorities (URM) 11.5% 11.7% 12.0% 12.2% 12.5%
As of Fall 2016, eleven-percent (11%) of Executive/Administrative/Managerial staff are
underrepresented minorities. The goal is to increase the percentage over the next five year.
Strategies/Tactics/Actions
Use best practices in recruiting female and diverse administrators, including:
Reaching out to personal and professional networks
Networking at conferences and professional development programs such as HERS and
NCORE
Hiring search firms that have a proven record of identifying qualified women and diverse
people in their applicant pool.
Providing training to search committees to reduce the incidences of unconscious bias
26Campus Climate and Cultural Competency
Campus Climate
Campus climate is a major factor in the retention and success of students, faculty and staff.
UofL is strongly committed to building an inclusive learning and workplace environment.
Structures have been put in place to help monitor and improve the campus climate. In the past,
the Office of Institutional Effectiveness and Assessment (IE) administered a campus climate
survey every two years to formally assess the climate. Effective for implementation in Fall,
2017, IE developed two optional models for accessing the campus climate, and a two-year model
of assessment was agreed upon (see Appendix C).
In summer of 2016, we created and appointed a director of the Office of Diversity Education
and Inclusive Excellence. The primary focus of that office is to provide diversity education and
training in the areas of privilege, unconscious and implicit bias, micro and macroaggressions,
cultural competency, cultural appropriations and race and social justice issues.
Cultural Competency
The definition of cultural competency as noted in the Statewide Diversity Policy is an ability to
interact effectively with people of different cultures. A culturally competent individual has an
awareness of one’s own cultural worldview; possesses knowledge of different cultural practices
and worldviews; and possesses cross-cultural skills to better interact with those from other
cultures.
One major and consistent way to provide cultural competency for students is through the
curriculum. Since the 1990s, all undergraduate students have been required to take two cultural
diversity courses as a part of the general education requirements. In 2014, a task force was
appointed to revise the general education requirements. The revisions were approved in January
of 2017. General Education is now called the Cardinal Core Program and it requires all
students to take two diversity courses as described below:
Courses in U.S. Diversity (D1) will broaden students’ understanding of how the
experiences and opportunities of individuals and groups in the United States are shaped
27by the various historical, cultural and social structures and processes of stratifications.
These courses will center on race, socio-economic status and gender, and/or their
interactions with other social demographics.
Courses in Global Diversity (D2) will broaden students’ understanding of how the
experiences and opportunities of individuals and/or groups in non-U.S. societies are
shaped by the various historical, cultural and social structures and of stratification
locally or globally.
Students must take one course in U.S. Diversity (D1) and one in Global Diversity (D2). These
courses will meet and exceed the components of the definition of cultural competency by
providing learning outcomes and assessment of the knowledge students have gained in the
courses.
It should be noted that diversity content is infused throughout the curricula in many of the
academic units. However, there are two degree-granting units that provide content that enhance
students’ understanding of race, culture and gender: Pan African Studies (PAS) and Women’s
and Gender Studies (WGS).
PAS occupies an important place within the larger mission of the university’s quest for
advancing knowledge and understand of problems of the 21st century. The goals of the
department include the advancement of scholarship, research, and knowledge that contribute to
the understanding of social inequality and cultural diversity, particularly as it eschews racial and
ethnic bigotry and the intersectionality with other forms of oppression. PAS offers bachelors,
masters, and PhD degrees. The rich breadth and depth of the multidisciplinary field of Pan-
African Studies are reflected in the curriculum and programs of the department. The PAS core
curriculum focuses on Africa and the African Diaspora. In addition, PAS offers field of study
and internships experiences, and special courses on research methods, race, gender, diversity and
inter-cultural education.
Women’s and Gender Studies (WGS) is the interdisciplinary examination of women and gender
across cultures and epochs. WGS addresses significant omissions in traditional scholarship by
examining the history, contributions and accomplishments of women by studying the ways
gender has structured intellectual and social life. WGS calls attention to how issues of gender
intersect with other structures of power such as race, class and sexualities. WGS offers
bachelors; dual majors with Law and Social Work (MA and MSW); and MA and graduate
certificates.
28You can also read