TAURANGA CITY CENTRE ECONOMIC VIBRANCY UPDATE 2018 - Report Updated analysis and assessment for Tauranga City Council
←
→
Page content transcription
If your browser does not render page correctly, please read the page content below
TAURANGA CITY CENTRE
ECONOMIC VIBRANCY UPDATE
2018

Report
Updated analysis and assessment for Tauranga City
Council

14 May 2018
CONTENTS
Executive Summary                                                                  1
Progress since 2014                                                                1
Make up of Tauranga City Centre Economy                                            2
Tauranga centre – areas of focus                                                   5

Background                                                                         9
Key questions                                                                      9
    Methodology                                                                   10
Context                                                                           12
Progress since 2014                                                               13
    Relevant Strategic and policy framework                                       14
Overview: Tauranga City                                                           16
Economic context – Tauranga and centre growth                                     19

Opportunities for a resurgent City Centre                                        20
The role of city centres is changing                                              20
    High-value sectors concentrate in city centres                                20
    Vibrant centres make it easy to work, live and play                           21
    Changing retail landscapes and consumer behaviour                             22
Success is built on a broad agenda                                                23
    Success requires leadership and a shared vision                               24

City Centre economic vibrancy framework                                          26
Tauranga centre economic vibrancy framework                                       26
    Economic vibrancy outcomes                                                    28
    Features and supporting indicators/measures                                   28

Stakeholder perspectives                                                         30
    Enhance visitor experience and city amenities                                 30
    Consider the impact of parking and accessibility                              31
    Increase the range of CBD economic activity                                   31
    Understand rising development constraints and costs                           32
    Show vision, leadership and courage in decision-making                        33

Tauranga CBD – Areas of focus                                                    34

                                                             Commercial In Confidence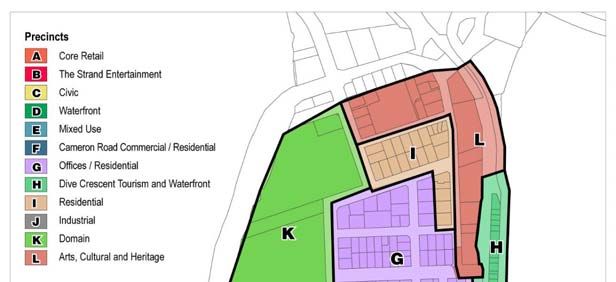
Recommended areas of focus                         35
       Manage development and infrastructure       35
       Visitors and Attractions                    35
       Focus on Inclusive Growth                   36
       Incorporate arts and culture perspective    37
       Support additional inner city residential   38

Tauranga CBD – Detailed analysis                   39
City centre geographical definitions               39
Data                                               40
Indicators of prosperity                           41
       GDP per capita                              41
       Productivity                                42
       Incomes                                     43
       Quality of life                             44
Indicators of economic activity                    45
       Growth in number of businesses              45
       Growth in jobs                              46
       Growth in population                        47
       Growth in visitor nights                    48
       Growth in visitor expenditure               49
Indicators of inclusion                            50
       Employment rate                             50
       Labour force participation                  51
       Unemployment rate                           52
       Reduction in beneficiaries                  53
       Deprivation index                           54
Business environment                               55
       Non-residential building consents           55
       Perceptions of ease of doing business       55
       High growth firms                           56
Diversity and specialisation                       56
       Employment in “high-value” sectors          56
       Economic diversity – Tress index            58
Knowledge resources and talent                     59

Commercial In Confidence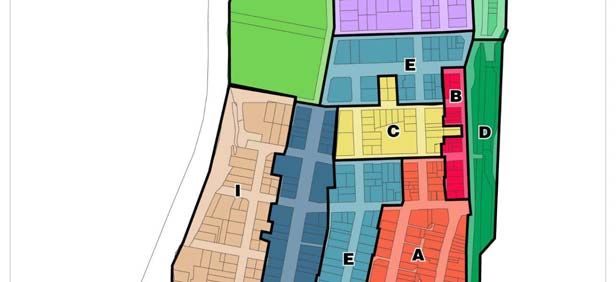
Degree qualified as proportion of workforce                                    59
    Proportion of employment in creative industries                                59
    Number of skilled migrants                                                     59
    Growth in knowledge intensive industries                                       60
    Level of core human resources in science and technology                        60
Amenities                                                                          61
    Urban open area space                                                          61
    Crime                                                                          62
    Perceptions of safety                                                          63
    Growth in retail activity                                                      64
    Growth in cultural offerings or industry                                       64
    Proportion of population that engage with the arts                             65
Built environment                                                                  66
    Housing affordability                                                          66
    Vacancy rates – office and retail                                              66
    Average office and retail rents                                                67
Connectivity and infrastructure                                                    67
    Road capacity                                                                  68
    Congestion                                                                     69
    Public transport                                                               69
    Access to broadband                                                            70

APPENDICES
Appendix 1 : Industry Definitions                                                 71
Appendix 2 : Comparator cities on vibrancy                                        74
Appendix 3 : List of Stakeholder Interviewees                                     75
Appendix 4 : Selected Bibliography                                                76

                                                              Commercial In Confidence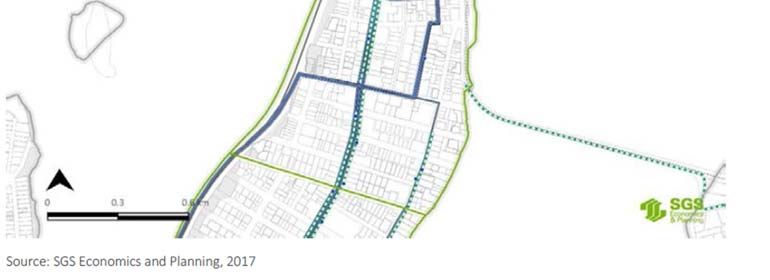
TABLES
Table 1:     City Centre economic vibrancy initiatives 2014 - 2018        5
Table 2:     Investment in city centre activations since 2014             13
Table 3:     City Centre strategy and policy framework                    14
Table 4:     Tauranga residential population trends                       16
Table 5:     Population and economic growth                               19
Table 6:     The 'Good' local economics model                             36
Table 7:     City centre geographic definitions                           40
Table 8:     Tress index change 2007-2017                                 58
Table 9:     Urban open space compared to other districts                 61
Table 10:    Tauranga office and retail rents by grade                    67
Table 11:    Means of travel to work - Tauranga central 2001-2013         70
Table 12:    Definition of knowledge intensive industries                 71

FIGURES
Figure 1: Employment in Tauranga City Centre area by sector.              2
Figure 2:    Tauranga city centre economic vibrancy framework             4
Figure 3:    Tauranga City Centre                                         12
Figure 4:    Tauranga City age demographics vs New Zealand                17
Figure 5:    Tauranga male and female population by age group             17
Figure 6:    Updated Tauranga city centre economic vibrancy framework     27
Figure 7:    Te Aranga Māori design principles                            38
Figure 8:    Tauranga City Centre boundaries                              39
Figure 9.    Real GDP per capita, 2017 and growth (2014-17)               41
Figure 10. Productivity (GDP per filled job), 2017 and growth (2014-17)   42
Figure 11. Mean personal earnings, 2016 and growth (2013-16)              43
Figure 12. Median household income, 2017 and growth (2014-17)             44
Figure 13. Growth in number of business units (2014-17)                   45
Figure 14. Growth in number of filled jobs (2014-17)                      46
Figure 15. Growth in population (2014-17)                                 47

Commercial In Confidence
Figure 16. Growth in visitor nights (2014-17)                                                            48
Figure 17. Growth in domestic and international visitor expenditure (2015-18)                            49
Figure 18. Employment rate, 2017 and change in employment rate (2014-17)                                 50
Figure 19. Labour force participation rate, 2017 and change (2014-17)                                    51
Figure 20. Unemployment rate, 2017 and change (2014-17)                                                  52
Figure 21. Change in number of beneficiaries (2014-17)                                                   53
Figure 22. Deprivation index 2006 and 2013                                                               54
Figure 23. Annual value of non-residential building consents, Y/e Feb 2015-2018.                         55
Figure 24. Job growth in Professional, Scientific and Technology services (2014-17)                      56
Figure 25. Job growth in information media, telecommunications, internet and library services
           (2014-17)                                                                                     57
Figure 26. Tress index, 2017                                                                             58
Figure 27. Proportion of employed workforce with a degree or higher qualification, 2012
           compared to 2017                                                                              59
Figure 28. Job growth in knowledge intensive industries                                                  60
Figure 29: Crime victimisations in Tauranga city centre                                                  62
Figure 30. Crime victimisation occurrence, per 10,000 population (district-level)                        63
Figure 31. Growth in retail GDP, 2014-2017                                                               64
Figure 32. Housing affordability index, 2016, and growth (2013-2016)                                     66
Figure 33: Map of transport infrastructure within the Tauranga CBD                                       68
Figure 34: Tauranga congestion indicators, March data                                                    69

                                                                                    Commercial In Confidence
PREFACE
This report has been prepared for Tauranga City Council by Philippa Bowron (Lead, Local
Government), Karyn Stillwell (Senior Consultant) and Tim Borren (Consultant) from MartinJenkins
(MartinJenkins & Associates Limited).
MartinJenkins advises clients in the public, private and not-for-profit sectors. Our work in the public
sector spans a wide range of central and local government agencies. We provide advice and support
to clients in the following areas:
public policy
evaluation and research
strategy and investment
performance improvement and monitoring
business improvement
organisational improvement
employment relations
economic development
financial and economic analysis.
Our aim is to provide an integrated and comprehensive response to client needs – connecting our skill
sets and applying fresh thinking to lift performance.
MartinJenkins is a privately owned New Zealand limited liability company. We have offices in
Wellington and Auckland. The company was established in 1993 and is governed by a Board made up
of executive directors Kevin Jenkins, Michael Mills and Nick Davis, plus independent director Hilary
Poole (Chair).
Commercial In Confidence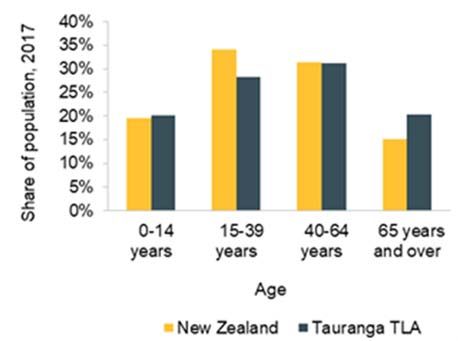
EXECUTIVE SUMMARY
In 2014 Tauranga City Council engaged MartinJenkins to report on Tauranga City Centre economic
vibrancy.
This report is a refresh of Part One of the 2014 report that revisits the analysis and assumptions,
updates the understanding through research and a literature review, considers the activities that
Tauranga City Council has undertaken to affect the economic vibrancy of its city centre and looks at
updated data on the city and the region in comparison to a selection of other cities.
Part Two, an analysis of parking in the CBD was not refreshed at this time as a revision would provide
limited value over a 3 year period.
This report confirms that the previous work on the make-up of an economically vibrant city is still
relevant. It confirms the definition of a vibrant city as one that attracts people to visit, live, work and do
business due to the combination of amenities and opportunities it offers. Vibrant city centres
encourage the concentration of activities that benefit from operating in close proximity and are
characterised by employment in high value and knowledge-intensive sectors and high levels of
productivity.
The 2014 report’s findings that local authorities can increase the economic vibrancy of city centres
through leadership, delivering infrastructure, regulatory and planning functions, and working with
private sector and community partners still holds true and these were the key themes of the interviews
with stakeholders. They confirmed the continuing need for a clear shared vision for the centre and its
future, ensuring an enabling regulatory and planning environment, and identifying and addressing
priorities with business, investors and the wider community.

Progress since 2014
There has been progress in addressing the centre’s vibrancy issues since the 2014 report and this has
resulted in positive movement in the city centre’s data indicators.
Compared with Queenstown, New Plymouth, Dunedin and Hamilton; Tauranga city centre had the
largest growth in the number of business units over the last three years (3.8 percent p.a.) by a
substantial margin, though growth was slightly lower in the city centre than for the overall Tauranga
district (4.4 percent p.a.). Tauranga city centre had strong employment growth – second only to
Queenstown, and larger growth than the Tauranga district.
There has been very high city centre job growth in the Professional, Scientific and Technology
services sector, which makes up over a fifth of all city centre jobs (the largest single sector). The city
centre had 733 additional jobs in this sector, representing growth of 9.5 percent per year, compared
with overall job growth in the city centre of 5.2 percent per year over that period. Tauranga city centre
saw higher job growth in this sector than in the comparator centres, with the exception of Queenstown
(10.7 percent per year growth).
It is worth noting that many cities are aiming for job growth in this sector, due to the high levels of
“weightless” product that are produced from it and the associated implications for sustainability and
future-proofing. It generally proves challenging due to world-wide skills shortages, so Tauranga’s
success in this area is commendable.

                                                                                                             1

                                                                                       Commercial In Confidence
Analysis of Tauranga against a model of city centre vibrancy shows a generally positive picture and
that the economic vibrancy of the city centre is improving, albeit with room for continued activity and
improvement. One area of opportunity identified in this refresh is the concept of an ‘inclusive growth’
model, in line with Local Government Act changes to include the four well-beings in the remit for Local
Government. A number of activities underway in the city centre provide an indication that it is on the
cusp of significant change, including the University of Waikato Tauranga campus development, the
Heart of the City projects and the development of more high-rise residential in the CBD.
Make up of Tauranga City Centre Economy
The Tauranga City Centre economy consists of a large and growing commercial sector. The
comparison between 2014 and 2017 shows a slight increase in commercial, but importantly
demonstrates the importance of the commercial sector in influencing the economic activity of the CBD.
Figure 1: Employment in Tauranga City Centre area by sector.
2014 2017
23% 23%
7% 7%
58% 59%
12% 11%
Commercial sector Retail sector Commercial sector Retail sector
Food and beverage sector All other sectors Food and beverage sector All other sectors
Source: Infometrics
The commercial sector participants we interviewed suggested that a stronger connection with more
elected members of Council would be welcomed.
Tauranga is operating in a context of a number of plans and strategies. This report summarises these
as they relate to the CBD vibrancy. In particular we note that the Tauranga City Centre Spatial
Framework appears to address a number of topics and suggestions that were raised by stakeholders,
2
Commercial In Confidenceincluding connecting the city more to its waterfront, incorporating a distinct identity, having a focus on
people to ensure it is a truly liveable city and aiming to be more internationally competitive.
Tauranga centre has seen a slight average annual decline in the residential population since the 2014
report, but has achieved an average annual increase in GDP of 6.6%, significantly higher than the
national average GDP growth over the same period of 3.7%. This is a very positive indicator for the
city centre. If measures can be taken to increase central residential numbers, the overall CBD
vibrancy will improve.
The city experienced soft job growth in the city centre retailing sector1 (2.2% per year over 2014-
2017), although this was still stronger growth than in comparator centres.
Research identified Brisbane as a city that has addressed some of the issues being faced by
Tauranga with positive results. It has seen rapid growth, supported strongly by central and local
government, by:
deploying specialist teams to attract businesses and events
mobilising private sector “ambassadors”
providing a platform for private and public sector investment and
delivering projects designed to increase the liveability of the city.
We have revised the framework used in the 2014 report to provide for developments in aspects like
ICT infrastructure and its importance to attracting residents, tourists and businesses to city centres.
1
“Other store and non-store retailing” sector, which comprises 7 percent of city centre employment.
3
Commercial In ConfidenceThe updated city centre framework shown below: Figure 2: Tauranga city centre economic vibrancy framework Source: MartinJenkins 2018 The drivers and outcomes of economic vibrancy shown in the framework are consistent with the views expressed by the stakeholders we interviewed. There is an overall optimistic view of Tauranga’s ambition to have a vibrant city centre and stakeholders commented that there had been a momentum shift. Although there was consensus that more can be done to attract tourism through enhancing visitor experience and providing better attractions. There are also views that increasing the range of economic activity in the CBD and providing strong leadership vision will have a positive effect. 4 Commercial In Confidence
Tauranga centre – areas of focus
The following table shows progress to date on the recommendations in the 2014 report, combined with
recommendations on continued areas of focus from the 2018 analysis.

Table 1: City Centre economic vibrancy initiatives 2014 - 2018
 Area of Focus (2014)     Recommendation            Progress since 2014                                         Recommendations
                          in 2014                                                                               in 2018
 Identify 3 – 5 City      Review strategy and       Development of Heart of the City Programme, this            Continue to consider
 Centre Strategy          agree smaller             includes civic amenity projects such as a new library,      larger scale civic
 actions at a scale       number of large           museum, civic plaza, civic administration building and      development like the
 that will deliver long   scale Initiatives         performing arts centre.                                     museum and/or
 term impact                                                                                                    library propositions.
                                                    Spatial Framework 2017 has been developed setting
                                                    out city centre streetscape, open space and waterfront
                                                    investment over the next 30 years.

                                                    Working with Tangata Whenua to develop Tauranga
                                                    Māori Design Principles to be incorporated into the
                                                    Spatial framework.

                          Continued fast-           Partnership with Ngati Tapu and Ngai Tamarawaho to
                          tracked and higher        see their aspirations and values restored to the
                          spec development of       waterfront.
                          the waterfront (lead)
                                                    Waterfront masterplan currently being refreshed to
                                                    align with Spatial Framework 2017 and future
                                                    developments forecast from “bridge to bridge”.

                                                    Delivery of Marine Precinct Mid 2018.

                          Amenity upgrades          Durham St/Lane upgrade project will commence                Support
                          that align with private   construction middle of 2018 to align with Tertiary          complementary
                          sector investment         Campus.                                                     services to the
                          (lag)                                                                                 University campus -
                                                                                                                research related
                                                    Aspen Reserve upgrade will be delivered late 2018 to        services and student
                                                    align with the private commercial development (“The         accommodation.
                                                    Reserve”) completed mid 2018
                                                                                                                Shared spaces to
                                                                                                                address perceived
                                                    Concept designs underway to upgrade streetscape             disconnects
                                                    environments adjacent to the Farmers Redevelopment          between the CBD
                                                    and refurbishment of Regional House.                        and the waterfront.
                          Marketing initiatives     Heart of the City Programme
                                                    Paradox Street Art Festival 2017
                                                    Marine Precinct Project
                                                    City Centre Development Response Plan
                                                    City Events supporting event initiatives in city centre
                                                    Strategic Activation of Willow St “Our Place”
                                                    development

                                                                                                                                 5

                                                                                                         Commercial In Confidence
Area of Focus (2014) Recommendation Progress since 2014 Recommendations
in 2014 in 2018
Strengthen council Establish a city Completed and Manager in place. Continue to work
oversight of city centre manager role with developers and
centre development within council. partners on large
developments.
Continue to involve
developers and key
stakeholders on how
they can contribute
to city centre
vibrancy.
Adopt a set of Completed – this report and its associated data Focus on the
economic vibrancy sets. inclusive growth–
indicators Wellbeing approach.
A wider transport Parking Challenge Report 2017 Review and plan for
analysis the significant
increases of inner
Parking Plan under development city dwellers
predicted, especially
Tauranga Transport Model currently under with respect to
development. parking.
Build on and extend Heart of the City Programme Encourage a retail
partnerships with offering tailored for
retailers in the centre the main users of
City Centre Development Response Plan currently the CBD (workers,
under development visitors and
students).
Farmers Redevelopment will provide mixed use Encouraging multi-
(retail, food & beverage and residential). use developments
as well as student
accommodation
facilities.
Review the Tauranga Priority One supported companies in their Incorporating arts
Business Case relocation to Tauranga. and culture
Campaign in relation perspective in
to the city centre. design and planning
for the CBD as a
way of growing
Tauranga City
Centre’s distinct
brand.
Consider the role of Draft Tauranga Urban Strategy has been adopted
zoning and by Council.
investment outside of
the city centre.
Build on work with Work with Not included in the work programme during this time.
existing key landlords/developers
partners to progress seismic
strengthening
6
Commercial In ConfidenceArea of Focus (2014) Recommendation Progress since 2014 Recommendations
in 2014 in 2018
Investigate the Draft Tauranga Urban Strategy (2017). Provide support and
potential of demand facilitation for
for quality affordable developers to
medium and high develop a closer
density housing in relationship
the centre approach to
development and
infrastructure,
particularly where
multiple
landowners/land
purchases are
involved.
Build an Western BOP International Strategy (2016 – 19), Improve CBD
understanding of Qrious Visitor Analysis (2016) attractions so that
what will attract more visitors are not
local, domestic and Support for Education Tauranga - Increased the automatically drawn
international visitors value of international education to the sub-region to Mt Maunganui or
to Tauranga into the by 26% Rotorua.
city centre Development of the future University of Waikato Attract and retain
Tauranga campus underway firms in knowledge
intensive industries.
On the basis of the evidence and analysis included in this report, we suggest the following areas of
focus for Tauranga City Council.
Keep doing:
Focus on attracting and retaining firms in knowledge intensive industries.
Key projects like the Waikato University campus including supporting its potential for
complementary services, other educational institutions and research related services as well as
opportunities for student accommodation.
Encouraging a retail offering that is tailored for the main users of the CBD (workers, visitors and
students).
Reviewing and planning for the significant increases of inner city dwellers predicted, especially
with respect to parking.
Encouraging multi-use (mix retail/residential) developments as well as student accommodation
facilities.
Working with developers and partners on large developments and looking considering the use of
public land to help stimulate local development.
Talking to and understanding the views of developers and key stakeholders including how they
can contribute to city centre vibrancy.
Designing more shared space (like the Durham Street/lane upgrades) in appropriate areas,
particularly to address perceived disconnects between the CBD and the waterfront.
7
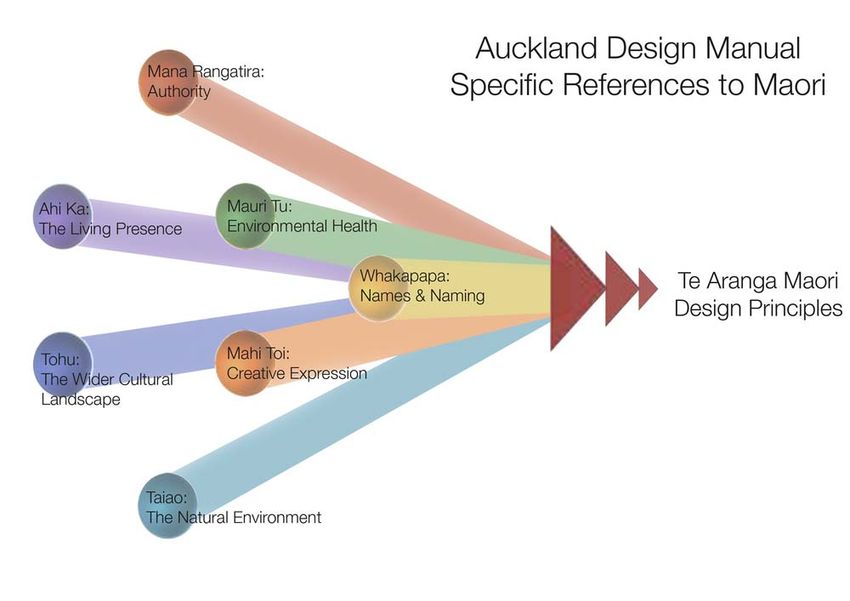
Commercial In Confidence Incorporating arts and culture perspective in design and planning for the CBD as outlined in the
Tauranga City Centre Spatial Framework and through the formal adoption of the Toi Moana Arts
and Culture Strategy as a way of growing Tauranga City Centre’s distinct brand.
Consider doing:
Provide support and facilitation for developers to develop a closer relationship approach to
development and infrastructure, particularly where multiple landowners/land purchases are
involved.
Increase investment and activation programming timelines to improve CBD attractions so that
visitors are not automatically drawn to Mt Maunganui (or Rotorua).
Focus on the inclusive growth model for local economies - promoting the social, economic,
environmental, and cultural well-being of communities, in a sustainable manner.
8
Commercial In ConfidenceBACKGROUND
Tauranga City Centre commissioned MartinJenkins to carry out a refresh of our earlier Tauranga City
Centre Economic Vibrancy Report (2014). The work included an update of the city centre economic
framework which highlights outcomes associated with economic vibrancy and supporting measures
and identifies the roles and contribution of local government. A detailed economic analysis has also
been undertaken to gain insights into the economic performance of Tauranga’s city centre across a
number of different dimensions. The analysis included comparison of economic vibrancy indicators
with Hamilton, New Plymouth, Dunedin and Queenstown city centres.
In the 2014 report, we noted the importance of the city centre vibrancy to both the city and the wider
region: it contributes to higher levels of productivity, incomes and jobs by offering the right mix of
employment and leisure opportunities. This remains true and the objective of this refresh is to support
city decision makers by providing evidence as to whether interventions are working, and to re-test
whether the framework is still valid for Tauranga city centre today.
The city is experiencing considerable growth which is creating pressure on transport and other
infrastructure. This research will support the Council and its partners (including developers, investors,
retailers, the community and key stakeholders) in understanding the role that the city centre is playing
in the context of the wider city area and the region as well as how it compares to other cities across
New Zealand.
It will support the city in its decision-making as the centre evolves over the next five to ten years.
Key questions
Our analysis has been guided by the following key questions that are consistent with the 2014 report:
What is the future role of city centres, and what trends are supporting these roles?
How can Tauranga city centre take full advantage of these opportunities and trends?
How economically vibrant is Tauranga city centre?
- What trends and changes are observable over time?
What is the role of investment (public and private) and what are investor/developer perspectives
on:
- the long-term growth potential of Tauranga centre?
- changes in economic activity in Tauranga centre over the next 10 years?
- investment plans and rationale in the centre?
What can Tauranga City Council do to encourage the economic vibrancy of the city centre?
9
Commercial In ConfidenceWe have altered the comparator question to:
How has Tauranga city centre performed in relation to comparator New Zealand cities2:
- Hamilton
- Dunedin
- New Plymouth
- Queenstown
The MartinJenkins 2014 report used Hamilton, New Plymouth and Hutt City as comparators. In
consultation with Tauranga City Council, it was decided that for the 2018 update Hutt City would be
replaced with Dunedin as Dunedin has better alignment in terms of economic drivers than Hutt City.
Hutt City attracts a slightly different population demographic and has comparatively low domestic and
international visitor numbers.
Hamilton, Dunedin and New Plymouth were chosen as they are cities with similar characteristics to
Tauranga in terms of size, demographics and structure of the CBD economy. Each of these cities also
support similarly sized wider populations. Queenstown was added as a comparator as it has
experienced rapid growth and is seen as an “aspirational” comparator city, though some features of
the Queenstown city centre differ from Tauranga, such as a greater focus on visitors.
In addition to the key questions in the 2014 report, we have added:
Has the importance and role of city centres changed?
What is a relevant and appropriate economic framework for the city centre today?
How have things changed since 2014?
What should the council’s focus be now?
Methodology
This refresh has been developed using methodology consistent with the 2014 report. We have used
the same five-phase approach:
1 Update of the city-centre economic framework that sets out indicators of economic vibrancy,
identifies the factors that influence it, and identifies the potential roles and contribution of local
government. The framework is drawn from domestic and international literature and includes
supporting measures and a set of indicators of city centre economic vibrancy.
2 Identify major economic drivers and challenges for city centre development. Building on the
previous report and the literature review that informed the development of the city-centre
economic framework, we identify the key roles and drivers of Tauranga’s city centre economic
vibrancy.
3 Review Tauranga city centre performance. We have used the framework and the previous
report alongside updated data to review the performance of Tauranga’s city centre, highlighting
key trends, and strengths and weaknesses. This identifies where Tauranga city centre is
performing well or may have the potential to do better, in relation to the wider city and in relation
2
Where Infometrics data has been used, Whangārei is also included as a comparator as part of the package offered by Infometrics.
10
Commercial In Confidenceto four comparator cities: Hamilton, Queenstown, Dunedin and New Plymouth. It also informs
where current interventions are effective or where they are not.
4 Interviews with current and potential investors/commercial tenants and key stakeholders
to gather more qualitative data and to test and validate the data analysis. This augments the
analysis of historical data by providing information on future private sector perceptions,
development activity and plans, including constraints.
5 Recommendations on areas of focus and activity. The report recommends priorities for
Tauranga City Council, with key partners including investors and business owners, which will
increase commercial activity in the city centre. It also recommends a set of baseline indicators
that can be used to monitor progress – and the effectiveness of trials or other interventions –
towards increasing the economic vibrancy of Tauranga’s city centre.
In practice, given this is a refresh and we were asked to change the comparator cities, applying the
approach required the following activities:
Removed Hutt City from 2014 analysis and added Queenstown and Dunedin.
Reviewed relevant literature, strategies and reports published since 2014.
Reviewed and updated the city centre economic framework to ensure it is relevant and
appropriate.
Reviewed the city centre components of the Tauranga urban centres technical assessment:
Urban structure report (2017).
Re-ran the detailed economic analysis using the framework on Tauranga, Hamilton, New
Plymouth, Dunedin and Queenstown, incorporating the most up-to-date available data.
Provided an excel workbook of indicators so that progress can continue to be tracked in the
future.
Interviewed 13 key stakeholders (including current and potential investors, developers,
commercial tenants and property experts) to test whether the themes identified in the 2014 still
endure, and to what extent initiatives since 2014 have made a meaningful difference.
Recommended areas of focus for Tauranga City Council.
11
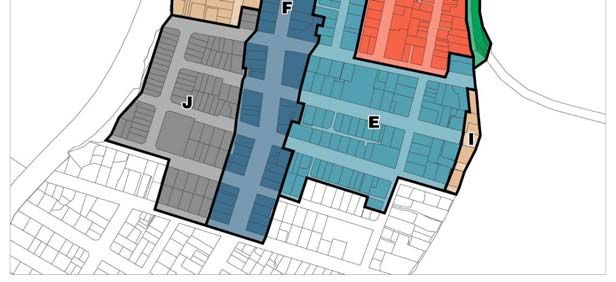
Commercial In ConfidenceContext The area and precincts designated as CBD are as follows: Figure 3: Tauranga City Centre Source: Tauranga City Centre Strategy, page 81 12 Commercial In Confidence
Progress since 2014
Since the 2014 report Tauranga City Council and its partners have undertaken (or committed to
undertake), a number of activities designed to impact on the vibrancy of the City Centre. Examples are
listed below:

Table 2:        Investment in city centre activations since 2014

 Source                    Activation                                       Description

 2014/15 Annual            Hairy MacLary and Friends                        A collaborative project between Creative Tauranga
 Report                    waterfront sculpture                             and multiple donors. Tauranga City Council provided
                                                                            project management support, and assisted with
                                                                            installation and landscaping costs.
 2015/16 Annual            University of Waikato Tauranga                   Project agreement for the development of the future
 Report                    campus                                           University of Waikato Tauranga campus

 2015/16 Annual            Support for Education Tauranga                   Increased the value of international education to the
 Report                                                                     sub-region by 26%
 2015/16 Annual            Business attraction                              Priority One supported four companies in their
 Report                                                                     relocation to Tauranga
 2015/16 Annual            Community events                                 13 community events funded by TCC (some in the
 Report                                                                     city centre), $50k in Community fund, note $465k in
                                                                            Major Events fund
 2015/16 Annual            Civic Spaces Options Project                     Explore feasibility of new CAB building, car parking,
 Report                                                                     open space, library, museum, performance venue
 2015/16 Annual            ‘From Tauranga to the Trenches’                  > 25,000 visitors
 Report                    exhibition series
 2015/16 Annual            Dive Crescent cycle path                         Part of the wider urban cycle network, 10 routes that
 Report                                                                     cover 150 km across the city
 2015/16 Annual            Marine Precinct Project                          Marine servicing facility, funded by the Regional
 Report                                                                     Infrastructure Fund (TCC and Bay of Plenty Regional
                                                                            Council)
 2016/17 Annual            Paradox Street Art festival                      7,630 visitor nights and $691k of regional GDP
 Report                                                                     generated, 49,000 viewed Banksy exhibition
 2016/17 Annual            Heart of the City Programme                      New CAB building, open space, library, museum,
 Report                                                                     performance venue, waterfront planning, streetscape
                                                                            and city centre living
 2016/17 Annual            Water access project                             Creation of tidal steps and bombing platform.
 Report                                                                     Partnership with Ngati Tapu and Ngai Tamarawaho
                                                                            to see their aspirations and values restored to the
                                                                            waterfront
 2018/19 Draft             Proposed new Museum                              In 2025, $20.7 m
 Long Term Plan
 2018/19 Draft             Proposed new Library                             In 2021, $25 m
 Long Term Plan

Source: https://www.tauranga.govt.nz/council/council-documents/annual-reports

                                                                                                                                    13

                                                                                                            Commercial In Confidence
Relevant Strategic and policy framework
Since the development of the Tauranga City Centre Strategy in 2012 there has been significant work
undertaken to understand the CBD structure, economic framework and related drivers. Note that the
following strategies complement each other and are integral to understanding the full picture.
Table 3: City Centre strategy and policy framework
Relevant strategic documents Description
Tauranga City Centre Strategy (2012) This strategy guides CBD development over the next 25 to 30 years
and sets out preferred directions for growth. A number of partners
help deliver on the actions of the strategy, as well as the Heart of the
City programme team. The City Transformation Committee oversees
implementation of the strategy and projects. There is also an external
Technical Advisory Group (urban design and architecture experts)
which provides recommendations to the Committee and Council.
The strategy has a number of themes and objectives in the areas of:
Activities
Buildings
Public spaces and connections
Access
Leadership and management
The strategy also outlines a vision, issues and opportunities for each
of the CBD’s precincts.
Tauranga City Centre Spatial Framework This framework is a ‘living document’ that provides a comprehensive
(2017) and integrated vision for the CBD and identifies design aspirations
and initiatives for the city centre landscape, waterfront and open
space. It provides clarity around public investment priorities and their
criteria, and is the bridging document between the Tauranga City
Centres Strategy (2012) and individual project plans.
A renewed vision for the CBD was devised and it is supported by the
following aspirations:
People first and place
Heart of the city
Connected to water
Compact
Sustainable
Distinctive identity
Creation of the Tauranga Maori design principles
For living
Design conscious
Internationally competitive
The framework is built on community engagement, including input
from Ngai Tamarawaho and Ngati Tapu (as mana whenua in the city
centre). This approach provides for outcomes that were inspired and
driven by the community.
Draft Tauranga Urban Strategy (2017) This draft strategy sets the aspirational form for delivering Tauranga
as an internationally competitive city. It advises Council on how to
plan and manage for growth over the next 50 years, and outlines
critical areas where action is required: housing, transport, ageing
population, environment, economy and tangata whenua. The
14
Commercial In ConfidenceRelevant strategic documents Description
strategy recommends the focus be on a ‘centres based’ urban form
which enables residential growth in and around town centres. It
outlines 9 priority areas (with an associated action plan) for Council
to focus on:
Get more actively involved in the Tauranga housing market
Advance a revised urban form
Improve connectivity in suburban areas and new greenfields
Prioritise investment in facilities, amenity and improved
accessibility in the city centre
Start planning and investing in Tauranga with the aged in mind
Development of Treaty Settlement and Maori land
Placemaking to deliver a competitive city in which to invest and
work
Growing the economy
Protect and enhance the natural environment
.
Western Bay of Plenty International Strategy The strategy identifies actions to help promote tourism and trade,
(2016 – 2019) - Western Bay of Plenty and to help attract and retain investment and skilled people to
Internal Relations Working Group Tauranga City and the WBOP. The three areas of focus are:
Investment and trade - including foreign direct investment,
business relocation, migrant investors and trade.
People - including migrant attraction and settlement, tourism
flows, international education and temporary migrant worker flows.
Relationships and partnerships - including onshore and offshore
relationships and partnerships.
This strategy is due for review in 2018.
SmartGrowth Strategy SmartGrowth is the sub-region’s 50 year spatial plan, with a focus on
(2004, updated in 2013) next 20 years. SmartGrowth is a collaboration between the sub-
region’s local authorities and tangata whenua, the SmartGrowth
Partner Forum, businesses, education groups, industry and the
community. It sets the strategic vision and direction for the growth
and development of the WBOP on key issues. The 2004 strategy had
a growth focus, whereas the 2013 strategy considers a range of
social, environmental, economic and cultural objectives. Its focus is
on the following areas of interest:
Strengthen visionary leadership and collaboration
Sustain and improve the environment
Build the community
Grow a sustainable economy
Recognise tangata whenua cultural identity and change
SmartEconomy Strategy (2012) This strategy complements SmartGrowth and provides
recommendations and multiple activities/actions to help grow a
sustainable economy. It aims to encourage a thriving city centre with
key anchor projects from the City Centre Strategy (2012) e.g.
waterfront upgrade, international hotel, conference centre/museum. It
also called for an increased focus on earthquake strengthening in the
CBD. A lot of recommendations have been completed or are
underway since this strategy was published.
15
Commercial In ConfidenceOverview: Tauranga City
As at June 2017, Tauranga is the fifth largest city in New Zealand. At the time of the 2014 report it was
the sixth.
The latest 2017 Statistics New Zealand population estimates place Tauranga’s usually resident
population at 131,500 people. Tauranga city’s TLA area population was 114,789 in 2013.
Tauranga predicts that the city’s population will to continue to grow, reaching 195,852 by 2063. The
Western Bay of Plenty is also expected to experience future growth. This growth is managed through
the SmartGrowth strategy - a shared vision between the strategy partners: Tauranga City Council,
Western Bay of Plenty District Council, Bay of Plenty Regional Council, tangata whenua, partner
community/business organisations and key Government agencies - like the New Zealand Transport
Agency.
The wider Bay of Plenty region is New Zealand’s fifth-largest region by population. It is home to 3
percent of New Zealand’s total population.
Net migration to Tauranga city and the Western Bay of Plenty is above average across all age groups,
except for 15-24 year olds. Many new residents come from Auckland or the neighbouring Waikato
region, including young families and older people.
Table 4: Tauranga residential population trends
Population Population Grow th, 2012-17
2012 2017 (% p.a.)
Tauranga city centre 2,310 2,250 -0.5%
Tauranga city TLA 118,300 131,500 2.1%
Bay of Plenty 278,800 299,900 1.5%
New Zealand 4,408,100 4,793,900 1.7%
Source: Statistics New Zealand, subnational population estimates. Infometrics city centre population estimate.
As shown below, Tauranga has a higher proportion of older residents than New Zealand: 20.3 percent
of Tauranga’s residents are aged 65 years and over, compared to 15.1 percent nationally. This older
population profile provides the city with challenges and opportunities and has implications for the
development of the city centre and economic growth.
16
Commercial In ConfidenceFigure 4: Tauranga City age demographics vs New Zealand
Source: Statistics NZ, 2017 Subnational population estimates
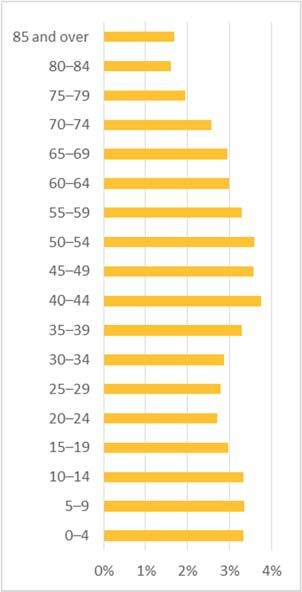
The gender age breakdown for the Tauranga City population is as follows:
Figure 5: Tauranga male and female population by age group
Male Female
85 and over
80–84
75–79
70–74
65–69
60–64
55–59
50–54
45–49
40–44
35–39
30–34
25–29
20–24
15–19
10–14
5–9
0–4
0% 2% 4%
Source: Statistics NZ, 2017 Subnational population estimates
Tauranga also has a lower proportion of working age (15-64 years) residents than nationally: 59.5
percent compared to 65.5 percent.
17
Commercial In ConfidenceIn comparison with other cities, Tauranga also has a lower proportion of residents in their twenties and
thirties than other cities, currently 22.2%3. The median age of Tauranga residents in 2017 was 41.2
(compared with 37 years nationally). Retaining and attracting working age residents is a priority.
The Tertiary Education Action Plan and planned Tauranga Tertiary Education Campus aims to support
the retention of young people in the city. It will also seek to increase migration to the city (including
international students) to access tertiary provision tailored to the city and sub-region’s needs.
The following table provides a snapshot of the economic performance of Tauranga city and its centre
during the period from 2001 and 2013. This historical performance provides the context for
considering future areas of focus and action in the city centre.
3
Dunedin 29.2%, Queenstown 36.4%, Hamilton 32.8%, Whangarei 20.5, New Plymouth 22.8%
18
Commercial In ConfidenceEconomic context – Tauranga and centre growth
Table 2 provides key population and economic stats for the City centre, District and New Zealand. Since 2014, population of the City centre has fallen slightly,
but the District has grown at a faster rate than or New Zealand as a whole. Measures of economic growth in both the City centre and the District are higher
than for New Zealand, but labour productivity growth for the District is modest.
Table 5: Population and economic growth
City centre District New Zealand
2014 2017 Growth (p.a.) 2014 2017 Growth (p.a.) 2014 2017 Growth (p.a.)
Population 2,290 2,250 -0.6% 121,800 131,500 2.6% 4,509,700 4,793,900 2.1%
GDP (2010$m) 856 1,038 6.6% 4,549 5,336 5.5% 211,473 235,489 3.7%
GDP per capita (2010$) 37,348 40,578 2.8% 46,893 49,123 1.6%
Productivity (GDP per filled
job) 68,099 70,882 1.3% 77,081 79,062 0.8% 94,394 97,707 1.2%
(2010$)
Business units 1,986 2,220 3.8% 13,980 15,912 4.4% 530,139 563,295 2.0%
Filled jobs 12,570 14,644 5.2% 59,019 67,487 4.6% 2,240,317 2,410,161 2.5%
Green = higher than total NZ
Pink = lower than total NZ
19
Commercial In ConfidenceOPPORTUNITIES FOR A
RESURGENT CITY CENTRE
In this section we have re-stated the key points from the 2014 report, but updated with new information
and research where appropriate.
The role of city centres is changing
City centres develop because their locations minimise transport and transaction costs for economic
activity. They are sites for settlement in proximity to key assets such as roads, ports, airports or
railways. City centres also were historically service centres for broader city-regions. They provided
services to support the export and import of inputs and products to and from the region (to other
regions and offshore).
City centres continue to be service centres and logistics hubs but the costs and nature of doing
business is changing, which is altering their roles relative to broader regions.
Tauranga city has developed based on its proximity to a port and its central location relative to a range
of primary sector activities.
High-value sectors concentrate in city centres
A large body of international literature highlights the following trends in relation to cities and the roles of
their centres:
Cities facilitate economies of scale of all types: the scale and density of economic activity that
cities can support allows for specialisation, increasing economic diversity and better matching of
businesses and workers that builds economic resilience.
High value service industries tend to cluster together: these knowledge industries benefit
from locating in close proximity. They concentrate because of the benefits of sharing knowledge,
skills matching, and more efficient input-output sharing. This spatial concentration is known as
agglomeration. Contrary to expectations, the evidence shows technology does not replace the
need or benefits of face-to-face interaction for these industries (World Bank, 2009).
Agglomeration is amplified by density and weakened by distance: agglomeration is a self-
reinforcing process. Increased density helps build density and productivity in a positive cycle.
Cities with concentrations of high value activity in their centres are therefore important for
increasing the competitiveness and standard of living of their wider city-regions.
These knowledge industries characteristically employ highly skilled workers who provide technical,
scientific, and professional services to other sectors. They include finance and insurance, scientific
and engineering services, information technology and communications, and related services. They
20
Commercial In Confidencebenefit most from agglomeration because of the importance of proximity to other firm’s workers and
consumers.
These industries require highly skilled workers. They are also more likely to invest in research and
development. Access to tertiary qualified workers and research facilities is critical for these industries
(World Bank 2009).
Research has identified agglomeration benefits in New Zealand. Firms concentrated in higher density
areas in New Zealand are more productive than firms in less dense areas (NZTA, 2009). Research
has also confirmed that Auckland’s centre is more productive than the city as a whole (Ascari 2008;
Motu 2011).
These productivity benefits are important because they offset typically higher space and transport
costs within established central areas, i.e. the benefits of doing business in the centre are sufficient to
outweigh the higher financial costs of locating inside the centre.
Workers in these firms also drive growth and investment in supporting industries, for example food
services and entertainment. These supporting industries help build the amenity and economic diversity
and/or vibrancy in a centre. They also encourage residents and visitor footfall as part of a broader
cultural, social and community offering.
However, there are signs that agglomeration can be restricted to larger city centres. In the UK, the
performance of city centre economies has been variable. On average, larger cities’ centres have
become more important but medium and small sized cities have seen private sector jobs moving away
from the city centre. An appropriate response to this is to focus on increasing the economic scale of
the city centre. (Centre for Cities, 2013). In some cases, attracting firms through incentives to stimulate
business activity has proved effective.
Growth is best built on established and emerging firms and industries, investing in ecosystems of
innovation, trade, talent and infrastructure (The Brookings Institution 2016).
Agglomeration is not without disadvantages. It is not necessarily driven by the needs of people. It
encourages commuting and incentivises big business and the cost of smaller ones. It can leave behind
the low skilled and those living on the peripheries of cities. (Friends Provident Foundation 2016). The
implication is that city centre development should not exclude more local, grass roots developments.
Vibrant centres make it easy to work, live and play
“The real city is made of flesh, not concrete”.
Ed Glaeser, Triumph of the City, 2011
Successful city centres have the business, employment and leisure offerings that people want. At their
heart, they are places where people can come together.
Many cities have been encouraging mixed-use residential development in their centres to increase
density. Cities such as Melbourne have benefited from this city centre regeneration. Inner city and
centre periphery residents can range from young professionals to older people. These inner city
residents increase activity in city centres after working hours and at weekends. They bring cities alive
outside working hours. Also important are an attractive and functional physical environment, good
transport, and good infrastructure.
21
Commercial In ConfidenceAmenity, vibrancy and convenience attract residents into city centres. Residents typically value the
high quality cultural, civic and community amenity offered. This includes entertainment and food and
beverage, to civic buildings and places and people-friendly spaces, to city centre leisure, events and
activities. These amenities also attract visitors from across the city-region and beyond. Making good
use of temporary space (as has happened in Christchurch) also contributes to vibrancy.
Students and migrants also often choose to live in city centres. This is because housing is less
expensive than in the wider city (for example student hostels or apartments) and the costs of living –
such as transport – are reduced when tertiary provision is in the centre. Overseas migrants also often
come from higher density residential areas and will seek accommodation in centres.
Changing retail landscapes and consumer behaviour
“The traditional notion of the high street as the main shopping destination has long since eroded” with
out of town centres providing accessible leisure and shopping - parking ease and fees make centres
unfavourable destinations.”
Town Centres Futures 2020, Experian 2012
Our review of international and New Zealand research highlights a number of drivers of retail change
in city centres. These include urbanisation, demographic and lifestyle changes that are changing
consumer behaviour, and the increasing use of technology.
Urbanisation has seen cities grow and spread. Growing cities with larger populations can now support
a number of financial and retail centres. As a result, both retail and commercial business activity has
decentralised out of many city centres.
People are living longer and there are more two-parent working households. Busy families and friends
shop as a leisure activity, or turn to online shopping for value, range and convenience.
Out of centre retail centres offer convenience, accessibility, and choice (Property Economics, 2008).
Amenity at these out of town locations is improving, to cater for shopping as a leisure activity. Open air
shopping malls, with a range of food and beverage and entertainment options, and malls that include
luxury retail, are established international trends.
Smaller town centres offer convenience because they are located close to residents’ homes. Larger
out of town centres (such as Tauranga’s sub-regional centres) are destinations for shoppers from
much larger catchments.
These changes are accompanied by the rise of online shopping. Online shopping is growing in New
Zealand. Online spending grew 11% in the year to February 2018 and accounted for 10.9% of total
retail sales4 (BNZ, 2018). Beyond value, the ability to shop outside business hours and save time by
not visiting shops is important (NZ Retail, 2012).
Together, these trends mean that the role of retail in Tauranga city’s centre has changed. The
Marketview data shows that the centre represents around 10 percent of all retail expenditure in the city
4
BNZ: New Zealand Online Retail Sales, February 2018. Published March 2018
22
Commercial In Confidence– highlighting that it is an offering for the centre’s workers, students and visitors than for the broader
city and regional population.
Success is built on a broad agenda
The UN-Habitat identifies factors and indicators that constitute a “prosperous city”, namely
productivity, infrastructure, quality of life, equity and social inclusion, environmental sustainability, and
governance and legislation (UN-Habitat, 2015).
The Centre for Cities identifies factors that enable a city to succeed as: a positive business
environment: high levels of human capital; international, regional and sub-regional connections; quality
of life; and effective leadership (Centre for Cities, March 2011).
Others have focused on building understanding of what makes cities competitive through analysis of
city indices and benchmarking studies. The Business of Cities report (2013) reviewed 150 of these
indices to identify the practices and features of leading world cities. It identified cities that are
performing well on measures such as investment or international connectivity. The Benchmarking the
Future World of Cities report (2016) updated this analysis and identified the following as consistent
elements of city benchmarks: business activity and friendliness; knowledge and innovation; quality of
life; sustainability and smartness; culture and diversity; image, brand and destination; and
infrastructure & transport. The report identified that most city indices were not measuring important
elements of successful cities, namely governance, social cohesion, and the availability and quality of
housing.
In a similar vein, there is a growing base of research (see for example, Brookings Institution, 2017;
Centre for Local Economic Strategies, 2017) suggesting that vibrant and successful cities must
deliberately address social disparities and the extent to which the population of a city or region
participates in growth and prosperity. As such, the availability of talent and access to skills
development and employment opportunities (e.g., through the availability of education, housing and
transport) in a city are increasingly regarded as major drivers of performance. The Vital Signs 2018
report5 found that not all of the WBOP population was sharing in the benefits of current economic
growth, and that the growing population was having a significant impact on the cost of housing. The
top 3 issues identified by survey respondents6 were planning for the region’s growth, cost of living and
transportation/roading networks.
Finally, major advances in technology and the growth of the digital economy have led to interest in
how to develop ‘smart cities’, i.e., cities that improve their citizens’ quality of life through innovation,
creativity and the extensive use of technology. The European Smart Cities initiative assesses the
success of cities on six dimensions: smart economy, smart mobility, smart governance, smart living,
smart people and smart environment.
5
http://www.acornfoundation.org.nz/vital-signs.html, see also http://communityfoundations.ca/
6
n =1939 - Tauranga n=1047, WBOP n =892
23
Commercial In ConfidenceSuccess requires leadership and a shared vision
“By focusing too much on High Street shops and not enough on helping city centres to attract and
retain a wide range of jobs, policymakers are failing to help our cities adapt to a changing economy and
potentially damaging national economic growth. We have to stop just thinking about shops and start
thinking about how best to support different city centres as places to do business.”
Beyond the High Streets, Centre for Cities 2013.
Strong leadership and a shared vision is another characteristic commonly associated with cities with
vibrant centres. Leadership encompasses local government, business and community leadership.
Successful cities are characterised by partnerships between local stakeholders – private, public
(including education), and community. A shared vision of a centre’s purpose, and ensuring that policy
and planning frameworks – and the resources to deliver this – is an important condition for vibrant city
centres.
In Australia, Brisbane’s rapid growth, although based on its position in a resource-rich region, has
been supported by local and central government cooperation and leadership. Brisbane has deployed
specialist teams to attract business events, and mobilised private sector representatives as
ambassadors in identified markets. Importantly, it has provided the platform for subsequent private
and public sector investment. Cities expert Greg Clark believes that Brisbane stands out globally for
the way it has leveraged this investment. It has used it to deliver projects that have increased
liveability in the city, which has contributed to a rise in the overall quality of living (Business of Cities,
2013).
Civic leaders and councils have important responsibilities that can influence economic activity, based
on their leadership, partnerships, and place-making:
McKinsey has found that city leaders who make important strides in improving cities, do three
things well (McKinsey, 2013): achieve smart growth through securing the best growth
opportunities; do more with less; and win support for change. Creating an evidence base that
supports a shared understanding of these changes is an important first step to establishing
support for change.
The Portas review, that aimed to ‘breathe economic and community life’ into the British High
Street, recommended that civic leaders: run town centres like businesses; get the basics right to
allow businesses to flourish; level the playing field; define the roles and responsibilities of
landlords; and give communities a greater say (Portas, 2011).
Brookings suggest setting long term goals that go beyond traditional headline economic
indicators to achieve more robust measures of growth, productivity and inclusion whilst also
setting short-term metrics to monitor progress. These can reflect a more foundational
understanding of how to expand the economy. Examples are “percent of the population employed
in advance industries” (to gauge the economies movement up the value chain) and “percent of
jobs that are family sustaining” (to gauge whether workers are benefiting from growth). (Brookings
2017).
More broadly, a 2010 report for Local Government New Zealand identified six roles for local
government in supporting economic growth (LGNZ, 2010): leadership, spatial planning and
24
Commercial In ConfidenceYou can also read