CO2 EMISSIONS FROM CARS: the facts - A report by - Transport & Environment
←
→
Page content transcription
If your browser does not render page correctly, please read the page content below
CO2 EMISSIONS
  FROM CARS:
      the facts

         A report by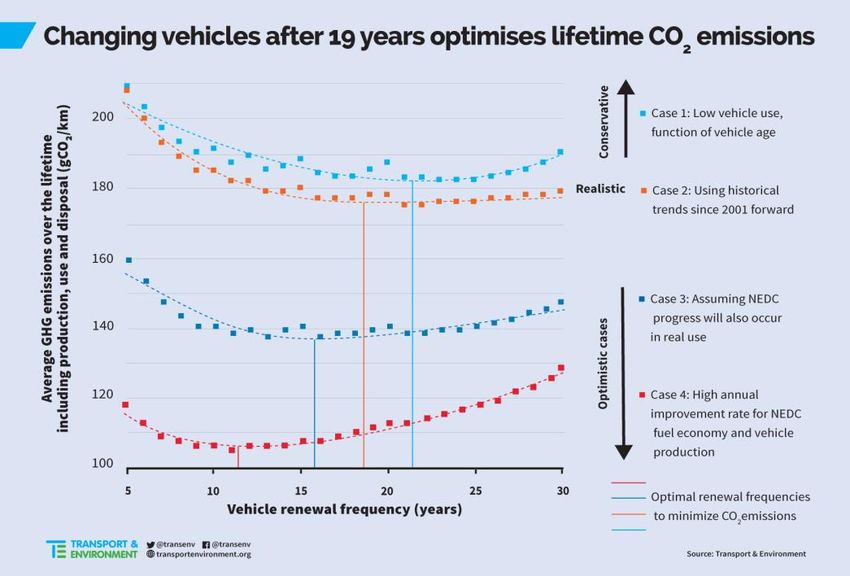
Transport & Environment
Published: April 2018
© 2018 European Federation for Transport and Environment AISBL

Editeur responsable: William Todts, Executive Director

Further information
Florent Grelier
Clean Vehicles Engineer
Transport & Environment

florent.grelier@transportenvironment.org
Office: +32 2 851 02 14
Mobile: +32 488 92 84 11

Square de Meeûs, 18 – 2nd floor | B-1050 | Brussels | Belgium
www.transportenvironment.org | @transenv | fb: Transport & Environment

Acknowledgements
Transport & Environment (T&E) acknowledges the work of François Cuenot in providing the data and the
analysis regarding the life cycle analysis of fleet renewals in section 5.4 of this report. The other parts of this
report are the result of an in-house analysis done by T&E, with collective effort from the staff, including:
Greg Archer, Thomas Earl, Eoin Bannon, Julia Poliscanova, Nico Muzi and Sofia Alexandridou.
Executive summary
      1.    Transport is Europe’s biggest source of CO2, responsible for the emission of over a quarter of
            all greenhouse gases. Transport emissions have increased by a quarter since 1990 and are
            continuing to rise with 2017 oil consumption in the EU increasing at its fastest pace since
            2001.1 Unless transport emissions are brought under control national 2030 climate goals will
            be missed. To meet the 2050 Paris climate commitments cars and vans must be entirely
            decarbonised. This requires ending sales of cars with an internal combustion engine by 2035.
            Such a transformation requires wholesale changes, not only to vehicles but also how they are
            owned, taxed and driven.

      2.    To date measures to tackle emissions from cars and vans have largely been a failure. If the
            lifecycle emissions of biofuels were properly accounted for (instead of being considered fully
            renewable), greenhouse gas emissions from cars and vans would be on average 10% higher
            than official statistics. New car CO2 regulations have delivered only about a 10% reduction in
            on-road emissions in the 20 years since the first Voluntary Agreement was established in
            1998; and there has been effectively no improvement in the last five years. In spite of this, all
            carmakers achieved their 2015 new car CO2 targets and most are on track to achieve 2020/1
            goals. This has been achieved in very large part by exploiting the flexibilities in the testing
            procedure which has meant the gap between test results and real-world performance has
            grown from 9% to 42%, equivalent to 31gCO2/km of fake savings.

      3.    Despite test cheating, about half of carmakers still need to accelerate the progress made to
            date in order to achieve their 2021 target – and the acceleration is needed because of their
            decision to not deploy sufficient fuel efficiency technologies on vehicles. Recent figures
            suggest that the fleet average CO2 emissions from new cars is set to rise when the European
                                                            With using flexibilities
                                                                                                     Environment
                             Without using
                               flexibilities    Minimum level Moderate level Maximum level
                                                                                               Agency      shortly
              Volvo                2017              2017            2017            2017
                                                                                               publishes  its  data
           Mitsubishi              2018              2018            2017            2017      for 2017. There  are
         Toyota-Lexus              2019              2018            2017            2017      several     factors
             Daimler               2020              2019            2019            2017      contributing       to
      Jaguar-Land Rover*           2020              2019            2019            2018      the rise but steep
            Peugeot                2020              2019            2018            2017      increases in the
           Citroën-DS              2020              2019            2018            2017      size and weight of
         Nissan-Infiniti           2020              2019            2018            2017      cars is a leading
         Renault Group             2021              2020            2019            2017      reason. SUV sales
       Volkswagen Group            2022              2021            2020            2018      have      rocketed
          BMW Group                2023              2022            2021            2018      from 4% in 2001 to
               Ford                2023              2022            2021            2018      26% in 2016, and
             Suzuki*               2025              2024            2022            2020      the average SUV
             Mazda*                2026              2024            2023            2021
                                                                                               has emissions of
         Opel-Vauxhall             2027              2026            2024            2021
                                                                                                     132gCO2/km
               Kia                 2028              2026            2025            2022
            Subaru*                2028              2026            2025            2022
                                                                                               compared           to
             Honda                 2029              2028            2026            2023      118gCO  2/km   for  a
          Fiat-Chrysler            2030              2028            2026            2022      medium segment
            Hyundai                2033              2030            2028            2024      car. The increase
                          *Manufacturers with a niche derogation target                        in the average
       Note: Minimum level = 3.5g/km - Moderate level = 7g/km - Maximum level = 14.5g/km       weight of new cars
      Dates before 2020 are illustrative - super-credits cannot be earned and used before 2020 by 124kg from

1
    International Energy Agency (IEA), Global Energy and CO2 status report 2017, March 2018

                                                                             a report by                               2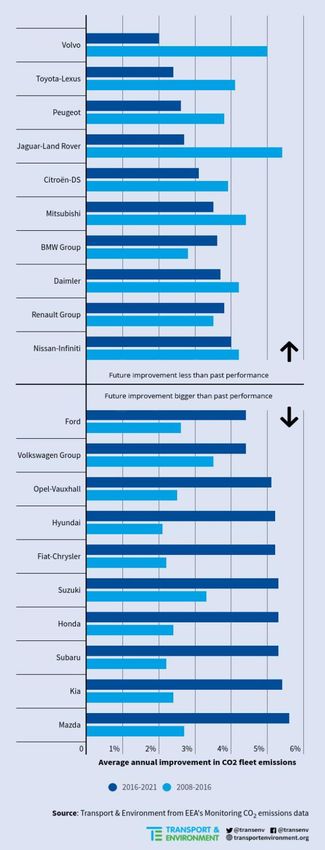
2000 to 2016 has helped to bring about a rise in average emissions of around 10g/km. The
power of new cars has also increased sharply by 28%, increasing fuel consumption and
emissions. Such changes in the cars being sold have helped improve industry profitability but
should have necessitated carmakers shifting – at the same time – to much more efficient
technologies such as hybrids. Most have declined to do so.
4. Dieselisation, the carmakers’ principal strategy to reduce CO2 emissions, has resulted in the
share of diesel cars growing from 36% in 2001 to a peak of 55% in 2011. Following the
Dieselgate scandal, sales have slumped and the EU market share is expected to slip to around
45% in 2017, and is continuing to fall. The decline in diesel sales makes a small impact in CO2
emissions, although the effect is more than compensated for by the rise in alternative fuelled
vehicles with much lower carbon intensity. On a life-cycle basis, diesel cars are higher
emitting than equivalent gasoline cars. This is because diesels have higher embedded
emissions, diesels use high-carbon biodiesel, refining the diesel fuel requires more energy
and diesels are driven a little more as fuel is cheaper. Electric cars are significantly lower
carbon throughout the EU, even taking into account the higher emissions in manufacturing
and the emissions from electricity generation.
5. A raft of model upgrades from 2019, as well as the use of flexibilities in the current car CO2
flexibilities (super-credits, eco-innovations and pooling), will enable almost all carmakers to
achieve their 2021 goals, despite claims to the contrary. However, as a result of the limited
deployment of fuel efficient technologies on engined cars, many carmakers will need to
increase sales of sub-50g CO2/km vehicles (battery electric and plug-in hybrid vehicles) in
order to achieve their targets. This is likely to increase the share of sales of new electric and
plug-in hybrid vehicles in Europe significantly by 2021 to 5-7%. Just three carmaker groups –
Fiat-Chrysler, Honda and Hyundai-Kia – are at significant risk of incurring fines annually from
2020.
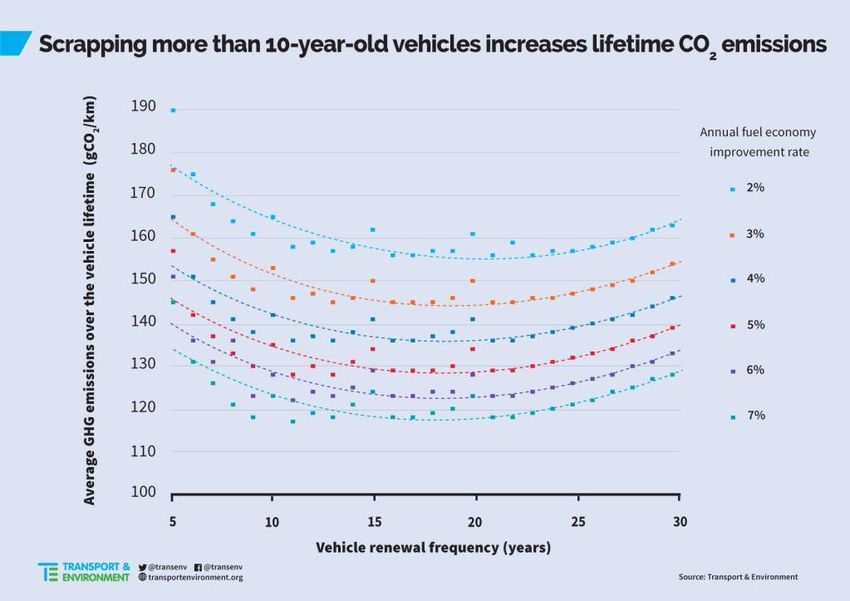
6. Another common misunderstanding is that a fast fleet turnover is essential to lower CO 2
emissions. There is a trade-off between measures to improve the efficiency of new cars and
keeping cars cheap to encourage their early replacement. However, on a lifecycle basis, rapid
fleet renewal actually increases emissions due to the additional releases during manufacture
and recycling/disposal. A vehicle lifetime of 15-20 years is optimal to minimise lifecycle
emissions – the typical lifetime of cars today. Lifetimes shorter than 15 years are only lower
carbon if there is a very rapid improvement in in-use emissions.
7. There are three underlying reasons for the failure to tackle car and van CO2 emissions:
a. Governments are, almost universally, unwilling to constrain demand for mobility and, in
particular, car use and ownership.
b. The car industry circumvents emissions regulations by all possible means – and has
successfully done so for decades. Despite the Dieselgate scandal and the exposure of CO2
testing manipulation, new evidence is emerging of ways to manipulate the results of the new
Worldwide harmonised Light vehicles Test Procedure (WLTP) Emerging evidence suggest
carmakers are inflating WLTP values whilst keeping New European Driving Cycle (NEDC)
values low. This would help them maximise test flexibilities for the NEDC-based 2021 CO2
target whilst simultaneously inflating the WLTP 2021 starting point for the 2025 and 2030
regulation. In addition, the industry consistently fits technology to cars that will deflate
emissions far more in the lab than on the road, such as short range plug-in hybrids, stop-start
and cylinder deactivation.
a report by 3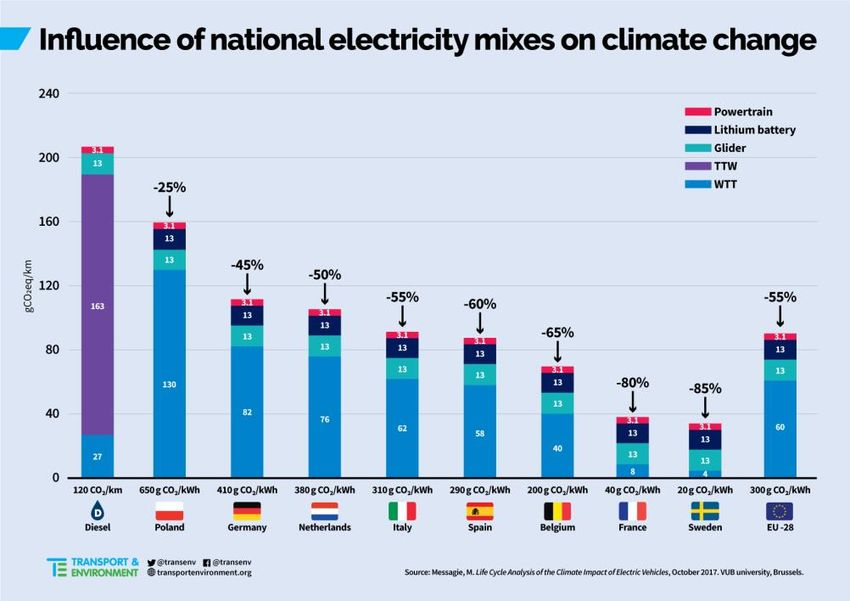
c.   The unhealthy political influence the industry exerts over some member states with
     important car industries (Germany, Italy, Spain, Slovakia, Hungary and Romania) and also,
     on occasion, the European Commission, leads to regulations that are not fit for purpose, such
     as the new car CO2 regulation for post-2020.

8.   There are no silver bullets, but past policy failures can be reversed to not only slash emissions
     but also create jobs, improve energy security and reduce the costs of mobility.

9.   The first key development must be to accelerate the shift to electro-mobility. To meet the
     goals of the Paris agreement, transport emissions must be reduced by more than 90% by
     2050. Such a radical change cannot be achieved through incremental improvements to
     existing vehicles, a shift to fossil gas or through advanced biofuels and synthetic fuels that
     cannot be produced in the volumes needed to power all mobility. To claim so is a
     smokescreen designed to perpetuate engined cars. Future cars will be electric, chargeable in
     minutes with ranges of 500km and powered from smart renewable grids. At present the car
     industry is failing to provide adequate choice, constraining supply, not actively marketing or
     incentivising showrooms to sell electric cars – therefore regulation is essential to kick start
     the market.

10. The second key policy required is an ambitious new car CO2 target for 2025. The weak
    Commission proposal, following successful industry lobbying, failed in three key respects:

11. The 30% reduction from 2021 to 2030 is far below the 60% trajectory needed to achieve the
    Paris goals. A 20% target for 2025 is needed, along with a target of 0gCO2/km for 2035. A target
    between 50 and 60% should be finally agreed in a 2022 review.

12. The regulation fails to require the supply of zero emission vehicles – instead this has only
    incentivised the weakening of an already insufficient target. The solution is a target of 20%
    zero emission vehicles (ZEVs) by 2025, which would reward carmakers surpassing this
    benchmark and penalising those failing to meet the goal by requiring a bigger reduction in
    overall CO2.

13. There is no mechanism to ensure emissions reductions are delivered on the road – not just in
    the laboratory. This can be fixed through defining the gap between test and real-world
    performance in 2021 using real world data obtained from a fuel economy meter, or a real
    world test. This gap should then be fixed and not allowed to grow.

14. The third key area of policy development is road pricing and the reform of vehicle taxation. If
    adopted, the recently proposed Eurovignette Directive would help to drive the uptake of
    cleaner vehicles and promote more efficient transport behaviour (e.g. carpooling, modal
    shift, etc.).

15. Member states could also help shift the market in favour of lower carbon vehicles and
    discourage unnecessary car ownership and use through taxation policies which have been
    very effective in some countries, such as the Netherlands, but are being largely under-
    utilised. Company car tax schemes also need urgent reform in order to discourage car
    ownership.

16. Sharing of vehicles, coupled with congestion charging, road pricing, parking constraints and
    reducing road space for private vehicles represents a huge opportunity to tackle urban
    congestion and pollution, as illustrated by recent modelling from the International Transport
    Forum (ITF) which suggests that more than 90% of cars could be removed from the road in
    Lisbon and Helsinki through ride sharing.

                                                              a report by                                4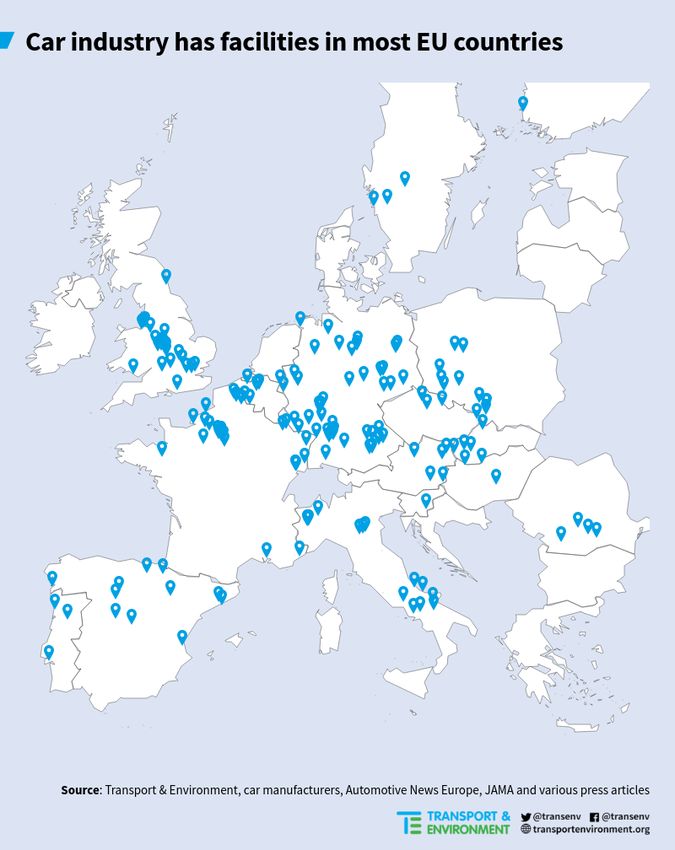
17. Preventing dangerous climate change cannot be achieved only through incremental change
    – in less than 20 years from now, Europe needs to have sold its last new car with an engine.
    The last two decades have ineffectively focused on encouraging efficiency improvements
    which have utterly failed to keep pace with the growth in motorisation. There are no silver
    bullets, but to tackle CO2 emissions, low and zero carbon vehicle technology must be
    integrated with initiatives to connect and share vehicles in order to improve the efficiency of
    the road network. Pricing roads must be combined with better public transport and
    infrastructure for walking and cycling. We need every tool to tackle CO2 emissions from cars
    and vans, and we must now prioritise the transformative changes which can deliver the
    requisite huge cuts in emissions.

                                                            a report by                               5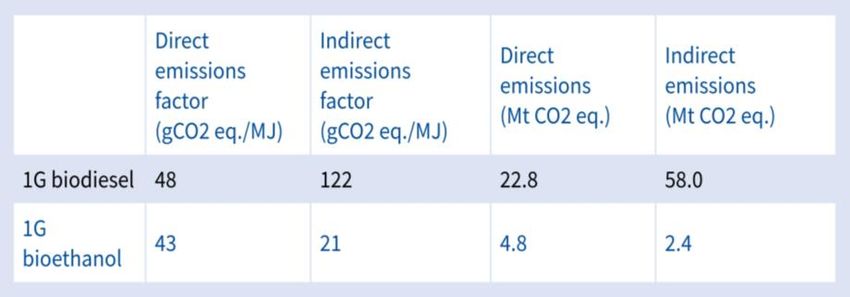
Contents
1.   Introduction                                                                                 8

2.   CO2 emissions from vehicles                                                              11
2.1. Transport emissions in the EU                                                            11
2.2. The role of biofuels                                                                     13
2.3. Comparison of European countries                                                         14
2.4. Transport forecasts and modelling the associated emissions                               16

3.   Progress towards 2020/1 car CO2 targets                                                  18
3.1. Progress in the laboratory                                                               18
3.2. Progress on the road                                                                     19
3.3. WLTP test is an improvement but not a panacea                                            20
3.4. Progress towards 2020/1 targets                                                          21
3.4.1.    Flexibilities in the regulation                                                     22
3.4.2.    Projections of compliance with the 2020/1 targets                                   23
3.4.3.    Potential fines                                                                     25
3.4.4.    Compliance in 2020                                                                  26
3.4.5.    Can carmakers earn sufficient flexibilities to avoid fines?                         27
3.5.     Assessing uncertainty                                                                28

4.   Bigger, heavier and higher performance – the trends offsetting efficiency improvements   31
4.1. Bigger and heavier                                                                       31
4.2. Increased power – increased profits – increased emissions                                33
4.3. Bigger fleets means more congestion and bigger risks for vulnerable road users           34

5.   The effects of dieselisation and fleet renewal rates                                     36
5.1. Impact of the diesel decline                                                             36
5.2. National and company diesel share                                                        37
5.3. Lifecycle diesel emissions                                                               38
5.4. Why selling more cars is not the way to lower CO2 emissions                              38

6.   Why are we failing to tackle car CO2 emissions?                                          42
6.1. The uncontrolled demand for mobility and car ownership                                   42
6.2. Cheating and manipulating test results                                                   42
6.3. Political influence in member states and the European Commission                         44

7.   Conclusions and policy recommendations                                                   47

                                                                   a report by                6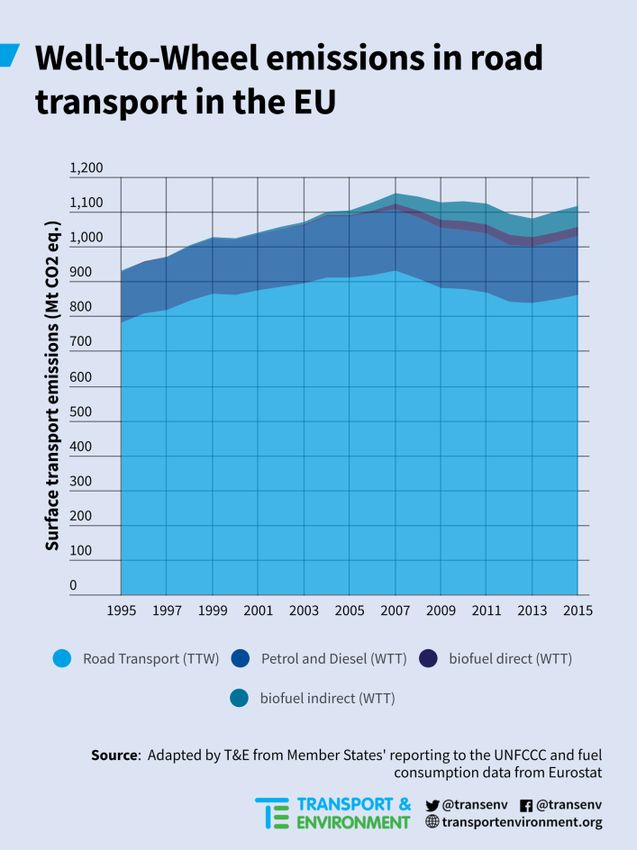
7.1. Electrification of transport                                     47
7.2. Ambitious new car CO2 targets                                    48
7.2.1.    CO2 targets post-2020                                       48
7.2.2.    Driving supply of zero emission solutions                   49
7.2.3.    Delivering emissions reductions on the road                 49
7.3.     Road pricing and reform of vehicle taxation                  51
7.4. Final thoughts                                                   52

                                                        a report by   7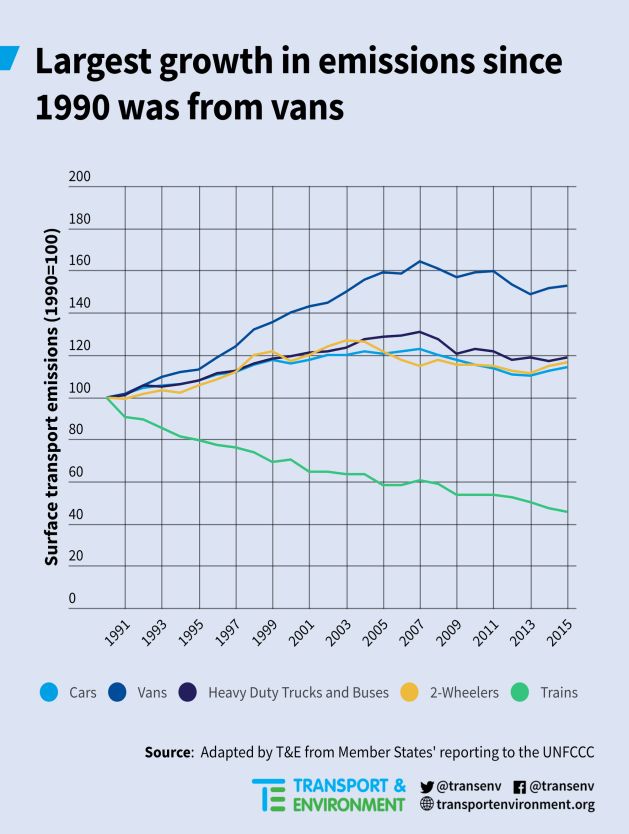
1. Introduction
Transport is Europe’s biggest source of carbon emissions, contributing 27% to the EU’s total CO2 emissions,
with cars and vans representing more than two thirds of these, according to the European Environment
Agency (EEA).2 Transport is the only sector in which emissions have grown since 1990,3 contributing to the
increase in the EU’s overall emissions in 2015.4 Transport related emissions further increased in 2016 and in
2017 EU oil consumption – a good proxy for transport CO2 – increased at its fastest pace since 2001.5

    Figure 1 – EU greenhouse gas (GHG) emissions per sector in     Figure 2 – Indexed evolutions of EU GHG emissions per
                              2016                               sector compared with the 95% reduction target trajectory

If we are to achieve the Paris climate goals, it is likely that transport emissions must be reduced by 94%
from 2005 levels,6 much more than the 60% suggested by the European Commission in its outdated and
discredited 2011 Transport White Paper.7 Given the challenges of fully decarbonising aviation and shipping
by 2050, light duty vehicles, i.e. cars and vans, will need to be entirely decarbonised by 2050. Such a
reduction cannot be achieved through incremental improvements to existing vehicles. There is a limit to
the efficiency improvements possible with internal combustion engines and low carbon drop-in
replacement fuels for oil (either advanced biofuels or synthetic fuels) cannot, realistically, be produced in
the volumes needed to power all mobility.8,9 Instead, a transformation is needed in the way that personal
mobility is delivered, including a shift to electro-mobility.

2
  European Environment Agency (EEA), EEA greenhouse gas – data viewer, 06/06/2017
3
  EEA, EU greenhouse gas emissions at lowest level since 1990, 06/12/2016
4
  EEA, EU greenhouse gas emissions from transport increase for the second year in a row, 01/06/2017
5
  IEA, Global Energy and CO2 status report 2017, Oil section, March 2018
6
  Transport & Environment (T&E), Europe needs to slash its transport emissions by 94% by 2050 - Effort Sharing Regulation,
21/12/2016
7
  European Commission, DG MOVE, White paper, Roadmap to a single European transport area, 2011
8
  T&E, A target for advanced biofuels, 06/06/2017
9
  T&E, The role of electrofuel technologies in Europe's low-carbon transport future, 21/11/2017

                                                                         a report by                                  8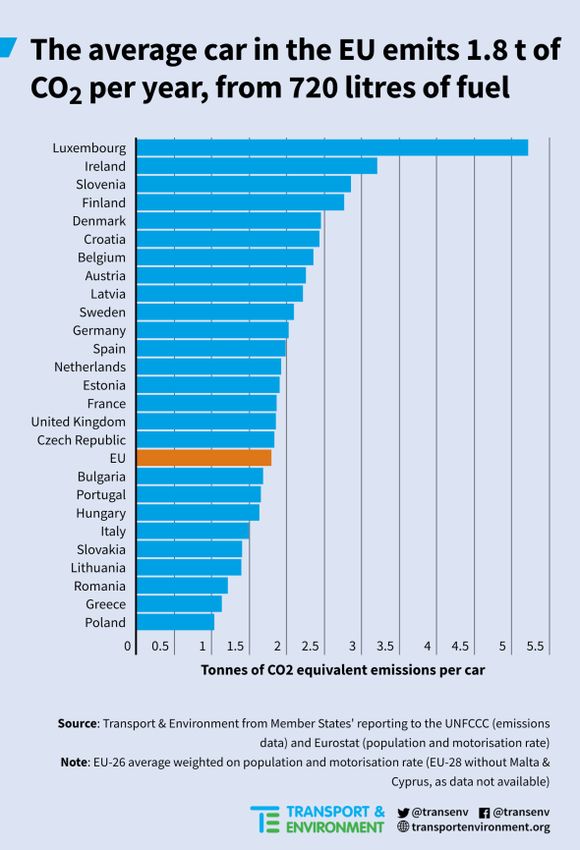
Figure 3 – T&E’s vision of future personal mobility in 2040

This report examines the progress Europe is making towards decarbonising personality mobility –
particularly cars. It presents indicators from a wide range of sources which show that progress has stalled
and many of the underlying trends are contrary to what is needed.

Chapter 2 presents the historical trends in CO2 emissions from vehicles (cars, vans and trucks). The chapter
investigates the biggest users of road fuel in Europe, and analyses biofuel consumption on a well-to-wheel
basis. Finally, a critique of projections derived from the European Commission’s regulatory baseline is
undertaken, with discussion of the implications for the level of policy ambition.

Chapter 3 presents the most recent figures on new car CO2 regulation and examines the progress towards
the 2020/1 targets. The chapter specifically looks at the extent to which carmakers will need to make use of
flexibilities in the regulation in order to meet the 2020/1 targets and the level of fines which companies are
likely to face. It contrasts emission reductions measured in distorted laboratory tests with those measured
in the real-world, drawing parallels with the Dieselgate scandal.

Chapter 4 explores the underlying reasons for the lack of improvement in new cars CO2 emissions –
specifically how the drive to increase profits has driven the industry to produce bigger, heavier and ever
more powerful vehicles along with a reluctance to provide or market either zero or ultra-low emission
vehicles.

Chapter 5 considers if a faster fleet renewal offers genuine CO2 benefits and how the impact of declining
diesel sales is being offset by a greater share of alternative fuelled, including electric, vehicles. It also
presents a lifecycle analysis of the effect of more diesel.

                                                                     a report by                          9
Chapter 6 reviews why we are failing to tackle the CO2 emissions from cars and vans, and Chapter 7
presents conclusions and policy recommendations.
Twenty years ago (1998) the car industry agreed a voluntary commitment to reduce new car emissions
by 25% by 2008.10 Then, CO2 emissions on the road from new cars were around 203g/km. 11 Today, they
are still around 170g/km and unlikely to reach 140g/km until after 2020.
ON THE ROAD , THE CAR INDUSTRY HAS REDUCED EMISSIONS BY JUST 1% PER ANNUM – 17% IN 20 YEARS – A DISMAL
PERFORMANCE !
With increasing rates of motorisation, especially in central and eastern Europe, GHG emissions from cars
remain out of control.
Since the Dieselgate scandal broke in September 2015, the automotive industry has been under increased
media and regulatory scrutiny for its contribution to the urban air pollution crisis in our cities. From the
initial focus on the defeat devices fitted to Volkswagen vehicles sold in the US, the scandal spread globally
to almost every company, and every market, selling diesel cars. In response, the EU has strengthened
regulations, including introducing a new real-world emissions test – a strengthened system for approving
cars. For two years the focus has understandably been on how to tackle the noxious emissions from
exhausts. The imminent CO2 regulatory target of a fleet average of 95g/km for 2020/1 now looms on the
horizon together with potentially crippling fines for companies that chose not to ensure they met the goals.
Together with the European Commission proposal for 2025 and 2030 standards, there is a renewed focus
and debate on CO2 emissions from cars that this timely report responds to.
10
From 1995 levels – Official Journal of the European Union, Regulation n°443/2009
11
Based upon NEDC emissions of 186g/km in 1996 and a 9% gap between test and real-world emissions using ICCT data.
a report by 102. CO2 emissions from vehicles
This chapter analyses historical emission trends from road transport in the EU with a particular focus on
cars and vans. It shows emissions are rising again as demand for mobility outstrips the minimal
improvement in efficiency. The chapter also analyses the impact of biofuel consumption and shows that
biofuel policies have not led to a decrease in emissions on a well-to-wheel basis. Finally, a critique of
projections of transport emissions is undertaken, and the implications of these projections for policy
discussed.
2.1. Transport emissions in the EU
TRANSPORT IS THE BIGGEST CONTRIBUTOR TO EU GHG EMISSIONS , GENERATING 27% OF EMISSIONS . CARS AND
VANS CONTRIBUTE AROUND HALF OF THESE.
The latest data from the EEA12 shows that in 2016 transport sector GHG emissions (including international
maritime and aviation emissions, ‘bunkers’) in the EU was 1,205Mt CO2 equivalent – the largest sector at
27% of total EU emissions, as shown by Figure 1 in the introduction. Passenger cars alone account for 41%
of these transport emissions, or 11% of the total (including bunkers). Transport is currently highly
dependent on oil, of which 93% is imported, with Russia the main source.13 GHG emissions are produced by
the combustion of these fossil derived, petroleum-based products, which include petrol, diesel fuel,
kerosene and fuel oils. Of the total final consumption of petroleum products in the EU, the transport sector
consumed 66%, or 345Mtoe.14 Demand for oil is continuing to increase – the most recent IEA figures show
OECD Europe’s oil demand increased by 2% in 2017,15 and it is anticipated to rise by a further 1% in 2018,
with transport the dominant cause.
Surface transport emissions in the EU have risen by 18% since 1990, as shown by the indexed emissions in
Figure 5. Despite a downward trend from the peak emissions of 938.4Mt in 2007, as shown in Figure 2,
emissions from 2013 have been on the rise. The latest emissions data for 2016 released by the EEA point to
a continuation of this trend.16
For cars, the growth in emissions can be attributable to a growth in passenger activity, measured in
passenger kilometres. In contrast, trains have reduced their emissions by more than 50% despite seeing an
increase of 6% in passenger kilometres. Vans have seen the largest growth in emissions, with an increase of
more than 45% since 1990. Vans tend to be under-regulated compared to trucks,17 and this has led to vans
increasingly replacing small trucks. 18 , 19 Vans have also had favourable tax reductions compared to
passenger cars.
SINCE 1990 EMISSIONS FROM CARS AND VANS HAVE RISEN . AFTER A DIP DURING THE ECONOMIC CRISIS THEY ARE
RISING AGAIN AND ARE PROJECTED TO RISE INTO 2018.
12
EEA, Approximated EU greenhouse gas inventory 2016, 07/11/2017
13
T&E, Europe increasingly dependent on risky oil imports, 11/07/2016
14
Eurostat, Sankey diagram dataset - annual data, Latest update: February 2018 – Note: Compares net imports and production,
Mtoe means million tons of oil equivalent.
15
IEA, Global Energy and CO2 status report 2017, CO2 emissions section, March 2018
16
EEA, Approximated EU greenhouse gas inventory 2016, 07/11/2017
17
T&E, CO2 emissions from vans: time to put them back on track, 15/02/2018
18
Kraftfahrt-Bundesarnt (KBA), Statistik, Neuzulassungen von Lkw in den Jahren 2007 bis 2016 nach zulässiger Gesamtmasse
19
Shell Deutschland, Shell Lkw-Studie, Fakten, Trends und Perspektiven im Straßengüterverkehr bis 2030, 04/2010
a report by 11Figure 4 – Evolution of transport emissions by mode Figure 5 – Indexed growth of road transport modes
Figure 6 shows the share of N1 van sales by class,
where class I are vans less than 1305kg, class II are
those between 1305kg and 1760kg, and class III
heavier than 1760kg. Further analysis of these data
shows that vans with a technical permissible
maximum laden mass (TPMLM) over 3.4t account
for 22.3% of sales. While empty mass has largely
remained constant over the five years where data
is available, the sales weighted average TPMLM has
increased by 50kg. Increasing sales and increasing
TPMLM help to explain increasing van emissions.
VAN EMISSIONS ARE OUT OF CONTROL , HAVING RISEN
NEARLY 50% SINCE 1990.
Figure 6 – Sales distribution of N1 vans per class
a report by 122.2. The role of biofuels
Biofuels were once touted as the green solution to decarbonising fuel. The idea was that the CO 2 emitted
from combusting the fuel had been absorbed by growing the crop, closing the carbon cycle. There are
obvious shortcomings to this assumption: crop based biofuels generate agriculture emissions (from
fertiliser use, nitrification and denitrification of soils, harvesting, etc.); energy crops take up fertile land
which could have otherwise been used to produced food – therefore demand for fertile land increases, often
resulting in deforestation and the drainage of peat lands (both of which release large stores of soil carbon);
there are emissions associated with the refining and transport of the feedstocks and final fuels, and; it relies
on the assumption that same energy crops will be grown again the following year.
Burning biofuels is zero-counted when member states calculate their GHG inventories under the United
Nations Framework Convention on Climate Change (UNFCCC) framework. In this section, we consider the
GHG implications under two scenarios, one where the direct emissions associated with the upstream
farming, processing and distribution of the fuel is considered, and a second scenario where direct and
indirect land-use change is accounted for.
In 2015, biofuel consumption was 14Mtoe, of which 11.3Mtoe (81%) was biodiesel, whereas fossil fuel
consumption was 277.7Mtoe in road transport. Therefore, 4.8% of energy consumed in road transport was
from biofuels. A previous T&E analysis, based on the Globiom and Mirage studies, found the EU averages
for direct and indirect emissions of biofuels.20 Combined with the total consumption of biofuels, Table 1
below shows the emissions factors and resulting emissions from the use of biofuels.
Considering only the direct
emissions attributed to fuel
production, the CO2 emissions
from transport would have been
27.6Mt CO2 equivalent more,
representing an increase of
3.2%. Taking account of CO2
emitted from direct and indirect
land use change, the CO2
Table 1 – Direct and indirect emissions factors and emissions of biofuels in the EU
amounts would be higher by
88Mt CO2 equivalent, or an
increase of 10.2% than the
levels reported in the national inventories.
IF THE FULL EFFECTS OF GROWING AND PRODUCING BIOFUELS FOR ROAD TRANSPORT ARE TAKEN INTO ACCOUNT ,
EMISSIONS WOULD BE 10% HIGHER STILL .
Figure 8 shows that if the real GHG emissions of biofuels are taken into account, current emissions are close
to the 2007 peak. In this figure, road transport emissions are grouped together and represent the emissions
resulting only from combusting the fuel in the engine (i.e. the tank to wheel, or TTW, emissions) – these are
the road transport emissions shown in Figure 5. Then above are the emissions attributed to the production
and refining of these fuels (i.e. the well-to-tank, or WTT, emissions). Finally, the indirect and direct WTT
emissions from biofuels are added again. The uptake of biofuels began to increase from very low mixes of
less than 1% v/v% at the turn of the century.
20
T&E, Biodiesel increasing EU transport emissions by 4% instead of cutting CO2, 04/05/2016
a report by 13Figure 7 – Biodiesel and bioethanol mix per country Figure 8 – Well-to-wheel emissions in road transport
in the EU
The consumption of biofuel is not uniformly spread across the EU. Figure 7 shows that the consumption
weighted average of biofuel consumption, by volume, is about 5%. The countries are ordered in terms of
total consumption of biofuel. Sweden and Finland have the block’s largest share of biofuel, as a result of
strong policy regimes to increase the uptake of biofuel, and larger than average inputs and biomass
availability from the large and established domestic forestry industries in those countries.
2.3. Comparison of European countries
Emissions from cars are proportional to the wealth of the country. Figure 9 plots emissions per capita from
road transport compared to GDP per capita for countries in the EU-26 (excluding Cyprus and Malta). The
trend is clear: CO2 emissions per capita are correlated with the GDP per capita of the country. It can also be
seen that car emissions per capita are typically below 1 MtCO2eq for the Central and Eastern Europe
countries (Estonia, Latvia, Lithuania, Czech Republic, Slovakia, Poland, Hungary, Slovenia, Romania and
Bulgaria) and 1-2 Mt for the wealthier nations, although there are wide variations.
Luxembourg is the outlier in terms of both emissions and wealth at 4MtCO2eq per capita. This is likely the
result of the leakage of the allocation of emissions from trucks from fuel sales (as Luxembourg encourages
fuel tourism through its very low fuel taxes); some fuel tourism from border towns from passenger cars; the
highest motorisation rates in the EU, and; because the Luxembourgish buy heavier vehicles than the EU
average.
a report by 14T&E’s diesel report21 highlights that emissions per
vehicle increase in line with a vehicle’s mass, and
in chapter 3 we also see that wealthier citizens
tend to buy heavier, more powerful, more fuel
guzzling vehicles than their less wealthy
counterparts. These factors translate into a larger
CO2 footprint.
Finally, Figure 10 shows each country listed with
their average emissions per vehicle, and again
showing Luxembourg to be an outlier. It has
emissions five times those of the country with the
lowest emissions per vehicle: Poland.
Looking at the geographical spread paints the
picture of a two-speed Europe: the eastern and
Mediterranean member states tend to emit less
per vehicle compared to the northern and central
Europeans. Interestingly, this does not necessarily
correspond with motorisation rates (Figure 11),
where countries such as Italy and Poland have
high motorisation rates but low emissions per
Figure 9 – EU member state wealth per capita and emissions vehicle, and Denmark and Ireland have
from cars
Figure 11 – Motorisation rates in EU countries in 2015 in
cars/capita
Figure 10 – Average annual emissions from cars in
2015
21
T&E, Diesel: the true (dirty) story, 18/09/2017
a report by 15comparatively low motorisation rates but high emissions per vehicle.
2.4. Transport forecasts and modelling the associated emissions
The data presented in the previous section is based upon official statistics but T&E has also developed tools
to model future EU transport emissions for a range of policy scenarios. The T&E model is called the
European transportation roadmap model (EUTRM), and is based on ICCT’s global transportation roadmap
model (GTRM). It models GHG emissions from the year 2000 to 2050 and makes use of the most recent
available European-specific data (such as member state electricity grid mix and transfers of second hand
vehicles). Transport and freight demand are based on purchasing power parity (PPP) adjusted GDP, which
is determined by historical and projected GDP, population and fuel price for each country. These inputs are
identical to those used by the European Commission’s model PRIMES-TREMOVE that produces the results
for the Reference Scenarios. As a result, the projected transport demand from the EUTRM closely matches
that of the European Commission.
Figure 12 – EUTRM and European Commission baseline scenario outputs
T&E has modelled the impact of future emissions from cars and vans in the absence of policy beyond the
current 2020/1 CO2 standards for cars and vans. In the absence of further policy there is no incentive or
obligation for OEMs to invest money to develop more efficient vehicles. T&E has found that the EUTRM
baseline assumptions and those of the Commission presented in the Impact Assessment for the post 2020
car and van CO2 emissions widely deviate, as shown in Figure 12 above. The left figure shows EU transport
emissions (without maritime). The EUTRM shows an increase in emissions (which matches the observed
trends from 2013 onwards above), despite the 2020/1 car and van CO2 standards, which take the lion’s share
of these emissions. Analysis of the Reference Scenario reveals that the Commission’s modelling assumes
that cars continue to improve in efficiency beyond 2021 and likewise for heavy duty trucks despite a lack of
policy drivers. Similarly, there is a large ingress of hybrid vehicles. The effect of this can be seen in the car
fleet efficiency, which by 2050 differs by around 40%. The apparently spontaneous uptake of cleaner
vehicles such as BEVs without a policy (such as a ZEV mandate) runs counter to the market reality – where
a report by 16there has been slow and, over the last five years, no progress – and leads to the erroneous conclusion that
future emissions are much lower. Therefore, there is no need to improve the efficiency of the new vehicle
fleet very significantly to help achieve 2030 climate goals. This flawed analysis underpins the Commission
proposal for new car CO2 standards.
a report by 173. Progress towards 2020/1 car CO2 targets
Chapter 2 examined real-world CO2 emissions for vehicles derived from inventories based upon fuel sales.
Fuel use is currently the best way to estimate emissions, although proposals for mandatory fuel economy
meters will, in the future, make it possible to monitor emissions and potentially regulate new car emissions
based upon individual fuel use in new, recently sold vehicles.
CO2 regulations for new cars and vans are based upon a test cycle, until recently the NEDC test. For some
new cars, this test has now been replaced by a better version, WLTP, although this is still conducted in a
laboratory and under-estimates the real world emissions by about 20%.22 For the purpose of this chapter,
new car emissions based upon the NEDC test are used – although it is highly unrepresentative of real-world
emissions that are typically 42% higher on average.
3.1. Progress in the laboratory
Since 2000, the EEA has
collated data regarding the
official CO2 performance of
new cars sold in the EU
using the NEDC test
procedure. Figure 13 shows
the most recent data
drawing from the EEA that
records significant
progress regarding the
reduction of the average
CO2 emissions of brand
new cars in the laboratory
by 31%, from
172.2gCO2/km in 2000 to
118.1gCO2/km in 2016.23
Following the adoption of
the Kyoto Protocol in 1997,
the EU was minded to
Figure 13 – Evolution of the CO2 emissions of new cars sold in the EU from 2000 to 2016 adopt regulations on new
car CO2 emissions but
instead was persuaded by the car industry to accept a voluntary commitment to reduce CO 2 emissions for
new cars to 140g/km in 2008.24 However, the failure to make acceptable progress resulted in the European
Commission eventually making a regulatory proposal that came into force in 2009, 25 with first an
intermediate target of 130g/km in 2015 and later a final target of 95g/km for 2020. The target was
subsequently relaxed to 95% of vehicles needing to comply in 2020 and 100% of sales by 2021. From 2000
to 2008, CO2 emissions dropped by 11%, with a marginal acceleration between 2008 and 2016 by which time
emissions were 23% lower.
22
The ICCT and Element Energy, Quantifying the impact of real-world driving on total CO2 emissions from UK cars and vans, for the
UK Committee on Climate Change, September 2015
23
EEA, Monitoring CO2 emissions from new passenger cars and vans in 2016, Report n°19/2017, 18/01/2018
24
Per Kågeson, Reducing CO2 emissions from new cars, January 2005
25
Official Journal of the European Union, Regulation n°443/2009
a report by 18HISTORY SHOWS ONLY REGULATION ENSURES THAT THE CAR INDUSTRY ACTS TO IMPROVE THE EFFICIENCY OF NEW
CARS .
3.2. Progress on the road
In its series of Mind the Gap reports,26 T&E has shown that the gap between official test results and real-
world performance of new cars’ CO2 emissions has grown alarmingly. The average gap has jumped from 8%
in 2001 to 28% in 2012 and 42% in 2016, as seen in Figure 14. The widening gap is not the result of cars being
driven in a significantly different way from the past, as motorists have hardly changed their driving style
that drastically in the last 5-7 years. Nor can the widening gap be explained by the addition of auxiliary
equipment (like heated seats) being fitted to the car, as this kind of equipment is only responsible for
around 4% points of the CO2 divergence between lab tests and real-world conditions.27
The widening gap is not
a statistical anomaly as
the result of cars
becoming significantly
more efficient as the
industry claims; nor
does it arise from the
use of an obsolete test –
the test has only
recently changed to
WLTP and the gap is
based upon the same
NEDC test. The primary
cause, confirmed by the
current emission
cheating revelations, is
carmakers
manipulating the
undemanding and
poorly prescribed
Figure 14 – Evolution of the gap between official fuel economy tests and real-world driving emissions tests; and
from 2006 to 2016
choosing to fit
technology to improve the efficiency of the car that works much better in the test than on the road.28 The
widening gap achieved through test manipulation has been the major contributor to the improvement in
official (NEDC) average car CO2 emissions. Had the gap between test and real-world performance been
retained at 20% (the gap in the year that the car CO2 regulation came into force) the official NEDC test values
would be around 21g/km higher.
BY MANIPULATING THE NEDC TEST, THE CAR INDUSTRY HAS GAMED 21G/KM OF SAVINGS . THESE ARE CO2 SAVINGS
THAT HAVE BEEN CLAIMED BUT HAVE NOT DELIVERED ANY REAL- WORLD BENEFIT .
As Figure 15 illustrates, all the major carmakers have been increasingly exploiting flexibilities in the current
official tests. The gap is now so wide (over 50% for some models and manufacturers, e.g. Mercedes-Benz),
that T&E and other experts are unable to explain how carmakers are able to achieve such remarkably low
test results. New additional defeat devices may be the cause. In November 2016 in California, Volkswagen
26
Last report published: T&E, Mind the Gap 2016, 21/12/2016
27
The International Council on Clean Transportation (ICCT) and Element Energy, Quantifying the impact of real-world driving on
total CO2 emissions from UK cars and vans, for the UK Committee on Climate Change, September 2015
28
T&E, Mind the Gap 2016, 21/12/2016
a report by 19said Audi cars with automatic transmissions have technology capable of distorting CO2 emissions when
they are tested.29 The progressive roll-out of cylinder deactivation – that has been used so far on a few luxury
cars – may also provide an opportunity for carmakers to manipulate future testing.
The losers from
manipulating tests are
drivers, the EU economy
and the environment.
Fuel is the biggest
running cost of a car and
drivers are not getting
the benefit of the fuel
economy improvements
they have been
promised. Drivers also
cannot make informed
choices about the cars
they buy, leading to a
loss of credibility for the
whole of the EU’s car
labelling and regulatory
system.
Figure 15 – Gap between official fuel consumption and average real-world driving per
By 2030, the widening
manufacturer in 2016
gap will require drivers to
cumulatively spend €1
trillion more on fuel and the EU to import six billion extra barrels of oil, worsening energy independence
30
and the EU’s balance of payments. As more fuel is burned, CO₂ emissions are also significantly raised
compared to expectations.
3.3. WLTP test is an improvement but not a panacea
The WLTP test is a huge improvement over NEDC, the obsolete test it replaces. The WLTP is much longer
and the car driven much more dynamically (faster accelerations) but is still not realistic compared to real-
world driving. Compared to NEDC the car is moving for a much higher proportion of the test (i.e. fewer idling
phases) and the high speed section of the test is more representative of highway driving. More important
than changes to the test are a much stronger test protocol. These eliminate many of the practices that
carmakers have used to artificially lower NEDC test results, such as charging the battery before the test,
over-inflating tyres, etc. 31 It also requires cars to be tested at the maximum and minimum weight
(depending on the level of optional equipment fitted to the vehicle). All of these developments make the
WLTP test result more representative. However, the WLTP is still a laboratory test and does not accurately
represent real-world emissions that are estimated to be 23% higher.32 The gap arises from test flexibilities
(10%), technologies that perform better in the test than on the road (8%) and the non-use of auxiliary
equipment during the test (5%). This gap is expected to grow to 31% by 2025 as more test flexibilities are
exploited (15%), technologies performing better in the test (10%) and more equipment fitted to cars (6%).
29
Reuters, Audi software can distort emissions in tests, VW says, 13/11/2016
30
T&E, Mind the Gap 2016, 21/12/2016
31
Ibid.
32
The ICCT and Element Energy, Quantifying the impact of real-world driving on total CO2 emissions from UK cars and vans, for the
UK Committee on Climate Change, September 2015
a report by 20THE WLTP TEST UNDERESTIMATES REAL-WORLD EMISSIONS BY AROUND A QUARTER AND THIS WILL GROW TO
NEARLY A THIRD BY 2025.
Part of the proposal of the European Commission for post 2020 car and van CO2 emissions are measures to
tackle the gap between test and real-world performance, including the introduction of in-service
conformity checks that would repeat the WLTP lab test on cars already driven on the road. The proposal
also introduces provisions on fuel consumption meters, but for monitoring purposes only. Neither of these
proposals will stop the CO2 gap between real-world and laboratories from growing nor ensure CO2
reductions are reduced in the real-world as well. Like the Dieselgate scandal, the solution lies in real-world
checks for fuel consumption that have been successfully implemented for air pollution with the RDE tests.
Such a test for CO2 has already been adopted by the PSA Group that was developed with T&E.33 Such a check
on real-world CO2 emissions is essential to drive down CO2 emissions on the road that have been effectively
flat for the past five years,34 in addition to strengthened legislation for fuel consumption meters. The new
car CO2 regulation should be based upon the WLTP test, but a secondary real-world CO2 test should be
performed with a not-to-exceed limit similar to the RDE regulation. This not-to-exceed limit should be set
for each manufacturer as the gap between the fleet average WLTP values and fleet average real world
emissions, measured in 2021 on all new cars. T&E’s proposal is further explained in the section 7.2.3.
An additional control could be to use the real-world fuel consumption and CO2 emissions data obtained
from Fuel Economy Meters (FEMs). These will provide detailed information on the gap between the new
WLTP test and real-world performance. Once this data is available the average gap for each carmaker
should be fixed. Carmakers should then be required to ensure the gap does not grow in the future – if it did
the company 2025 and 2030 targets would be adjusted accordingly to ensure the anticipated CO2 reductions
remained constant.
3.4. Progress towards 2020/1 targets
All major carmakers achieved the weak 130g/km target for 2015 and are now working towards the 2020/1
targets. For these two years, the binding average target is 95g/km but the difference is about the number of
vehicles considered to calculate the CO2 performance of each carmaker’s fleet: in 2020, only 95% of the
vehicles are considered (i.e. the 5% of worst performing CO2 emissions vehicles are ignored); in 2021, 100%
of sales are counted. Each carmaker has a different target as the 95g/km value is adjusted for each
depending on the difference between the average fleet mass of the given manufacturer for a given year and
the reference mass that corresponds to the average mass of the EU fleet.35
Methodology
For this analysis, T&E compiled data from the EEA’s Monitoring of car CO2 emissions databases36 in order
to calculate the CO2 fleet performance of each carmaker’s pool, as described in the latest EEA 2017
report.37 The results were determined from 2008 to 2016, without taking into account the flexibilities
allowed in the regulation (eco-innovations and super-credits). The observed trend for each manufacturer
pool was than extrapolated forward to estimate the emissions without flexibilities for 2021. Ranges were
also assigned to take account that past performance may not be an indication of future performance.
33
PSA Group, The Groupe PSA, NGOs T&E and FNE, and Bureau Veritas publish the protocol for measuring real-world fuel
consumption, 10/10/2016
34
T&E, Mind the Gap 2016, 21/12/2016
35
EEA, Monitoring CO2 emissions from new passenger cars and vans in 2016, Report n°19/2017, 18/01/2018
36
EEA, Monitoring of CO2 emissions from passenger cars – Regulation 443/2009, 19/01/2018
37
EEA, Monitoring CO2 emissions from new passenger cars and vans in 2016, Report n°19/2017, 18/01/2018
a report by 21Projections were also made for the average mass of cars sold in each pool in order to calculate the likely
pool target and compared to the EU reference mass value taken from the European Commission’s post-
2020 cars and vans CO2 proposal, i.e. 1,379.88kg.38 To calculate the level of any possible fines, the 2016
sales of each pool were assumed for 2020 and 2021.
The methodology used to estimate the CO2 compliance in 2020 was similar, with a correction applied to
each pool to derive the 95% best-performing cars based upon all the cars registered in 2016.
The methodology provides an indication of the progress of different carmakers towards their
targets as past performance is not necessarily an indication of how they will perform in reducing
CO2 emissions in the future. The CO2 emissions of future new models is closely guarded commercial
information, but the work done still represents the best publicly available estimates that are
available.
3.4.1. Flexibilities in the regulation
The exact average company CO2 emissions in 2020 and 2021 depends on the emissions of cars sold in each
year and will change as a result of new model releases between now and 2020/1, as well as shifting market
trends. As a result, past performance is not always a predictor of future emissions. Furthermore, the
introduction of the new test is an additional confounding factor. The 95g/km target is based upon the NEDC
but the new WLTP test is now being used to measure car CO2 emissions. The WLTP test results will be
converted into an NEDC equivalent value using the CO2MPAS tool developed by the European Commission.
The CO2MPAS tool is designed to “maintain regulatory stringency” through the process of introducing the
new test. T&E believes that, based upon the choices made in the design of the tool and which flexibilities in
the testing procedure were incorporated into the correlation, there should be regulatory equivalence.
However, there is insufficient data at present to determine whether this is the case or the target has, in
effect, been made more or less stringent through the introduction of the new test.
If the CO2MPAS tool is making the regulation less stringent this will help the carmaker to achieve its targets
more easily. However, if CO2MPAS in effect makes the regulation more stringent, it is very likely carmakers
will resort to double testing cars, measuring the emissions using both tests and using the actual NEDC test
results for the purpose of the regulation. Double testing enables the carmaker to potentially manipulate
the NEDC test result to optimise the test conditions in order to produce a very low NEDC result that will be
used for compliance purposes with the 2020/1 target. However, the carmaker will also be able to optimise
the WLTP test value if they wish to produce an artificially high value to achieve a high starting point for the
post 2020 regulations.
There is emerging evidence that the car industry is currently testing very conservatively on WLTP. In one
member state already the CO2 emissions of over 100 newly registered cars were found to be significantly
higher than the 15% difference experts had been expecting. The wide gap could result from testing
conservatively and not fully optimising vehicle performance initially in order to artificially increase test
values so as to build in a safety margin to be certain to comply with the new conformity of production
requirements, as this can be as great as 5 to 10 grams.
THERE IS EMERGING EVIDENCE CARMAKERS WILL DOUBLE TEST CARS ON THE WLTP AND NEDC TESTS, AND THIS
PRESENTS A SIGNIFICANT RISK TO WEAKENING BOTH THE 95 G/KM TARGET FOR 2020/1 AND THE 2025 TARGET .
But there could also be another reason for this. This is because the proposed post-2020 regulation targets
are a percentage reduction from 2021 levels measured using the WLTP test. High WLTP test values could
38
European Commission, DG CLIMA, Proposal for post-2020 CO2 targets for cars and vans, November 2017
a report by 22make meeting the proposed 2025 and 2030 targets much easier, as once the targets have been set the
carmaker will then optimise the WLTP test to produce a CO2 value as low as possible. In effect, test
optimisation enabled through double testing will weaken both the 2020/1 targets and the future 2025 and
2030 goals.
The only potential problem in this scenario would be if national governments would not adapt their car
taxation policies from NEDC to WLTP – that would increase taxes on WLTP vehicles with significantly higher
CO2. But several governments have already announced they are looking at adapting policies to make sure
the transition from NEDC to WLTP is budget neutral.
Solutions to prevent carmakers from abusing the NEDC-WTLP conversion could include expressing the 2025
target in a fixed WLTP value (so not -15%, but 93.5g/km WLTP), using fuel economy meters or RDE CO2 to fix
the gap between real work and WLTP (explained in more detail in section 7.2.1), or for the Commission to
close the CO2MPAS escape route.
There are also two important flexibilities in the 2020/1 regulations to assist manufacturers in the meeting
of their targets: super-credits and eco-innovations.39 Super-credits are a multiplier to the numbers of low-
carbon vehicles40 sold in order to give them a greater weighting in the final calculations. This factor is set as
1 today but will be 2 in 2020, 1.67 in 2021, 1.33 in 2022 and back to 1 from 2023. However, the super-credit
flexibility is capped at a maximum claim of 7.5gCO2/km for each manufacturer over the period of the
regulation.
The eco-innovation flexibility was introduced in 2011 to encourage manufacturers to develop new
advanced CO2-saving technologies that delivers savings on the road and not in the laboratory. Suppliers
and carmakers must get the Commission’s approval in order to claim reduced CO2 emissions for vehicles
fitted with these eco-innovations. Seven kinds of technology have been approved so far, including solar
roofs and LED lights for instance. 41 This flexibility is capped by a maximum claim of 7gCO2/km for each
manufacturer.
3.4.2. Projections of compliance with the 2020/1 targets
T&E estimates that if carmakers make no use of flexibilities, about half of the pools they established to meet
the goal, including Peugeot-Citroën and Toyota, would be able to meet their 2021 EU CO2 target on time, as
summarised in Table 2. Daimler is also in a good position to respect the target, contradicting the company’s
public statements.42 A small group of companies (BMW, Ford and Volkswagen), would be one or two years
late, assuming there is no accelerated progress towards the targets in the next few years and no use of
flexibilities. However, eight manufacturers will be seriously late in meeting their targets, notably Fiat-
Chrysler, Hyundai-Kia and Opel-Vauxhall. It has to be noted that if Opel-Vauxhall was pooled with Peugeot
& Citroën, the PSA Group would be only one year late, which would reduce significantly the potential fines.
39
EEA, Monitoring CO2 emissions from new passenger cars and vans in 2016, Report n°19/2017, 18/01/2018
40
For the super credit scheme, low-carbon vehicles are cars and vans with CO2 emissions lower than 50g/km on NEDC.
41
European Commission, DG CLIMA, Reducing CO2 emissions from passenger cars, Implementing legislation, Approved eco-
innovation, 24/01/2018
42
The Financial Times, Fiat and Daimler warn on Europe’s emissons targets, 15/01/2018
a report by 23Table 2 – Influence of the use of flexibilities on the CO2 compliance year
(Minimum level of flexibilities = 3.5g/km; Moderate level of flexibilities = 7g/km; Maximum level of
flexibilities = 14.5g/km)
CLAIMS BY MOST CARMAKERS THAT THEY ARE AT SIGNIFICANT RISK OF MISSING 2021 TARGETS ARE NOT SUPPORTED
BY THE EVIDENCE .
T&E has analysed the extent to which flexibilities are needed by each manufacturer pool to meet targets
and avoid fines (assuming progress to reduce emissions continues in the future at the same rate as in the
past). The results are summarised in Table 2, which shows:
- a minimum use of flexibility with a reduction of 3.5gCO2/km thanks to eco-innovations only (no sales
of sub-50g/km vehicles to earn super-credits);
- a moderate use of flexibility with a reduction of 7gCO2/km shared by eco-innovations and super-
credits;
- the maximum allowed use of flexibility with a reduction of 14.5gCO2/km;
- a comparison is also made with the scenario where no flexibilities have been used.
Table 2 clearly illustrates the nine pools on track to achieve 2020 and 2021 targets on time: Volvo,
Mitsubishi, Toyota-Lexus, Daimler, Jaguar-Land Rover, Peugeot, Citroën-DS, Nissan-Infiniti and Renault
Group. In reality, most of these companies will also use flexibilities to enable them to meet goals earlier.
a report by 24Table 2 also illustrates a middle group of companies
that includes Volkswagen Group, BMW Group and Ford.
A minimum or moderate level of flexibilities will allow
these companies to meet their targets on time.
Figure 16 compares the improvement from 2008 to 2016
with the required improvement from 2016-21. The top
ten performing carmakers have a smaller future annual
rate of improvement to achieve than their past
performance (BMW is an outlier); the bottom te
manufacturers must accelerate annual progress
compared to past performance. As a consequence,
some carmakers will need to make a significant use of
the flexibilities (eco-innovations and super-credits) to
avoid fines for non-compliance.
Of the companies that have failed to make sufficient
progress to date, Opel & Vauxhall could also pool with
Peugeot & Citroën, which coupled with the new plug-in
hybrid and electric models coming from 2019 and the
strong performance of the French carmakers to date
should ensure targets are met. PSA have demanded a
rebate on the price paid to General Motors for the
company because of the potential fines.43
Despite their derogation, Mazda and Suzuki 44 would
need to use the flexibilities at their fullest in order to be
on time. For the other carmakers, it will be essential to
sell significant numbers of sub-50g/km vehicles and
zero emission models to avoid fines.
3.4.3. Potential fines
Meeting CO2 targets is not optional for carmakers given
the high level of fines (€95 per over gCO2/km per
vehicle). The fines were deliberately set at a level that is
higher than the (marginal) cost of achieving the
regulation (and that cost has come down compared to
initial estimates). This means it is a very risky and costly
strategy for carmakers to choose to miss the targets.
Table 3 shows the level of fines that could potentially be
incurred in 2021 for those carmakers at risk of missing
Figure 16 – Comparison of the average annual their targets, according to the different levels of
improvement in CO2 fleet emissions for each pool for
flexibility described in the previous section. Hyundai
the periods 2008-2016 and 2016-2021
and Kia would not get any penalty reduction if the two
Korean brands pool together. However, the PSA Group would better pool Peugeot and Citroën with Opel-
Vauxhall plus use some flexibilities in order to eliminate the Opel-Vauxhall penalty.
43
Reuters, PSA seeks Opel refund from GM over CO2 emissions, 29/11/2017
44
According to the EEA, a niche derogation target can be asked by car manufacturers with annual EU sales between 10,000 and
300,000 vehicles. In this case, the target is a reduction of 45% compared to the 2007 fleet CO 2 average. Four OEMs are using this
derogation for 2020/1: Jaguar-Land Rover, Mazda, Subaru and Suzuki.
a report by 25You can also read