The Impact of New Mobility Services on the Automotive Industry - August 2016
←
→
Page content transcription
If your browser does not render page correctly, please read the page content below

The Impact of New
Mobility Services on the
Automotive Industry

August 2016

3005 Boardwalk, Suite 200
Ann Arbor, Michigan 48108
734-662-1287
www.cargroup.org

Emerging trends in mobility technology, such as the rise of ridehailing and carsharing
services, have led many industry analysts to offer their views on how these trends will
affect the automotive industry in the United States. The reports stemming from these
efforts have resulted in highly conflicting visions of the future, ranging from a dramatic
decline in vehicle sales to a windfall in revenue and profits.

Faced with this cloudy picture, researchers at the Center for Automotive Research
decided to weigh in with their own analysis, one that is rooted in our cumulative knowledge
of travel behavior, consumer preferences, and the operational characteristics of new
mobility services.

Our analysis, based on sound data and detailed in this report, sheds light on what we
believe are likely future directions. We welcome feedback on this effort and will continue
to refine our viewpoint as technology, society, and service offerings continue to evolve.

The Impact of New Mobility Services on the
Automotive Industry

This report was produced and published by the Center for Automotive Research (CAR). It was prepared
primarily by CAR researchers Adela Spulber and Eric Paul Dennis, with guidance and input from Richard
Wallace, Director, Transportation Systems Analysis. CAR researcher Michael Schultz provided data
analysis and forecasts critical to the overall effort.

August 2016
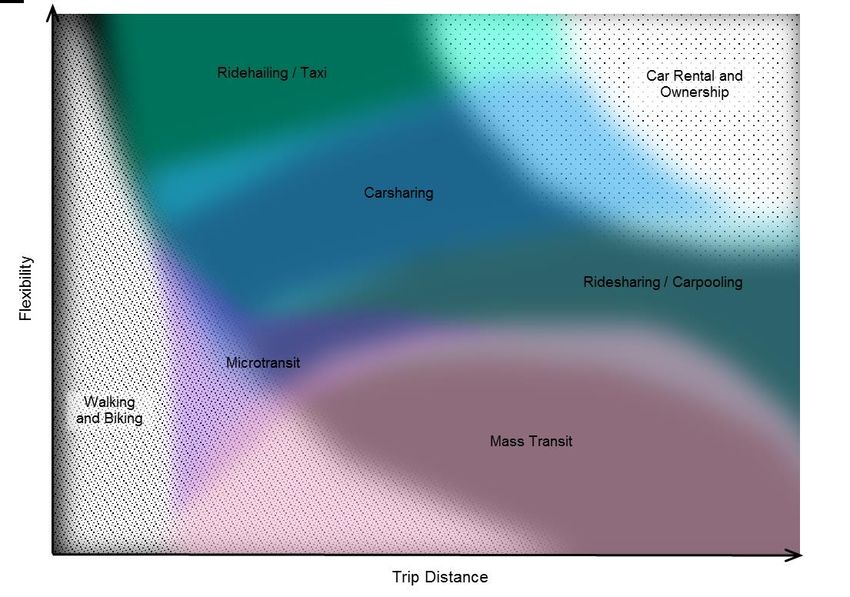
Table of Contents
List of Figures and Tables............................................................................................................................ iii
Introduction ................................................................................................................................................... 1
Types of New Mobility Services .................................................................................................................. 3
   Ridehailing ................................................................................................................................................ 3
   Ridesharing ............................................................................................................................................... 4
   Carsharing ................................................................................................................................................. 5
   Bikesharing ............................................................................................................................................... 6
   Microtransit ............................................................................................................................................... 6
   Mobility-as-a-Service ............................................................................................................................... 7
   Shared Autonomous Vehicles ................................................................................................................... 7
Key Trends in Transportation Choices ......................................................................................................... 8
   Push Forces for New Mobility .................................................................................................................. 8
   State of Transportation in the United States ........................................................................................... 11
   Target Users and Markets of New Mobility Services ............................................................................. 14
   Effect of New Mobility Services on Transportation ............................................................................... 18
State of New Mobility Industry and Potential Growth ............................................................................... 22
   Ridehailing .............................................................................................................................................. 22
   Ridesharing ............................................................................................................................................. 24
   Carsharing ............................................................................................................................................... 25
   Bikesharing ............................................................................................................................................. 27
Implications for the Automotive Industry ................................................................................................... 29
   New Markets and Opportunities for Automakers ................................................................................... 29
   Cost Comparisons between NMS and Private Vehicle ........................................................................... 32
   Effect on Light Vehicle Sales ................................................................................................................. 36
Broader Impacts and Policy Considerations ............................................................................................... 39
Conclusions ................................................................................................................................................. 41
Notes and References .................................................................................................................................. 43

                                                                               ii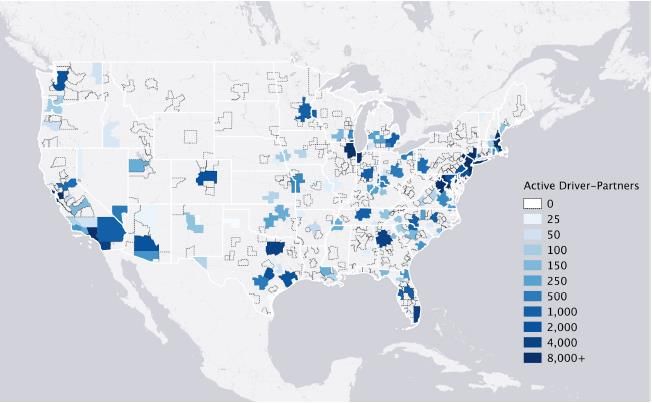
List of Figures and Tables
Figure 1: Enablers and Push Forces Driving the Rise of New Mobility Services .........................................................2
Figure 2: Ideal Use Cases for Different Modes of Transportation .................................................................................3
Figure 3: Annual County Population Growth, by Density .............................................................................................9
Figure 4: Light Vehicle Sales (Vehicles/1,000 people) ............................................................................................... 10
Figure 5: Usual Means of Transportation to Work ...................................................................................................... 12
Figure 6: Average Vehicle Miles Traveled in the United States, 1970-2015 (FHWA) ............................................... 13
Figure 7: Active Uber Driver-Partners in the United States ........................................................................................ 15
Figure 8: Use of Ridehailing by U.S. Adults ............................................................................................................... 17
Figure 9: Alternative Transportation Mode Users Would Take if Their First Choice Was Unavailable ..................... 19
Figure 10: Changes in Personal Travel Behavior Since Using New Mobility Services .............................................. 19
Figure 11: Business Expenses for Ground Transportation in the United States .......................................................... 20
Figure 12: Active Uber Drivers by Service ................................................................................................................. 23
Figure 13: Carsharing: 1998 - 2015 Historic Growth and 2016-2021 Projections in the United States ...................... 26
Figure 14: Carsharing: 2006 - 2014 Historic Growth and 2015-2021 Projections in Three Regional Markets ........... 27
Figure 15: Growth of Bikesharing Programs in the World .......................................................................................... 28
Figure 16: Growth of Bikesharing Programs in the United States............................................................................... 28
Figure 17: Automakers and New Mobility Companies: Examples of Partnerships and Investments .......................... 31
Figure 18: Annual Transportation Costs: Carsharing v. Private Vehicle (City Level) ................................................ 33
Figure 19: Annual Transportation Costs: Carsharing v. Private Vehicle (National Averages) ................................... 34
Figure 20: Annual Transportation Costs: Ridehailing v. Private Vehicle (City Level) ............................................... 35
Figure 21: Annual Transportation Costs: Ridehailing v. Private Vehicle (National Averages) .................................. 36

Table 1: Comparison of Uber and Lyft ..........................................................................................................................4
Table 2: Overview of BlaBlaCar ...................................................................................................................................5
Table 3: Comparison of Zipcar and car2go ...................................................................................................................6
Table 4: Key Factors Affecting Travel Behavior ..........................................................................................................8
Table 5: Guidelines for Where Carsharing Succeeds .................................................................................................. 14
Table 6: Characteristics of Carsharing Markets ........................................................................................................... 16
Table 7: Percent of U.S. Residents That Have Used Ridehailing (Uber or Lyft) ........................................................ 17
Table 8: Potential for New Mobility Services to Increase or Decrease VMT ............................................................. 21
Table 9: Number of Private Vehicles Replaced by One Shared Car, 2021 Projections ............................................... 37
Table 10: Net Loss of New and Used Vehicle Sales Due to Carsharing, 2010 to 2021 .............................................. 38

                                                                                iii
Introduction
The concept of mobility is increasingly being adopted by planners, policymakers, and industry to describe
the systems that allow people to move about their world. This shift in language—from transportation to
mobility—represents a shift in thinking about how a transportation system is best designed and managed.
While transportation is a system-centric concept, mobility is a user-centric concept—recognizing that
transportation products and services must be responsive to the needs, habits, and preferences of travelers
and society.
Numerous new passenger transportation options, collectively called new mobility services (NMS), have
been developing for the past fifteen years. They strive to fulfill as much as possible all users’ needs of
movement and access to places, goods, and people, in a holistic and systemic way.
New mobility services are transportation solutions enabled by emerging technologies and
wireless connectivity that allow for more convenient, efficient, and flexible travel.
Carsharing, ridehailing, ridesharing, microtransit, bikesharing, and mobility-as-a-service
are among the most noteworthy new mobility services currently being developed. Each
has its own business model and underlying service characteristics.
The concept of shared-use mobility, which is at the center of new mobility services (NMS), enables users
to have access to transportation modes (vehicle, bicycle, motorbike, etc.) for a short-term and on an as-
needed basis. NMS provide transportation as an on-demand service, with mobility as the core commodity
promoting choice in transportation mode and encouraging multimodal connectivity and system
interoperability.1 New mobility services often blur the lines between public and private transportation,
and between what is shared and what is owned.
NMS have emerged due to a variety of enablers and push forces (see Figure 1); the former make NMS
technically possible, while the latter make them advantageous. The enablers are advances in technology,
such as wireless communication and accurate GPS location. The push forces include rapid urbanization,
pollution, and congestion, and these are just a few factors that have prompted this wave of innovation in
transportation.
To shed light on how NMS will affect the automotive industry, CAR researchers investigated a wide
range of research on the characteristics of NMS and how they affect travel behavior, demographic and
other societal trends, and developed some of its forecasts. This report presents CAR’s findings and
approach in detail. The focus of the analysis is on the United States, but international comparisons are
made to explain the broader impact of new mobility services, as well as to distinguish how NMS might
have different effects in the United States compared to other places.
We expect to show that NMS likely are not the catalyst of a mobility revolution that will bring about
disruptive and profound change in travel behavior. NMS, bringing new business models, products, and
services, will not supplant the automotive industry in the medium term. Rather, our findings suggest that
NMS are contributing to a mobility evolution. Worldwide, they are part of an incremental change in
travel behavior, especially in urban areas, towards a multimodal system that is less car-centric. This
gradual change will allow traditional transportation players – automakers in particular – to adapt and
maintain their market positions, despite the increasing diversification of the transportation sector.
1Figure 1: Enablers and Push Forces Driving the Rise of New Mobility Services
NEW INCREASING CONSTRAINTS ON RESOURCES
PUSH FORCES
MOBILITY RAPID URBANIZATION
SERVICES
POLLUTION AND CONGESTION
ENABLERS
Digitization and high-speed computing This white paper was developed to:
Wireless connectivity and communication • Identify and describe new mobility
services
Accurate and increasingly affordable sensors • Describe how new mobility services
Location data (e.g., from GPS) are changing travel behaviors
• Present an analysis of how those
Social media expansion changes will affect the automotive
New pricing models and schemes (usage-based) industry
This report is organized into several distinct sections. First, it describes and characterizes the various
types of new mobility services that exist, clarifying the different service offerings and business models
that are being pursued. Second, it presents important trends in transportation and travel behavior, as well
as demographic trends. Third, it examines opportunities for growth in the market for mobility services—
what exists today will not necessarily be the market options in the future. Fourth, based on integration of
these sections, it presents an analysis of how CAR researchers foresee NMS affecting the automotive
industry, followed by analysis of even broader policy implications and overall conclusions.
2Types of New Mobility Services
New mobility services have been characterized as more reliable, predictable, efficient, convenient,
accessible, and seamlessly connected compared to established means of transportation, as well as offering
easier options for payment. NMS, such as ridehailing and carsharing, also contribute to reduced demand
for parking, pollution, and congestion, as well as provide energy savings and transportation costs savings
for users. Each of these NMS fits a specific niche, but they also partially overlap with one another and
with established means of transportation (see Figure 2). Which service is best for a given trip depends on
trip distance and the amount of flexibility (time, destinations available) that the traveler has available for
the trip.2
Figure 2: Ideal Use Cases for Different Modes of Transportation
Ridehailing
Ridehailing services rely on smartphone apps to connect paying passengers with drivers
who provide rides (for a fee) in their private vehicles. Transportation Network Companies
(TNCs) design and operate these online platforms. Most TNCs function as digital
marketplaces that link self-employed drivers with customers and collect a fee for making
the connection. TNCs have deployed a variety of operating models, partnering with
drivers holding a commercial driver’s license or just a normal driver’s license.
Ridehailing started in the late 2000s in the United States and is now available in most of the world. The
biggest TNC is Uber (present on all continents), followed by regional players such as Lyft (United
3States), Didi (China), Ola (India), Haxi (Europe), and Gett (Europe). Conceptually, ridehailing is distinct
from ridesharing. The term ridesharing indicates that drivers share a destination with their passengers, but
the distinction between ridehailing (provided by TNCs) and ridesharing is becoming less and less clear.
TNCs have launched several services that offer clients the option of sharing a ride with others, so-called
“ridesplitting” services. Uber has UberPOOL and UberHop, while Lyft has LyftLine. Nevertheless, these
are not properly ridesharing services, because driver still do not share a destination with their passengers
and operate much like a taxi driver.
TNCs have also been experimenting with actual ridesharing services (for example, UberCOMMUTE,
Uber’s Destinations feature, Lyft Driver Destination, Lyft Carpool) that allow the drivers to input their
destinations and then accept ride requests from people wanting to go along the same route as the driver.
Table 1: Comparison of Uber and Lyft
Company Uber Lyft
Active Since 2009 2012
Passengers 8 million passengers worldwide3 2.8 million passengers4
Active Drivers 450,000 drivers in the United States5 315,000 drivers in the United States.6
and more than one million
worldwide
Geographic Availability 200 U.S. cities. More than 450 cities 200 U.S. cities8 - operates only in the
in 75 countries worldwide.7 United States
Ridesharing
Ridesharing is a type of carpooling that uses private vehicles, arranging shared rides on
short notice between travelers with a common origin and/or destination. This service can
be dedicated to short- or long-distance trips. Travelers share trip costs through these
ridesharing platforms that charge a fee for making the connection.
Carpooling has existed for decades, but real-time ridesharing started in the mid-2000s. Ridesharing is less
popular than carsharing in the United States, and so far Europe is the biggest market for this type of
service. The largest operator is BlaBlaCar, a long-distance ridesharing platform present in Europe and
South America (see Table 2). In the United States, several small players offer platforms for enabling peer-
to-peer ridesharing (mostly short-distance) or organizing real-time carpooling or vanpooling; these
include vRide and Commutr. As another example, Waze (owned by Google) launched a ridesharing pilot
project in May 2016 with several companies in the Bay Area. By using a dedicated app called Waze
Rider, more than 25,000 employees will be able to request a ride from other Waze users who share similar
commutes. Drivers can choose whether or not to approve that request in the original Waze app. Riders
pay drivers a suggested amount based on the standard rate set by the Internal Revenue Service (IRS) —
54 cents per mile.
4Table 2: Overview of BlaBlaCar
Company BlaBlaCar
Active Since 2006
Members 25 million members
Rides 10 million people transported / trimester
Geographic Availability 22 countries in Europe and South America.
Business Model Long-distance peer-to-peer
Carsharing
Carsharing is a short-term car rental, often by the hour. Electronic systems allow
customers unattended access to the vehicles. Gasoline and insurance are included in this
type of service. These characteristics distinguish carsharing from traditional car rental. In
the last few years, however, the distinction between the two models is increasingly
blurred, especially as car rental has become more similar to carsharing.
Business models:
• Round-trip carsharing— must have a reservation with beginning and end time; vehicle must
be returned to its home station
o Peer to Peer (P2P) - private individuals own the fleet.
o Business carsharing – companies own the fleet, station-based.
o Corporate carsharing – corporate fleets with carsharing technology (telematics and
online scheduling).
• Flexible carsharing — one way/on demand services
o Free floating – vehicles can be parked on the street in any legal parking space in
the “home area”.
o Station-based – vehicles can be parked only in designated garages, parking lots
or at electric vehicle charging stations.
Carsharing is available in 26 countries spread across North and South America, Europe, Asia, and
Oceania. The biggest carsharing market is Europe, home to more than two million members and nearly
60,000 vehicles in service in 2014. North America ranks second, with more than 1.6 million members and
nearly 25,000 vehicles as of 2014.9
The first carsharing programs in North America started in 1994. As of January 2015, 23 carsharing
programs were operating in the United States10 (excluding peer-to-peer), slightly less than half of which
were for-profit services. Contrary to the situation in Europe, flexible carsharing is less common than
round-trip carsharing in the United States. The largest programs are operated by car rental companies and
vehicle manufacturers. In January 2015, U.S. carsharing programs amounted to 16,700 vehicles and 1.2
million members.11 The three largest operators, Zipcar, car2go (see Table 3), and Enterprise CarShare,
support almost 96 percent of the membership.
5Table 3: Comparison of Zipcar and car2go
Company Zipcar car2go
Owner Owned by Avis Budget Group Owned by Daimler
Active Since 2000 2008
Members 950,000 members worldwide 1,566,000 members worldwide12
Geographic Availability Over 50 major metro areas, 500 Over 30 cities in Europe, North
college campuses, and 50 airports America and China.
in Europe and North America.
Rental Model Station-based, mostly round-trip. Free-floating, one-way.
Bikesharing
Bikesharing is a system that provides free or affordable access to bicycles for short-
distance trips, mostly in urban areas.
Bicycle-sharing models
• Community Bike programs - organized mostly by local community groups or non-profit
organizations
• Smart Bike programs – implemented by government agencies, sometimes in a public–
private partnership
Bikesharing systems are available in almost 1,000 cities worldwide,13 especially in China, Italy, and
Spain. The systems with the highest number of shared bicycles are located in Paris, London, Changshu,
New York, and Barcelona.14 As of October 2015, the United States was home to about 30,700 shared
bikes at 3,300 stations across 70 systems, covering 104 U.S. cities.15 The largest U.S. programs are in
Washington, D.C.; Minneapolis; and Boston.16 Some of the biggest operators of bikesharing in the United
States. are Motivate, DecoBike, and Zagster. The majority of bikesharing systems are point-to-point, or
one-way.
Microtransit
Microtransit is a wide category encompassing various private transit services that use
small buses and develop flexible routes or schedules (or both) based on customer
demand. Microtransit bridges the gap between single-user transportation and fixed-route
public transit and resembles current route-deviation services.
Microtransit operates in a similar manner to jitney service, New York's informal dollar vans, or city-
operated paratransit services. What sets it apart are wireless connectivity and data analytics. Better data
on mobility patterns and wide smartphone access have made flexible, on-demand transit more convenient
for the users and more profitable for providers. A few microtransit companies started operating in the
United States around 2010: Bridj (Boston, Washington, and Kansas City), Chariot (San Francisco), and
Via (New York, Chicago). A few operators, such as Leap Transit (San Francisco) and Kutsuplus
(Finland), have suspended service after a brief operating period.
6Mobility-as-a-Service
Mobility-as-a-Service (MaaS) is a mobility distribution model in which a person’s
transportation needs are met over one interface and are offered by a service provider. In
general, multiple transportation options (mass transit, carsharing, ridehailing, etc.) are
bundled, an integrated solution is presented to the user through a smartphone app, and
service is paid for through a single account.
The goal of MaaS is to provide end-to-end transportation by linking different transportation modes and
making better use of the existing transportation options in a given area. Transportation aggregators like
Google Maps and the Bay Area’s 511 website are precursors of MaaS. Mobility-as-a-service was first
conceptualized in Europe and a Pan-European MaaS Alliance was formally unveiled at the 2015 ITS
World Congress. The MaaS Alliance is an umbrella for several projects aimed at developing MaaS
business models and payment options.
In general, European initiatives are more advanced than their American counterparts. Pilot projects such
as UbiGo (Sweden) and MaaS (Finland) were deployed in 2014-2015. Following their success, they are
aiming at providing travel packages (monthly subscription or usage-based) in Gothenburg and Helsinki in
2016 or 2017.
In the United States, companies like TransLoc, Xerox, and moovel N.A. are developing transportation
aggregator apps, including employee commute benefits, and are developing partnerships with local
authorities. Since late 2015 to early 2016, Xerox has been testing its Seamless Transportation solution in
Valence, France, and its Mobility Marketplace in Los Angeles and Denver. RideScout, which merged in
2016 with GlobeSherpa to form moovel N.A. LLC, has tailor-made solutions in more than 70 cities in the
United States and Canada, that approach the concept of MaaS.
Shared Autonomous Vehicles
Shared autonomous vehicles are fully self-driving (fully automated or autonomous)
vehicles that do not require human drivers; human input is needed only to provide
information regarding the origin and destination of the trip.
The working concept is that shared autonomous vehicles (SAVs) can be summoned by customers using
mobile phone applications, much like ridehailing services are accessed through TNCs. Several automotive
manufacturers (Volvo, GM, Ford, Mercedes, etc.), technology companies (Google, EasyMile, Apple), and
new mobility companies (Uber, Lyft, Zipcar) currently are working on the development of shared
autonomous vehicles. Most forecasts expect SAVs to be available for the public beginning with 2020-
2025, first on enclosed perimeters (campuses, airports, etc.) and then on city roads.
7Key Trends in
Transportation Choices
The introduction and adoption of new mobility services is related to several broad trends,
such as rapid urbanization, economic growth, increasing road congestion, increasing
pollution from the transportation sector, and changing mobility preferences.
The uneven prevalence of these trends across the globe and within the United Stated implies that the
potential for NMS to disrupt transportation, and the automotive industry with it, is similarly variable.
NMS are being increasingly used in the largest and densest cities, as well as, to a lesser extent, smaller
urban areas and inner suburbs. New mobility services are far less adapted to sprawling and sparsely
populated areas, where a majority of the United States population lives and where the convenience of
driving one’s own car is greater than the appeal of NMS. Overall, the transportation choices U.S.
residents make will be transformed by new mobility solutions to a lesser extent than in other parts of the
world. The U.S. automotive market is relatively less vulnerable to disruptive NMS services than are other
markets.
Push Forces for New Mobility
The impacts of new mobility services on the transportation sector are largely determined by their
interaction with the factors affecting travel behavior (Table 4) and the evolution of these factors over the
last few years. Recent and long term evolutions of a few factors affecting travel behavior are acting as
push factors for new mobility services.
Table 4: Key Factors Affecting Travel Behavior
Demographic Trends User Preferences
Population age structure Social preferences for mobility
Population growth and density Preferences for residence
Licensed drivers Telework and work commute
Transportation Options Transportation Costs
Available means of transportation: private Fuel prices, transit fares
vehicle, mass transit, ridehailing, taxi, Vehicle ownership costs
carsharing, car rental, ridesharing, Toll and parking prices
carpooling, bicycle, bikesharing, walking Road congestion
Infrastructure and Planning Macrofactors
Land zoning and development trends Economic growth
Public investment Employment and income
Traffic management systems Global warming and pollution
8Population Growth and Density
Worldwide, the most important demographic trends include rapid urbanization, the expansion of
megacities, and densification. The U.S. situation, however, is different, because low-density development
and urban sprawl is dominant (see Figure 3). In recent decades, American urban areas and downtowns
have made a significant recovery in terms of population, development, and job growth. Between 2007 and
2015, there was a rebound in urban growth, when population growth in urban counties17 grew more
rapidly than in suburbs and exurbs; however, urban this urban revival has slowed since 2015, and
suburban county populations are once again growing faster than urban ones.18
Figure 3: Annual County Population Growth, by Density
Annual Population Growth
Source: U.S. Bureau of Census data, graphics by Jed Kolko
The stronger population growth in the suburbs will have a direct impact on the adoption of new mobility
services, especially of those that are particularly suited for dense urban areas. More specifically,
carsharing, ridesharing, and transportation network companies might not be so disruptive, because the
fabric of the United States is likely to remain dominated by a suburb pattern, for which new mobility
services are not particularly adapted.
User Preferences
The growing preference for urban living, biking and walking can contribute to a decrease in personal
vehicle use. Residential choice can be used to understand travel preferences. There is an increasing
demand to live and work in urban walkable areas. The choice to live in a downtown area or a suburban
subdivision includes some consideration of the transportation options available in those areas.
Accordingly, people move into the city partly because they want to walk, bike, or use transit more than
they want to drive.
Increasingly, home owners, renters and businesses attach an increasing economic value to walkability and
dense urban areas. This is why home prices increased 50 percent faster in urban centers19 and office space
in walkable urban areas has a 74 percent price-per-square-foot premium compared to rents for office
9space in suburban business parks.20 All in all, an increased desirability for areas that are dense, walkable,
and have public transit leads to a decrease in interest for a car-centric lifestyle, which may have a positive
impact on new mobility services and possibly a negative one on vehicle sales.
In reaction to the preference for urban lifestyle, recent land and transportation planning efforts, whether in
urban or suburban settings, have put an increasing emphasis on rendering neighborhoods more walkable,
building complete streets and expanding bike lanes. In addition, part of the planning community strives to
reduce the need for physical movement through higher urban densities, transit oriented design, increased
access to services and goods, all of which contribute to reducing the energy intensity and congestion of
urban mobility.
Population Age Structure
Millennials and, to some extent, Baby Boomers will be the driving forces of the adoption of new mobility
services. Changes involving these two demographic categories will likely increase demand for new
mobility services. Millennials now represent the biggest cohort of the American population.21 This
generation is more urban than its predecessors and has increased as a proportion of residents in the center
of nearly every city in the country, while falling as a proportion across all other areas.22 Millennials are
also less car-focused than previous generations, more likely to use public transit, bike or walk, and have
led a broader shift in transportation behaviors among Americans (see Figure 4). Millennials are the early-
adopters of most of the new mobility services, from carsharing, ridesharing, bikesharing. They also are
more open to connected and automated vehicles, as well as less polluting vehicles. The preference
Millennials appear to have for the urban living, will reinforce the spread of these services, which are
particularly suited for dense urban areas.
Figure 4: Light Vehicle Sales (Vehicles/1,000 people)
67.61
70 65.82
61.47
66.89
60 54.60 62.84
50.43 58.81
50 47.10
50.73 40.97
40 34.76
42.64
28.48
30
22.12
20
2010 2011 2012 2013 2014
Millennials (Gen Y) Generation X Baby Boomers
Source: U.S. Bureau of Census and J.D. Power data
In 2014, a typical Millennial was about 30% less likely to buy a car than someone from older
generations.23 In addition, today’s younger generation buys fewer cars than young people did ten years
ago. For example, in 2003, 25 out of 100 persons in their mid-thirties took auto loans. In 2015, only about
17 out of 100 people in the same age group did so. The only age group that was more likely to take an
auto loan in 2015 that in 2003 were people over 65 or older. 24 Factors that can help explain why
10Millennials are less likely to buy automobiles include: gasoline prices, student debt, credit history, interest
rates, and travel preferences.
Baby Boomers primarily live in suburbs. As they get older, driving becomes more of a challenge for them
because of age-related health issues. The mobility challenges that an aging Baby Boomer generation will
have in a suburban setting means that this cohort will have increasing needs for alternative mobility
services, whether they are ridehailing, semi-flexible route shuttles, multimodal solutions (especially
innovative last-mile solutions), or shared autonomous vehicles.
Licensed Drivers
For the last 30 years, the percentage of licensed drivers has been dropping in all age groups, though the
United States maintains one of the highest rates in the world. The decline is steeper for the younger
population, but it is present even among the older age groups. For 16-to-44-year-olds, there has been a
continuous decrease since 1983. The percentage of licensed drivers among 45-to-69-year-olds started
decreasing in 2008. Finally, the number of drivers 70 years and older has also been decreasing since
2011.25
Transportation Options and Costs
Changing preferences and macro-factors are not enough to change travel behavior, because behavior
strongly depends on available options. Public transit networks, walkable and bikeable roads, along with
the new mobility services, cover only a limited part of the United States. Only 55 percent of American
households reported that they have access to public transportation service.26 Europe is a different
situation, where a growing number of municipalities implement policies that discourage driving in city-
centers to curb pollution and congestion. Also, a bigger share of the European population lives in areas
covered by a public transit network. Another important element is the cost of transportation. The costs of
owning and using a vehicle are relatively lower in the United States than in other countries, which is an
important factor in the preference for a private vehicle.
However, in recent years, there has been an increase in the number of new transit projects across the
United States for bus rapid transit, street cars, and busses. There has also been a strong effort to move
towards smart transit solutions for traffic management, real-time location of transit assets, and new
ticketing solutions integrating smartphones and credit cards, smart cards, etc. Part of the planning
community believes that as population density in urban areas increases and daily-routine destinations
become more accessible through walking, biking or transit, a personally-owned car that sits idle more
than 95% of the time will become a less desirable and economically-feasible business model for personal
mobility.
State of Transportation in the United States
In contrast with countries in Europe and Asia, in the United States private vehicles have
a far larger modal share than other options and retain a dominant place in the
transportation system.
In 2013, 76.3 percent of Americans commuted to work by driving alone, and this share has been
increasing over the years (see Figure 5). This is why the United States has one of the highest ratios of
11vehicles per capita, fourth-place worldwide after three microstates, San Marino, Monaco, and
Lichtenstein. Since 2008, however, this number has stopped growing and is now slowly declining, settling
at just under 0.8 in 2013.
In 25 years, the share of people that carpool was divided in half. Carpooling dropped from 19.7 percent in
1980 to 9.8 in 2013. In addition, the average vehicle occupancy has also dropped for all trip purposes,
from 1.9 passengers in 1997 to 1.7 in 2009. This is partly explained by the low costs of owning and
operating a single occupancy vehicle. The United States has some of the lowest costs of driving in the
world. Low gas prices combined with higher wages makes driving in the United States very affordable. A
gallon of gas costs just 1.8 percent of the average daily wage; in European countries, it is between 5 and
20 percent.27 Moreover, driving to work alone is partly facilitated by employer subsidized parking and
highway expansion policies that make HOV lanes less attractive. Additionally, changes in the job market
made carpooling less relevant. Jobs are less concentrated that they have been in the past, work schedules
are more flexible, and teleworking is increasing.
The use of public transit is highly concentrated in the United States within a few dense metropolitan
areas. Only 5.1 percent of workers commuted by public transit. Despite the dominant place of the private
vehicle, public transportation and bicycles have seen an increase in use since 2000. This trend is likely to
continue in coming years.
Figure 5: Usual Means of Transportation to Work
100% 7% 6.4%
75.7% 76.3% 6% 5.6%
80% 73.2% 5.3%
5.1%
64.4% 5% 4.7%
4.3%
60% 3.9%
4%
3.3%
3.0%
40% 3%
2.3%
2.9% 2.8%
2%
15.9% 13.5% 13.9%
20% 12.1%
19.7% 1%
13.4% 12.2%
0% 9.8% 0%
1980 1990 2000 2013 ACS 1980 1990 2000 2013 ACS
Census Census Census Census Census Census
Private vehicle - Drove alone Public transportation Motorcycle
Private vehicle - Carpool Bicycle Walked only
Other means of transportation or worked at home Other means Worked at home
Younger population groups are driving less28 and use public transit more than other generations,
especially in dense metropolitan areas with robust public transit networks. For example, in the San
Francisco metro area, the share of 16-24 year-olds who drove to work fell from 71 percent in 2006 to 64.8
percent in 2014.29 While in San Francisco, Boston, and Seattle, all age groups registered similar driving
declines, in other urban metro areas the sharpest declines were among the younger generation. In the
Chicago, Dallas, and Minneapolis regions, the share of young people driving to work decreased sharply,
even as those of other age categories remained stable or even increased.
12Peak car travel happened ten years ago.
After the United States experienced “peak car travel” in 2005, the number of vehicle miles traveled
(VMT) per capita started falling, and the drop accelerated during the Great Recession that begun in 2008
(see Figure 6). The lowest point was reached in the first months of 2014. After mid-2014, VMT per capita
started increasing again, and in 2015 this number reached the same level as in 2001, roughly 9,500 miles.
A new peak might yet be achieved in the next few years. Although vehicle miles traveled were on a
downward trend, the average commute time has not stopped increasing and reached 25.8 minutes in 2013.
Figure 6: Average Vehicle Miles Traveled in the United States, 1970-2015 (FHWA)
12 3.5
Vehicle miles traveled per capita
11
3
Vehicle miles traveled
10
(thousands)
9 2.5
(trillions)
8 2
7
1.5
6
5 1
VMT per capita VMT
Millennials are driving less than previous generations. A 2009 and 2001 VMT per capita comparison
reveals that, while decreases have been made across the board, the most substantial declines are between
the ages of 20 to 40, a range that overlaps with Millennials. Overall, because of long term trends with
high inertia, it is unlikely that the dominant place of the private vehicle in the transportation landscape of
the United States will be significantly challenged by new mobility services in the medium term.
13Target Users and Markets of New Mobility Services
New mobility services are growing in areas with specific characteristics and many of their first adopters
share a set of distinctive demographic traits.
Geographic Availability and Target Markets
Overall, new mobility services work best in denser and walkable urban areas with good
public transportation networks. New mobility services are not used as a sole means of
transportation, but instead are used in combination with other ones, especially public
transit.
New mobility services are and will be used more intensively in areas with good public transit, but just
occasionally in areas with little or no public transit; in such areas, new mobility services might be used for
specific purposes, such as to or from an airport. In areas with low public transit coverage, a personal
vehicle remains the dominant mode of transportation, thereby limiting the demand for hailing an Uber or
renting a Zipcar.
In addition to the factors mentioned above, carsharing programs are most likely to succeed in areas with
higher than average density and mixed land uses (see Table 5 for details). In addition, programs work best
in areas where there are a great variety of potential uses for carsharing.30 Peer-to-peer or non-profit
carsharing programs can serve less dense residential areas than commercial carsharing programs, because
profit is not a priority.
Table 5: Guidelines for Where Carsharing Succeeds 31
Demographics
One-person households minimum 30%
Work Commute Mode
Drive alone maximum 55%
Walk minimum 5%
Vehicle Ownership
Households with 0 vehicle 10% - 15%
Households with 0 or 1 vehicle 60% or more
Neighborhood Characteristics
Housing units per acre 5 or more
Source: TCRP (2005)
Carsharing programs are now available in most large U.S. cities. Zipcar is in 46 of the 50 largest U.S.
metropolitan areas (in terms of public transit ridership), and car2go is in nine out of the 50. Zipcar has
also targeted university campuses and airports, both of which are viable market areas for carsharing.
Ridehailing operator Uber is making most of its revenue in a few big U.S. cities (New York City, San
Francisco, Chicago, Washington D.C. and Los Angeles), according to 2014 revenue data (see Figure 7).
At the end of 2014, the fastest growing cities in terms of Uber driver-partners were Miami, Austin, and
14Houston.32 Ridesharing services also are available in suburban areas, but they are less profitable in these
areas.
Figure 7: Active Uber Driver-Partners in the United States
The map indicates the number of Uber driver-partners who took at least four trips in
November 2014, by Census Metropolitan Statistical Areas
Source: Hall and Krueger (2015)
For bikesharing systems, connections to the public transit network are a key factor of success. In April
2016, 77 percent of the 3,378 bike-share stations in the United States are within a block’s distance of
public transportation.33 These connections extend the transit network by offering ways of reaching places
with public transit and a way for reaching destinations not served by transit. Bikesharing is most feasible
in core urban centers, but may also be viable near suburban points of interest (commercial centers, office
parks). Finally, bikesharing is dependent on the quality of the bike/road infrastructure. The Midwest and
the West have higher biking rates than the Northeast and the South.34 Climatic factors (such as excessive
cold, heat, and rain), however, have very little impact on the prevalence of biking.35
Ridesharing has the most potential along commuting corridors in denser areas. Inner-ring suburbs (10 to
15 miles outside the urban core) have a high ridesharing potential as well. These areas have a higher
concentration of workers with similar commutes, headed either to the downtown areas or suburban office
parks.36
Finally, Mobility-as-a-Service solutions have the potential to be implemented and grow in most cities that
offer at least two or three transportation modes (public transit, bikesharing, ridehailing/taxi, carsharing,
microtransit).
Profile of New Mobility Services Users
The users of new mobility services are mostly urban dwellers and have higher income
and educational attainment levels than average. They are also less likely to own a vehicle
and rely more heavily on public transportation, especially for the work commute.
15The average NMS users own 1.05 cars per household,37 compared to the national average of 2.06.38
Overall, a third of U.S. Millennials are interested in or already using new mobility services.39 The target
demographic for carsharing programs are younger than average, with a median age of 35 years.40 They
are also urban dwellers with relatively high education levels (83 percent of carsharing members hold at
least a Bachelor’s degree41), as well as college students and faculty. They rely more heavily than the
general population on public transit and other transportation options,42 and have a low vehicle ownership
rate (0.47 vehicles per household for carsharing users, compared to the U.S. average of 2.1 vehicles).43
See Table 6 for details. In addition, people that occasionally need a second car or a specific type of
vehicle (a truck, for example) and business travelers are also more likely to consider becoming carsharing
members.44
Table 6: Characteristics of Carsharing Markets
Characteristics Neighborhoods with Regional Average
access to carsharing
Demographics
One-person households 51.8% 27.2%
Households with children 12.5% 32.4%
Rental households 71.5% 39.6%
Households earning more than $100,000 18.2% 17.9%
Persons with Bachelor's degree or higher 54.6% 34.0%
Means of Transportation to Work
Drive alone 33.0% 69.4%
Carpool 6.6% 11.6%
Public transit 30.8% 8.8%
Bicycle 2.1% 0.8%
Walking 21.9% 4.4%
Vehicle Ownership
Households with no vehicle 40.0% 11.3%
Average vehicles per household 0.84 1.66
Neighborhood Characteristics
Housing units per acre 21.7
Source: TCRP (2005)
16Ridehailing users are generally younger, with a median age of 33 years. Ridehailing use is also more
concentrated among urban dwellers and those with higher levels of income and educational attainment
(see Table 7). More than half of frequent (daily or weekly) ridehailing customers take public transit daily
or weekly, and almost two thirds of them own a car. Conversely, two in five less frequent ridesharing
users are frequent transit users, and four in five of them own a car.45
Table 7: Percent of U.S. Residents That Have Used Ridehailing (Uber or Lyft)
Demographic Percent
Population All U.S. adults 15
Age 18-29 years 28
30-49 years 19
50-64 years 8
65+ years 4
Education H.S. graduate or less 6
Some college 15
College graduate 29
Personal Income Less than $30,000 10
$30,000-$74,999 13
$75,000+ 6
Residence Area Urban 21
Suburban 15
Rural 3
Source: Pew Research Center (2016)
Survey results indicate that 15 percent of U.S. adults have used ridehailing services and that three percent
of Americans use ridehailing services on a daily or weekly basis (see Figure 8). In addition, frequent
ridehailing users tend to use public transit, walk, ride a bicycle, and take a taxi more than non-users.46
Figure 8: Use of Ridehailing by U.S. Adults
Use of Ridehailing by U.S. Frequency of Use by
Adults Ridehailing Users in the U.S.
No answer
1%
15% Have used
ridehailong apps
Daily /
weekly
Have heard of, 17%
51% but not used
Have not heard of Less Monthly
often 26%
56%
33%
No answer
1%
Source: Pew Research Center (2016)
17A 2013 survey (n=618) analyzed the socio-demographic characteristics and usage patterns of members of
the ridesharing program BlaBlaCar in France. The respondents tended to be younger (around 30 years
old) and more educated than the national population, though their income level is roughly similar to that
of the general population. Students and individuals that use the BlaBlaCar for work trips employ it more
frequently. The findings suggest some equity balancing effects, which may be unique to this shared
mobility mode. Notably, users with a lower income level are more likely to be passengers, while higher
income users use carpooling mainly as drivers.47
Effect of New Mobility Services on Transportation
New mobility services are changing the transportation sector, either by providing entirely new mobility
solutions or by reshaping traditional transportation means with technology (ridesharing with carpooling,
microtransit with bus shuttles). As a result, there is more diversity in terms of transportation solutions and
a greater offer of individual mobility, as opposed to collective mobility (public transit). NMS are having a
transformative effect on many cities by increasing transportation accessibility. From the point of view of
the user, NMS contribute to a shift from one solution to every mobility need, the privately owned vehicle,
to many custom solutions.
Modal Shift Linked to The Use of New Mobility Services
Overall, the growth of new mobility services has been associated with a decrease in the use of private cars
and an increase in public transit use; however, some people also prefer NMS over public transit in certain
circumstances. For example, research indicates that people prefer carsharing or ridehailing to public
transit, if the transit trip takes longer or requires several changes. 48 In total, new mobility services
substitute for more private vehicle trips than for public transit trips.
New mobility services substitute more private vehicle trips than public transit trips, with variations
according to each mode of transportation. For example, almost a third of carsharing users say they would
drive a car or drive with a friend, but only 23 percent would take public transit, if carsharing was not
available. Over a third of ridehailing users would switch to a private vehicle (driven alone or with a
friend), and 15 percent to public transit. Finally, half of bikesharing users would take public transit if
bikesharing was not available. See Figure 9 for details.
18Figure 9: Alternative Transportation Mode Users Would Take if Their First Choice Was Unavailable
35%
30%
25%
20%
15%
10%
5%
0%
Top mode: Bus Top mode: Train Top mode: Top mode: Top mode:
Bikesharing Carsharing Ridehailing
Bus Train Bikesharing Carsharing
Private bicycle Ridehailing Walk Drive alone
Drive with friend Would not go Other
Source: Shared-Use Mobility Center (2016)
A growing body of research shows that the more people use NMS, the more likely they are to take public
transit, use and own fewer cars. A recent survey showed that as a result of using new mobility services, 30
percent of the respondents drove a car less to work, 22 percent drove a car less for errands and recreation,
and 15 percent used public transit more (see Figure 10).49 Other surveys show that, for carsharing
specifically, more users increased their use of public transit and non-motorized modes than decreased it.50
Figure 10: Changes in Personal Travel Behavior Since Using New Mobility Services
Used public transit more 15%
Drove a car less for errands or recreation 22%
Drove a car less to work 30%
Became more physically active 48%
Source: Shared-Use Mobility Center (2016)
Ridehailing has a particularly important impact on taxis and rental cars, in addition to the implications for
the use of private vehicles (40 percent of ridesharing users state having reduced their driving51) and public
transit mentioned above. In terms of gross revenue, Uber already surpasses conventional taxis in several
cities.52 After ridehailing gained in popularity for personal use, corporate users started shifting towards
these services as well. In reaction to that, Uber and Lyft now have programs for corporate travel. In the
fourth quarter of 2015, use of ridehailing services for business trips exceeded that of rental cars for the
first time, and the gap is widening. In the last two years, the number of car rental transactions for business
trips has fallen 15 percentage points. For conventional taxis, the decline was even steeper, with a 23
percentage points loss over the same period. See Figure 11 for details.53
19Figure 11: Business Expenses for Ground Transportation in the United States
100%
80% 38% 40%
48% 45% 44%
55% 51% 52% 50%
60%
20% 14%
24% 22%
40% 30% 25%
36% 31%
37%
42% 46%
20% 34%
31%
22% 25%
13% 17%
8%
0%
Q1 2014 Q2 2014 Q3 2014 Q4 2014 Q1 2015 Q2 2015 Q3 2015 Q4 2015 Q1 2016
Ridehailing Taxi Car Rental
Source: Certify (2016)
However, the growth of the ridehailing services is only partly at the expense of taxi companies. The
introduction of ridehailing can also increase overall consumer demand, as one study based on Portland
suggests. Four months after the arrival of Uber and Lyft in Portland, the weekly total of taxi and
ridehailing rides increased by 40 percent. Within that total, taxi ridership decreased by 16 percent and
ridehailing ridership increased by 125%.54
Concerning microtransit specifically, 70 to 80 percent of the first users of Bridj in Boston are transit
riders, and for this population, Bridj is in direct competition with traditional transit companies.55
Nevertheless, Bridj aims to provide transportation connections to parts metro areas that do not have a
good bus service and has targeted cities like Washington and Boston, where a third of residents do not
own a car.
Ridesharing has a big impact on private vehicle use and public transit. In Europe, BlaBlaCar, which
specializes in long distance ridesharing, has been able to cater to people who need cheaper or more
flexible transportation options than trains or long-haul buses. The service is also contributing to
increasing vehicle occupancy. BlaBlaCar rides average 2.8 people in each vehicle, compared to about 1.5
people for all European passenger cars.56 As the operations of the company expand (BlaBlaCar had 2
million passengers a month as of June 2015), increasing vehicle occupancy will start to have a visible
impact in alleviating congestion and pollution.
A study of users of bikesharing programs in North America documented modal shift with respect to
public transit (bus, rail) and personal vehicle. Bikesharing members in larger cities used transit less, while
transit ridership increased in smaller cities. In all cities, bus ridership increased as a result of bikesharing
improving access to the transit network. Half the bikesharing users reported reducing their private vehicle
usage. Just 5.5 percent of the members sold or postponed a vehicle purchase.57 In addition, the modal shift
from private vehicle to bikesharing is about 4 percent.58
Finally, Mobility-as-a-Service, which displays several transportation choices, may help educate and
incentivize users to try other transportation modes than driving alone, which may ultimately contribute to
a decrease in VMT. The pilot project for UbiGo in Gothenburg, Sweden, showed that first adopters of this
MaaS solution had decreased their private vehicle use.59
20Specific Use Cases of New Mobility Services
Despite some modal shift away from public transit and private vehicles, new mobility services do not
serve the exact same purpose as these two established means of transportation. Overall, NMS complement
public transit and enhance urban mobility. These new transportation modes are used more often during
the weekend than on weekdays, to the opposite of public transit. For example, ridehailing services are
mostly used for social trips and between 8 P.M. and 4 A.M., at times when public transit service is least
available. Conversely, ridehailing is least used during the morning and evening rush hours, as well as
weekdays overall. During the evening and night, more people use ridehailing than their private vehicle
(drive alone). At these times of day, carsharing is used just slightly less than private cars.60 For example,
more than half (54 percent) of ridehailing customers use the service for social trips, whereas only 21
percent of them use it for their commute, and 16 percent for shopping and errands. The peak demand for
ridehailing is between 10 P.M. and 4 A.M. on weekends, when transit is not running or has a low
frequency.61 Carsharing is also used more for trips associated with leisure and less for the work
commute.62
New Mobility Services as Part of a Multimodal Solution
Evidence suggests that new mobility services are generally used in combination with public transit and
that they can extend the catchment area of public transit. By addressing the first-and-last mile issue
related to public transit access, NMS can potentially contribute to bridging gaps in existing transportation
networks and encouraging multimodality. Carsharing for example is mostly used in a multimodal mix. In
San Francisco, members made 4.8 percent of their trips using carsharing, whereas 47.6 percent of trips
were made by walking or biking, 28.8 percent by public transit, and 16.9 percent by private car.63 In
Portland members used carsharing for just 2.5 to 3.5 trips per month.64
Effects of New Mobility Services on Vehicle Miles Traveled
It is yet unclear what the overall effect of new mobility services will be on vehicle miles traveled. Several
scenarios, listed in Table 8, could enter into play.
Table 8: Potential for New Mobility Services to Increase or Decrease VMT
Increase in Vehicle Miles Traveled Decrease in Vehicle Miles Traveled
Travel will become more convenient and New mobility services and shared
productive (rest or work), and this will lower autonomous vehicles contribute to a decrease
the time cost of travel. in vehicle ownership and use.
Being freed from the need to drive, users of Move to pay-as-you-go transportation models
shared autonomous vehicles feel encouraged to discourages unnecessary travel.
move even farther from the urban cores. Move to pay-as-you-go transportation models
More travel options for non-drivers (persons may make transportation choices more
without a driving license, elderly, disabled, dependent on fuel prices.
impaired, etc.) create more travel. Vehicle occupancy will rise thanks to
More empty backhauls for shared autonomous increased use of ridesharing, microtransit, and
vehicles and ridehailing. public transit.
Shared autonomous vehicles will cause an
increase in vehicle miles traveled as a result of a
substantial modal shift away from public transit.
21You can also read