Market Study Town of Eastham - April, 2021
←
→
Page content transcription
If your browser does not render page correctly, please read the page content below
Town of Eastham
Market Study

April, 2021

Prepared by                           With
Community Opportunities Group, Inc.   Lisa Davis Associates
Contents

Introduction ....................................................................................................................................................................1
Section 1: Land Use Context ..................................................................................................................................3
Section 2: Socio-Economic Profile ......................................................................................................................7
    Economic Profile .........................................................................................................................................................7
    Retail Gap Analysis.................................................................................................................................................. 19
Section 3: Market Trends...................................................................................................................................... 34
    Overview ..................................................................................................................................................................... 34
    Sector Analysis.......................................................................................................................................................... 35
        Tourism, Retail and Amenities ....................................................................................................................... 36
        Trades ...................................................................................................................................................................... 42
        Blue Economy....................................................................................................................................................... 44
        Health & Human Services................................................................................................................................ 47
        Professional Office.............................................................................................................................................. 48
        Entrepreneurial Commercial Space.............................................................................................................. 49
        Community Recreation and Public Spaces................................................................................................ 50
Section 4: Barriers to Commercial Development ..................................................................................... 52
Section 5: Commercial Development Potential ........................................................................................ 55
Appendix 1: Definitions ............................................................................................................................................ 58
Appendix 2: Stakeholder Engagement ............................................................................................................... 61
Introduction
This market study was commissioned by the Town of Eastham as part of an effort to collect and
analyze data to inform the creation of an economic development plan as well as to assist the
Town to determine potential uses for the ‘T-Time property,’ located at 4790 State Highway
Route 6.
The consultants worked with the Town of Eastham Planning Department with input from the T-
Time Development Committee. The consultants carried out a series of focus groups and
interviews with business owners, representatives from local and regional organizations, and
other stakeholders to gather observations about trends, opportunities, and barriers for various
industry sectors. The Town also conducted a survey of business owners to gather input for the
study.
The first section of the report provides an overview of current land use and recent land use
planning efforts related to economic development in Eastham. The second section provides an
economic profile of the community based on a variety of available data sources to describe
Eastham’s population, workforce, economic base, and an analysis of retail leakage and gaps. The
third section focuses on local and regional market trends overall and for each of the industry
sectors important to Eastham. The fourth section identifies barriers that need to be addressed in
order to attract viable commercial development. All of these findings are brought together in
Section 5, which summarizes development opportunities and needs, including commercial land
uses for which there is unmet demand, as well as challenges for expanding these uses in
Eastham’s key sites.
Key Findings
Eastham’s economy is dominated by small local businesses, which is also common to the
Outer Cape. A significant share of Eastham’s businesses are home-based enterprises,
which are scattered throughout the community. Eastham has a relatively high share of
people who are self- employed, typically in fields related to fishing, construction/trades,
property management, professional services, and the arts, many of which tend to be
relatively higher-skilled and higher paying occupations.
Eastham’s economy is also highly dependent upon tourism and seasonal residents. An
analysis of retail spending confirms that Eastham currently functions as a dining and
drinking destination. In terms of the market, there is potential, albeit limited, to expand
commercial space related to retail and accommodations. Many businesses have physical
room to expand, upgrade, or reposition their existing properties. Due to the seasonal
market and other cost factors, it is difficult for the investment to be feasible without
being able to increase the intensity of development.
Town of Eastham Commercial Market Study 1
There is a lack of quality retail oriented to full-time and seasonal residents. With
competition from neighboring communities and a low year-round population density,
the town’s population makes it difficult to support national chains (exclusive of fast-food
franchises). Any new retail will likely be occupied by independent, small scale and locally
owned and operated stores. Retailers would be more likely to thrive in a walkable town
center area, and with events and public realm improvements that highlight their visibility.
Eastham’s “Blue Economy” includes fishing and shell-fishing, seafood wholesalers, natural
resource research and advocacy, water-based recreation, and marine services.
Infrastructure improvements and storage or operational space are needed to enable
commercial fisheries and wholesalers to sustain or expand operations in Eastham. There
is unmet demand for experience-based activities such as recreational boating, cycling,
fitness classes, or youth camps.
There is low commercial vacancy and in fact, a lack of available commercial space or
barriers to expanding building area are more frequent complaints from the local
business community. Trade space, entrepreneurial flex and maker space, and shared
office or retail space would serve the needs of Eastham businesses and entrepreneurs.
The construction and operation of some types of shared facilities would likely require
public sponsorship to be sustainable.
Workforce is a constraint for industries across the board. Cost of living, in particular
housing and childcare, are major barriers to attracting employees. Increasing the supply
of workforce housing is a high priority.
Town of Eastham Commercial Market Study 2
Section 1: Land Use Context
Like neighboring communities on the Outer Cape, Eastham is characterized as a rural,
predominantly residential community. The town is bisected by Route 6, a major four-lane arterial
roadway that runs the length of the Cape. The Cape Cod Rail Trail Bike Path extends from
Dennis to Wellfleet, paralleling Route 6 through Eastham.
Most commercial development is concentrated along Route 6 in North Eastham, between Old
Orchard Road and the Wellfleet town boundary. There are scattered commercial properties
along the length of Route 6, with a small concentration near Town Hall toward the southern end
of the town and at the intersection of Route 6 and Brackett Road. As noted above, there are also
a substantial number of home-based businesses scattered throughout the community, as well as
water-based commercial activities operating from Rock Harbor and several designated launch
sites and aquaculture areas.
Infrastructure
All of Eastham is dependent on private wastewater and septic systems. Due to the sensitivity of
Eastham’s natural resources, environmental regulations are a limiting factor for development of
both residential and commercial uses. A Zone 2 groundwater protection area covers most of the
business area in North Eastham.
In 2015 the Town authorized design and construction of a $130M public water supply system
throughout Town. Previously all residential and commercial development in Eastham relied
solely on private wells for their water supply needs, thereby constraining both the type and
amount of development that could be built out. Completion of the Town water system has
increased development potential and spurred new interest in development.
A fiberoptic network was launched in 2013 by nonprofit OpenCape, providing high speed
internet access serving the Cape & Islands and Southeastern Massachusetts. Currently the open
access network serves primarily institutions and government entities. For individual residents
and businesses, the cost of connecting to the fiberoptic network is prohibitively expensive,
especially at farther distances from the trunk which runs along Route 6.
Recent and Anticipated Development
Few larger scale residential developments have been constructed within the past decade or are
anticipated to be developed in Eastham.
The Village at Nauset Green is a 65-unit rental community located on the Campbell-
Purcell property in North Eastham, completed in 2020. The development includes
workforce and affordable housing options, with one-, two-, and three-bedroom
apartments.
Town of Eastham Commercial Market Study 3
A 20-unit townhouse development is undergoing permitting and preliminary site work.
Cedar Banks Landing will provide market rate homes in the $600,000 price range.
There are also three marijuana facilities in the permitting process, including Salty Farmers, which
is a proposed 2,000 square foot cultivation and retail facility, as well as Emerald Grove, which will
provide both a retail marijuana establishment and a medical marijuana dispensary.
Prior Studies
Eastham has undertaken considerable planning over the past fifteen years relating to land use,
economic development, and zoning.
The North Eastham Village Center Strategic Report & Concept Plan (2007) provided a
market analysis and concept plan for a village center in North Eastham focused on the
Purcell property and other potential redevelopment sites. The study highlighted
potential for the T-Time property to be redeveloped for mixed use including limited
commercial, workforce housing, and senior housing.
The Comprehensive Plan (2010) articulated community goals and needs with respect to
land use, growth management, natural resources, community facilities, economic
development, and affordable housing.
The Urban Land Institute Technical Assistance Panel (TAP) Report (2017) provided an
analysis of assets, challenges, development potential and economic feasibility for North
Eastham given the recent availability of Town water.
The North Eastham District Local Technical Assistance (DLTA) Report (2018) built on the
TAP report to offer recommended zoning changes to meet the Town’s goal to facilitate
cohesive, village-style development.
The Town of Eastham Strategic Plan (FY2020-2024) identified overarching principles,
goals and strategies, focusing primarily on supporting a clean environment, well-
designed development, quality of life, and transportation safety. The Strategic Plan also
provided strategies and priorities relating to economic development.
The Town of Eastham Harbor & Waterways Management Plan (2020) provides an
analysis of existing recreation and commercial activities on Eastham’s waterfront, as well
as the capacity and quality of the existing infrastructure to accommodate desired usage
while protecting the natural environment.
A Route 6 Corridor Study is ongoing, aiming to identify potential improvements to safety
and traffic circulation for Eastham residents and businesses.
Zoning
Based on the recommendations of the strategic planning described above, the Town has
undertaken zoning initiatives to facilitate mixed use development and the establishment of a
town center. The North Eastham Village Overlay District was adopted at Town Meeting in 2014.
The intent of the overlay district was to encourage mixed-use development in the commercially-
Town of Eastham Commercial Market Study 4
zoned area. As of 2018 when the DLTA report was prepared, there had yet to be any new
development that utilized the overlay district zoning.
In 2017 the North Eastham commercial area was designated a District of Critical Planning
Concern (DCPC) under Section 10(a) of the Cape Cod Commission Act, and in 2018 the Town
adopted regulations guiding development within the DCPC. These regulations provide for five
commercial zoning districts:
Core Commercial (CC) promotes a compact vibrant commercial center with small
setbacks from the street, small-scale commercial uses and accessory residential uses.
Transition Commercial (TC) allows small-scale commercial and residential uses, more
modest setbacks on Route 6, and sharing of a single curb cut.
Office/Residential (OR) allows a mix of residential and compatible low-intensity
commercial uses following traditional residential development patterns with no direct
access to Route 6.
Limited Commercial (LC) allows for low-intensity commercial uses in a predominantly
residential area with a shared Route 6 curb cut.
Trade Park (TP) focuses on industrial and trade uses.
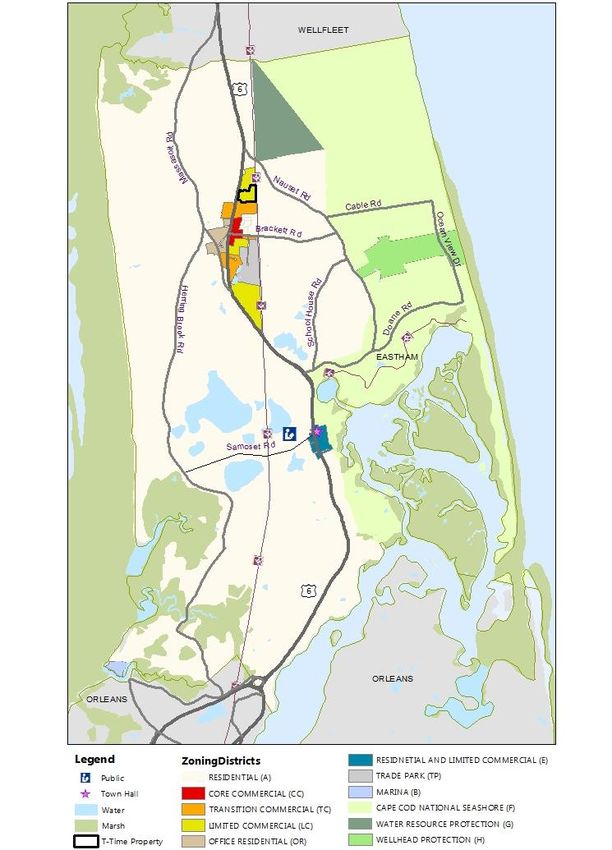
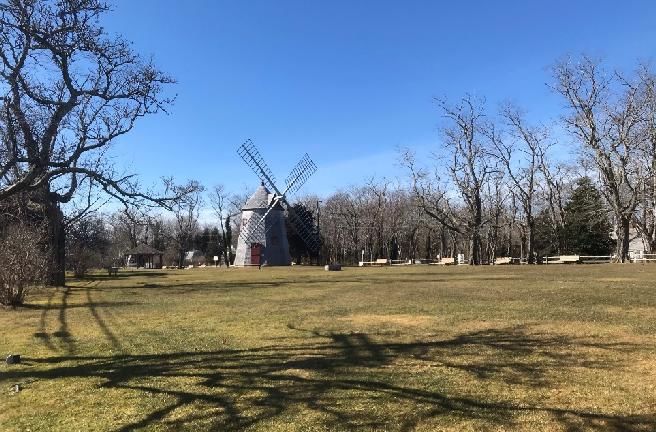
T-Time Site
In 2019 the Town purchased the
former T-Time golf driving range, an
11-acre parcel located in North
Eastham on Route 6, bordering the
Cape Cod Rail Trail. The location of
site is just outside of the area that
has been identified as the core of a
potential village center in prior
planning studies (2007 North
Eastham Village Concept Plan and
2018 DLTA Report). It is currently
zoned for Limited Commercial. (See T-Time Property
Map 1.)
The T-Time Development Committee was appointed for the purpose of evaluating potential
uses of the site to identify the highest and best uses, and to develop a plan for the site that
reflects the ideas and values of the community.
Town of Eastham Commercial Market Study 5
Map 1: Context

             Prepared by Community Opportunities Group, Inc.   Source: MassGIS

Town of Eastham Commercial Market Study                                          6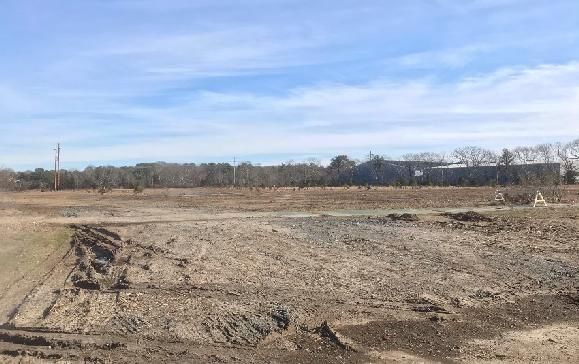
Section 2: Socio-Economic Profile
This report primarily cites publicly-available data from the US Census, American Community
Survey (ACS), State, and local sources, as well as proprietary data sources including Banker &
Tradesman and ESRI. Varying levels of detail make each source valuable for comparing different
aspects of the economy; however, as they employ substantially different methodologies there
are differences in the results, for example the numbers of businesses or employees that are
reported. The report also provides qualitative information obtained through interviews and
focus groups with local professionals, business owners, government officials, and advocates who
support economic development activities in the Town and region. Data for the Retail Gap
Analysis is provided by ESRI.

Economic Profile
Demographics
Like many communities on Cape Cod, particularly among the outer Cape towns, Eastham has
high seasonal variability in population. By ACS estimates, over 60 percent of Eastham’s housing
units are seasonally occupied, compared with 38 percent throughout all of Barnstable County.
Consistent with this estimate, 60 percent of residential property owners in Eastham’s Assessor’s
database list a primary address outside of Eastham. The Market Analysis will consider the town’s
year- round population, as well as available data to characterize the part time or seasonal
population and visitors or tourists.
                                                                        Table 1:
Year-round population peaked in 2000
                                          Housing Units               Eastham             Barnstable County
and fell by 22 percent between 2000
                                          Owner Occupied              2,173   35%         74,410      46%
and 2010, but appears to have leveled     Renter Occupied             223     4%          20,007      12%
off in the past ten years. The Donohue    Seasonally Occupied         3,818      61%      60,531         38%
Institute projected continued decline     Other Vacant                75         1%       6,363          4%
by 9 percent between 2010 and 2020,       Total Units                 6,289      100%     161,311        100%
but the 2019 ACS estimated only a 1                                                Source: ACS 2015-2019
percent decline over this period.
                                            Figure 1: Population Projections for Eastham
Figure 2 shows historic and projected       6000
population trends by age cohort.
                                            5000
While the total population remained
stable between 2010 and 2019, the           4000

share of older adults increased while       3000                                                     US Census
the share of young adults and school-       2000                                                     ACS (2019)
aged children declined. The shift in
                                            1000                                                     Donohue
age profile is expected to continue                                                                  Institute
over the coming decade. However, as            0
                                                    1990       2000       2010     2019       2020        2030
of 2019 the loss of school-aged
                                                           Source: US Census, ACS (2019), Donohue Institute

Town of Eastham Commercial Market Study                                                                           7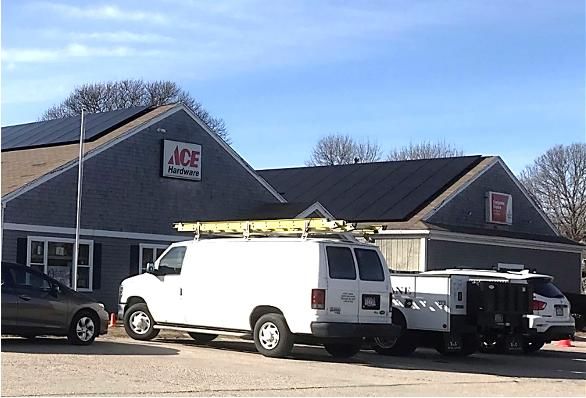
children and younger adults has not been as pronounced as was projected for 2020.

                             Figure 2: Eastham Historic & Projected Population by Age Cohort
   6,000
                                                                                      Projections            Ages
   5,000
                                                                                                               0-19
   4,000
                                                                                                               20-34

   3,000                                                                                                       35-49

   2,000                                                                                                       50-64

   1,000                                                                                                       65-79

      0                                                                                                        80+
                   2000               2010                2019               2020               2030
                                                                  Source: US Census, ACS (2019), Donahue Institute

Local sources reflect ACS data. According to the Town Census, Eastham’s population declined by
about 200 people between 2014 and 2018 but has been rising in the past couple of years, even
before the change in dynamics brought on by the COVID-19 pandemic. School enrollment in
Eastham Elementary School declined between 2010 and 2015 but has increased or held steady
through the past five years. Overall enrollment in the regional high school (which includes
Eastham, Brewster, Orleans, and Wellfleet) declined steadily between 2010 and 2020.

                                         Figure 3: Town Census Population
           5,400

           5,200

           5,000

           4,800

           4,600

           4,400
                      2014       2015        2016        2017       2018       2019      2020       2021

                                              Table 2: School Enrollment
                                             2009/2010           2014/2015     2019/2020        2020/2021
           Eastham Elementary (Pk-5)         225                 182           194              194
           Nauset Regional High (6-12)       1,535               1,515         1,480            1,426
                              Source: Massachusetts Department of Elementary and Secondary Education

Households living in Eastham tend to be smaller and have a different age composition than
statewide or Barnstable County as a whole. Although a similar proportion are families, fewer
households have children under age 18, while a substantially higher proportion include seniors

Town of Eastham Commercial Market Study                                                                                8
over age 60. Nonfamily households include individuals living alone, unmarried partners,
roommates, or other nonfamilial living situations. The share of individuals living alone is
comparable to the state and county, but a higher proportion are seniors over the age of 65,
reflecting a disproportionately older population overall, as shown in Table 3. The proportion of
households with children has increased since 2010, as has the share of households with seniors.
(In most cases these changes in household characteristics are within the margin of error for the
ACS sample methodology.)
Table 3: Household Composition
Average With
Nonfamily Individuals Seniors 65+ With Seniors
Household Families Children
Households Living Alone Living alone over 60
Size under 18
Eastham (2010) 2.03 63% 37% 32% 18% 10% 64%
Eastham (2019) 2.05 64% 36% 29% 22% 15% 67%
Barnstable County 2.23 63% 37% 31% 18% 20% 59%
Massachusetts 2.52 63% 37% 29% 12% 29% 40%
Source: ACS Five-Year Estimates 2006-2010, 2015-2019
Table 4: Social Characteristics Eastham’s population is
Barnstable overwhelmingly White.
Eastham MA
County
Residents who identify as other
Race/Ethnicity
White, not Hispanic 91.5% 89.3% 71.6% races or Hispanic/Latino
Asian 3.1% 1.5% 6.6% comprise less than 10 percent of
Black 1.7% 2.9% 6.9% the Town’s population, and less
Other 2.9% 3.3% 3.0%
than 10 percent of Eastham
Hispanic/Latino (any race) 0.9% 3.1% 11.8%
Immigration/Language residents immigrated from
Born in US 92.5% 93.0% 84.7% someplace outside of the United
Foreign born 7.5% 7.0% 15.3% States.
Limited English-Speaking NA 1.4% 6.0%
Educational Attainment Eastham has a highly educated
High School Graduate or Higher 97.9% 95.5% 90.8%
workforce. Eastham residents
Bachelor's Degree or Higher 50.6% 43.4% 43.7%
are more likely to have
Source: ACS 2013-2017 (NA = Not Available)
completed high school or to
have attained a college degree than the state or Barnstable County. On the whole, most
residents of Barnstable County have obtained at least a high school diploma.
Town of Eastham Commercial Market Study 9Part Time/Seasonal/Visitor Population
Limited data is available to capture seasonal fluctuations in population. Recent studies have
estimated Eastham’s summertime population at 20,000 to 25,000.1 This includes year-round
residents, seasonal or part-time residents, and tourists.
Housing Market Highlights
By ACS estimates, about 35 percent of housing units are occupied by homeowners
year round, while 4 percent are occupied by renters. Renter housing comprises 9
percent of all year-round occupied housing, while 91 percent are owner-occupied.
Throughout Barnstable County, 58 percent of housing units are occupied year round,
of which 21 percent are renter-occupied and 79 percent are owner-occupied.
The majority (95 percent) of Eastham’s housing are single family homes; only 5 percent
of housing is in multifamily structures with 2 or more units.
Home prices in Eastham have increased by 30 percent in the past five years; the
median sales price for single family homes was $520,000 in 2020.
By many observations, demand for home sales in Eastham rose dramatically in 2020.
Banker & Tradesman reported 194 single family homes sold in 2020, while the number
of homes sold in the previous five years hovered around 150 homes per year.
According to local MLS data, 20 percent of homes in Eastham sold over list price in
2020, compared with 7 percent in 2019.
Condos are much less expensive, with a median sales price of $273,000 in 2020,
However, condos are also less available, with an average of 16 sold per year over the
past five years.
Figure 4: Home Sales Prices
Barnstable County Single Family Condo
$600,000
Eastham Single Family Condo
$500,000
$400,000
$300,000
$200,000
$100,000
$0
2000 2001 2002 2003 2004 2005 2006 2007 2008 2009 2010 2011 2012 2013 2014 2015 2016 2017 2018 2019 2020
Source: Banker & Tradesman
1
North Eastham Village District study, 2007; Town of Eastham Harbor & Waterways Management Plan, 2020; and
Town of Eastham Strategic Plan, 2019
Town of Eastham Commercial Market Study 10As shown previously in Table 1, over 60 percent of Eastham’s housing is seasonally occupied.
Some are second homes whose owners live in Eastham for part of the year and in a different
locale the remainder of the year. Many second homeowners rent out their properties to visitors
while they are not in use. There are also many seasonally-occupied homes that are exclusively
rented.
COVID-19 had a profound impact on seasonal home occupancy throughout the Cape. Many
second homeowners relocated to their Eastham homes to access more outdoor space and
natural environment, while there was an unprecedented ability to work remotely. It is impossible
to anticipate how many households who relocated to Eastham to stay in the off-season during
the pandemic will remain in town after this year. There will likely be some influx of working-age
residents living full time in town, bringing jobs with them that can be done remotely. The Cape
Cod Commission plans to conduct a homeowner’s survey in 2021 to better understand the
potential increase in the region’s population from people who migrated to Cape Cod in 2020,
and whether the impacts are short term or can be anticipated to continue for the long term. 2
Income and Employment
Eastham’s median household income is slightly below the median for Barnstable County and the
state. Eastham, along with other communities on the Cape, has experienced a slightly lower rate
of income growth over the past 10 years than the state overall. There is significant income
disparity among different types of households; the median for Eastham families is $88,950,
compared with $38,798 for nonfamilies (a large portion of whom are seniors living alone).
Table 5: Median Household Incomes
Median Income Median Family Median Nonfamily Change in Household
All Households Income Income Income since 2010
Eastham $72,075 $88,950 $38,798 23%
Barnstable County $74,336 $93,335 $44,840 23%
Massachusetts $81,215 $103,126 $46,467 26%
Source: ACS 2015-2019
There is also income Table 6: Household Income by Age of Householder
disparity by age of Eastham Barnstable County
household. Eastham Median Median
Households % Households
Income Income
has few households
15 to 24 years 50 2% - 1% $50,893
headed by young 25 to 44 years 276 12% $95,305 18% $78,666
adults (under age 45 to 64 years 822 34% $69,531 39% $89,457
24) hence income 65 years & over 1,248 52% $71,926 43% $63,109
data is not available Source: ACS 2015-2019
on the Town level. Across Barnstable County this group has the lowest median household
income. Middle aged households typically have higher incomes, as is true for Barnstable County.
2
“Mass Exodus,” Cape & Plymouth Business Magazine (March 2021)
Town of Eastham Commercial Market Study 11In Eastham, households headed by seniors (comprising over half of Eastham’s households) have
incomes comparable to working age adults in the 45-64 cohort.
Due to having a larger concentration of residents who are of retirement age, Eastham has a
relatively low workforce participation rate. Half (50 percent) of percent of Eastham’s population
over age 16 are in the workforce compared with 67 percent statewide, or 60 percent for
Barnstable County. This includes residents who are employed or report themselves to be
unemployed and seeking employment.
Figure 5: Unemployment Rates
Barnstable County
14%
Eastham
12%
10%
8%
6%
4%
2%
0%
2010 2011 2012 2013 2014 2015 2016 2017 2018 2019 2020
Source: MA Executive Office of Workforce & Labor Development (EOWLD)
Eastham has historically had higher rates of unemployment than the rest of Barnstable County,
however, unemployment rates for Eastham had declined from a peak of 10.9 percent in 2010 to
a low point of 3.0 percent in March of 2020, after which the pandemic caused an abrupt
disruption of the economy throughout the region and across the country. The monthly average
throughout all of 2020 was 12 percent, with the rate of unemployment reaching a height of 17.8
percent in June of 2020.
Table 7: Occupations of Residents in the Region (2011) According to ACS, the largest
Barnstable share of Eastham residents, 41
Eastham
County percent, work in business,
Labor Force 2,146 105,715 science, management, and arts
Business, science, management, & arts 41% 38% occupations, exceeding the share
Natural resources, construction, and for Barnstable County. About 10
10% 11%
maintenance
Production, transportation, and material percent of Eastham residents
7% 8%
moving work in natural resources,
Sales and office 23% 22% construction, and maintenance
Service 18% 21%
occupations.
Source: ACS 2015-2019
By industry of employment
(shown in Table 8), the largest share of Eastham residents are employed in industries that may
Town of Eastham Commercial Market Study 12be related to tourism, including retail, restaurants & hospitality, arts, entertainment, and
recreation. This is a higher concentration than workers throughout Barnstable County. The next
largest sources of employment are in education, health care and social services, as well as
professional, scientific, and administrative fields.
Table 8: Industry of Employment for Eastham Workforce*
Barnstable
Major Industries Eastham
County
Total Employees 2,146 105,715
Agriculture forestry fishing hunting mining 3% 1%
Construction & Manufacturing 8% 14%
Retail, Restaurants & Hospitality, Arts, Entertainment & Recreation 32% 25%
Professional scientific management administrative waste service information 14% 14%
Finance & Insurance, Real Estate & Leasing, Professional & Technical Services,
8% 6%
Management & Admin
Education, Health Care & Social Services 21% 24%
Wholesale trade, Transportation & Warehousing, Information, Other Services 3% 6%
Other services 6% 5%
Public Administration 5% 5%
* Note: Data describes the primary employment self-reported to ACS by a sample of Eastham residents.
Respondents may not report informal or secondary sources of income.
Source: ACS 2015-2019
A relatively large share of Eastham residents are self-employed, particularly in occupations
related to construction, maintenance, and natural resources (i.e., fishing, shellfishing agriculture,
or mining/extraction), and arts and professional occupations. Compared to the state or county,
Eastham residents are less likely to be employed in private nonprofit organizations or to be
employees of private companies. ACS (2019) estimated 407 Eastham residents earned self-
employment income (17 percent of the workforce).
Town of Eastham Commercial Market Study 13Table 9: Occupation by Class of Worker
Self-employed Self-employed
Employee Private Local, state
Eastham in own in own not
of private Not for & federal
Workers incorporated incorporated
company Profit government
business business
Management, business,
888 39.8 9.8 12.4 23 15.1
science, and arts
Natural resources,
223 47.5 5.4 0.0 3.6 43.5
construction, and maintenance
Production, transportation,
149 100.0 0.0 0.0 0.0 0.0
and material moving
Sales & office 500 72.4 8.4 3.4 10.4 5.4
Service 386 68.7 0.0 4.4 13.0 14.0
Eastham Total 2,146 57.5 6.6 6.7 14.6 14.5
Barnstable County Total 59.7 5.7 10.6 12.2 11.9
State Total 66.3 2.9 12.9 12.1 5.9
Source: ACS 2015-2019
Table 10: Mean Travel Time to Not surprisingly given the town’s geographic location and the
Work (2019) economy of the outer Cape, Eastham residents travel farther on
Geography Minutes average to get to work than residents of neighboring
Provincetown 19.1
communities.
Truro 19.3
Wellfleet 23.8
Table 11 shows the top communities in which Eastham residents
Eastham 26.7
Orleans 22.6 work, as well as the communities in which people who work in
Brewster 22.3 Eastham live. The largest share of Eastham residents have jobs
Harwich 19.5 located in Orleans or other communities in the Mid to Outer
Dennis 24.4 Cape. About 14 percent of Eastham residents are employed in
Barnstable County 23.9
Eastham, while 25 percent of Eastham jobs are held by Eastham
Source: ACS 2015-2019 residents.
Table 11: Journey to Work
Where Eastham Residents Work Number Where Eastham Workers Live: Number
Orleans 15% Eastham 25%
Eastham 14% Brewster 11%
Barnstable 7% Harwich 10%
Wellfleet 6% Orleans 10%
Boston 5% Yarmouth 8%
Provincetown 5% Barnstable 6%
Brewster 4% Wellfleet 4%
Harwich 3% Dennis 3%
Chatham 3% Chatham 2%
Dennis 3% Sandwich 1%
All other locations 36% All other locations 19%
Total 100% Total 100%
Source: US Census On The Map 2018
Town of Eastham Commercial Market Study 14Economic Base
Eastham is a predominantly residential community, with a small economic base relative to the
size of its workforce. As shown in Table 12, there are 0.41 jobs per resident member of the labor
force. Among nearby communities, Orleans is an employment center, hosting 1.39 jobs per
resident member of the workforce.
Table 12: Jobs to Labor Force Ratio
Geography Labor Force 12/20 Jobs 1st Quarter 2020 Jobs: Labor Force Ratio
Provincetown 2,027 1,729 0.85
Truro 1,198 458 0.38
Wellfleet 1,617 785 0.49
Eastham 2,428 1,004 0.41
Orleans 2,648 3,689 1.39
Brewster 4,739 2,237 0.47
Harwich 5,690 3,454 0.61
Dennis 6,171 4,113 0.67
Barnstable County 104,041 85,907 0.83
Source: MA Executive Office of Labor and Workforce Development (EOLWD). December 2020
The following tables show the number of establishments, employment, and average weekly
wages for Eastham and Barnstable County. Employment and Wage data are derived from
reports filed by all employers subject to unemployment compensation laws, which excludes
some small businesses or self-employed workers. Data is not published for industries in which
the small number of businesses would compromise confidentiality. Among businesses that are
reflected in this data, the largest industry in Eastham in terms of both the number of
establishments and the total number of jobs they provide is construction, closely followed by
accommodation and food services. Retail trade and education, health care, and social services
also form a significant part of the town’s economic base.
A community’s Location Quotient3 (LQ) is a ratio of the concentration of jobs in the community
compared with the larger region of which it is a part. Table 13 shows the LQs for Eastham
compared with Barnstable County and with the state. A larger share of jobs in accommodation,
food services, arts, entertainment, and recreation reflect the importance of the tourism
economy. The Town also has a high concentration of jobs in construction compared to the state,
which combined with a relatively high share of jobs in administrative and waste services,
underscores the prominence of building trades and property maintenance as economic drivers
in Eastham. Finally, a relatively strong presence of wholesale trade and transportation and
warehousing are primarily related to businesses that support the blue economy (commercial and
3
Words highlighted in pink throughout the report are defined in Appendix 1.
Town of Eastham Commercial Market Study 15sport fishing and other marine-related enterprises) and other commercial activity in Eastham
and the surrounding region.
Table 13: Employment and Average Weekly Wage by Industry * (2019)
Eastham Barnstable Town to
Town to
Industry Establish- # of % County County
State LQ
ments Empl. Empl. % Empl. LQ
Goods-Producing 49 276 22% 10% 2.23 1.84
Construction 43 265 21% 7% 2.92 4.34
Natural Resources and Mining Not Available 0%
Manufacturing Not Available 2%
Service-Providing 147 994 78% 90% 0.87 0.89
Wholesale Trade 5 39 3% 2% 1.87 0.90
Retail Trade 21 123 10% 16% 0.62 1.00
Transportation & Warehousing 6 49 4% 3% 1.49 1.23
Finance & Insurance 3 21 2% 2% 0.70 0.35
Real Estate, Rental & Leasing 6 18 1% 1% 0.98 1.06
Professional & Technical Services 19 42 3% 5% 0.68 0.34
Administrative & Waste Services 17 68 5% 4% 1.23 1.03
Education, Health Care & Social 14 152 12% 25% 0.48 0.43
Arts, Entertainment & Recreation 6 77 6% 4% 1.55 3.18
Accommodation & Food Services 31 241 19% 17% 1.14 2.18
Other Services 10 54 4% 4% 1.10 1.26
Total/Average 196 1,270
* Note: Employment and Wage data are derived from reports filed by employers subject to unemployment
compensation laws, which excludes some small businesses or self-employed workers.
Rows highlighted in red denote industries for which Eastham has a relatively high concentration.
Source: MA EOLWD, ES202
Shown in Table 14, average wages are lower in Eastham than across all of Barnstable County in
almost every industry with the exception of accommodation and food service and other services,
where Eastham employers pay slightly above average for the County. Eastham has a
concentration of lower wage jobs; about 58 percent of Eastham’s jobs are in industries whose
average wages are below $50,000 per year. Higher paying jobs include construction, wholesale,
finance & insurance, and professional & technical assistance.
Town of Eastham Commercial Market Study 16Table 14: Employment and Average Weekly Wage by Industry (2019)
Eastham Barnstable County
Industry Establish- # of % Average Average Annual
ments Empl. Empl. Annual Wages* Wages
Goods-Producing 49 276 22% $57,304 $63,700
Construction 43 265 21% $58,084 $63,492
Natural Resources and Mining Not Available $53,508
Manufacturing Not Available $65,780
Service-Providing 147 994 78% $40,768 $48,516
Wholesale Trade 5 39 3% $54,236 $67,600
Retail Trade 21 123 10% $28,704 $34,632
Transportation & Warehousing 6 49 4% $52,052 $49,556
Finance & Insurance 3 21 2% $72,904 $96,876
Real Estate, Rental & Leasing 6 18 1% $36,920 $44,512
Professional & Technical Services 19 42 3% $67,236 $74,828
Administrative & Waste Services 17 68 5% $45,292 $47,996
Education, Health Care & Social 14 152 12% $35,828 $56,628
Arts, Entertainment & Recreation 6 77 6% $23,816 $33,020
Accommodation & Food Services 31 241 19% $29,640 $28,756
Other Services 10 54 4% $41,184 $39,988
Total/Average 196 1,270 $44,356 $50,024
* Note: Average wage derived from annualized Average Weekly Wages
Rows highlighted in red denote industries in which the average annual wage for Eastham-based jobs is greater
than $50,000 per year.
Source: MA EOLWD, ES202
While still relatively low, Table 15: Average Annual Wage
wages have grown faster Eastham Barnstable County Massachusetts
in Eastham over the past 2014 Total All Industries $35,516 $42,588 $64,116
five years compared with 2019 Total All Industries $44,356 $50,024 $75,504
Barnstable County and Change 2000-2010 25% 17% 18%
the state. Source: MA EOWLD, 2019, 2014
While state data allows for comparison of industry concentration and wages, local data provides
a clearer picture of the business community in town, as many small businesses are not captured
in the above data set. (This list is still not comprehensive, as many self-employed individuals may
be engaged in the economy without being registered as businesses.) As of January 2021, there
are 325 businesses registered in the Town of Eastham.4
4
Town of Eastham Business Registration Database, December 2020
Town of Eastham Commercial Market Study 17 By far, the largest share of Table 16, Registered Businesses in Eastham
Eastham-based businesses are Grand % of % home
related to construction and Row Labels Total total based
maintenance of homes and Home/property services 78 24% 71%
properties, comprising 37 Building/Construction 41 13% 83%
Accommodations 33 10% 64%
percent, combined. These
Arts/Creative 28 9% 86%
include building trades, repair
Restaurant/Food service 25 8% 8%
and home improvement,
Retail 20 6% 30%
landscaping, cleaning, waste
Real Estate/Property Management 18 6% 28%
management, etc., and are
Professional service 18 6% 83%
predominantly home-based. Also Fishing/Marine 12 4% 67%
somewhat related are real estate Auto 11 3% 36%
and property management Personal care 10 3% 30%
businesses, which constitute Recreation 10 3% 30%
another 6 percent. Grocery/Liquor 8 2% 0%
The second largest cluster is Healthcare 5 2% 40%
related to the tourism economy. Industrial 3 1% 0%
These include accommodations, Other Service 3 1% 33%
restaurants, retail, and recreation, Agriculture 1 0% 100%
which combined make up about Nonprofit/Institutional 1 0% 0%
Grand Total 325 100% 57%
one quarter of registered
Source: Town of Eastham Registered Businesses List, 12/17/2020
businesses. These businesses are
less likely to be home-based.
A third significant cluster is arts/creative and professional services, which are predominantly
home-based enterprises. These include artists, designers and performers, as well as
consultants, accountants, lawyers, and other types of professional specializations.
There are 12 registered businesses (4 percent) specifically related to the town’s marine
resources including commercial fishing, rental or charter boats, and boat building and repair.
Some businesses that are identified as retail, food service, or recreation are also directly
engaged with fishing and water resource-based activities.
There are 122 commercial properties listed in Eastham’s Assessor’s Database with a total of
530,000 square feet of space. The largest share of commercial property is classified as “mixed
use”, having a combination of residential and some form of commercial use. Of stand-alone
commercial uses, motels comprise the largest share in terms of land area, building area, and
property valuation. Eleven properties classified as motels have an average of 12,000 square feet
of building area. Most other types of commercial spaces are fairly small; retail, restaurant, auto
uses, and commercial/industrial flex space buildings classified as “storage” average 3,000 to
4,500 square feet of building area.
Town of Eastham Commercial Market Study 18Table 17: Commercial Space
Total Average Average
Total Building Area Building value per Average value
Properties Total Acres Valuation square feet Area acre per sf
Auto 5 4.3 $ 3,167,600 18,912 3,782 $757,164 $69
Fitness 1 9.6 $ 3,155,800 87,754 87,754 $328,695 $10
Mining 2 36.1 $751,300 200 100 $24,715 N/A
Mixed 60 151.3 $50,285,800 143,554 2,393 $650,107 $213
Motel 11 35.3 $17,741,500 131,816 11,983 $568,230 $297
Office 12 6.3 $ 4,516,100 22,212 1,851 N/A $103
Restaurant 8 10.9 $5,427,900 33,671 4,209 $567,979 $83
Retail 9 12.7 $5,183,000 27,577 3,064 $541,933 $106
Storage 14 11.2 $ 5,658,800 63,937 4,567 $510,090 $41
Total 122 277.7 $95,887,800 529,633 4,341 $345,359 $181
Source: Eastham Assessor’s Database, FY 22
As noted in the DLTA Report, the majority of commercial structures are modest sized and older.
Mostly built before 1990, most commercial structures are nearing the end of their useful life of
20-30 years. The average footprint of commercial buildings in Eastham is less than 5,000 square
feet. There are also numerous parcels that could support additional commercial development
under current zoning. 5 In a field analysis for this study very little vacancy was observed in
commercial buildings.
Retail Gap Analysis
A Retail Gap Analysis examines retail leakage (gaps in current retail market), and retail business
potential. The study provides a foundation of data to better understand the town’s retail
industry and identify potential retail needs and opportunities. The leakage analysis compares
resident spending to local and regional retail business sales to identify specific retail categories
in which residents are leaving the area to spend money (resulting in a retail leakage), or
alternatively, where people from outside of the area are coming to shop at local businesses
(creating a retail surplus). The retail potential analysis examines the number of retail businesses
in those categories with leakage that may be able to be supported in Eastham if some of the
retail spending is recaptured along with spending from tourists.
This analysis utilizes data from ESRI Business Analyst – a leading provider of demographic and
business data. ESRI uses publicly accessible data along with proprietary statistical models to
generate estimates for present day (2020). It should be noted because ESRI provides estimates,
the data is not considered to be 100% accurate.
5
North Eastham District Local Technical Assistance (DLTA) Report, 2018
Town of Eastham Commercial Market Study 19The analysis considers consumer spending and supply and demand for 27 spending categories.
The categories are based upon the North American Industry Classification System (NAICS) codes
which classify businesses by their primary type of economic activity. The BLS (Bureau of Labor
Statistics) began using NAICS in 1997 in lieu of Standard Industrial Codes (SIC’s). The categories
used in this study are based upon 3- and 4-digit NAICS codes. It should be noted that many
retailers fall under multiple categories but are given the NAICS code that describes their primary
economic activity. For this analysis, automobile dealerships, gasoline stations, department stores
and grocery stores were not considered appropriate or desirable for Eastham and therefore
were not discussed in detail. A detailed description of the retail categories and examples of
business in each of these categories is included in Appendix 1.
Geographies Used in Analysis
Three geographies were selected for analysis to examine specific retail concentrations. The
geographies in the analysis include the Town of Eastham and two trade areas defined by a five-
mile and ten-mile radius from the T-Time Property (4790 State Highway Route 6).
These are discussed below and shown on the map on the following page.
Town of Eastham: The town’s boundaries form this area of analysis.
Primary Trade Area: The primary trade area (PTA) is defined as the area in which
approximately 80% - 85% of the customers of a given retail outlet reside. The PTA is
determined by a variety of factors including drive times, walking distances, natural or
manmade barriers such as rivers and highways and distance to other retail facilities. In
general, for convenience shopping one should be able to drive to the site in no more
than ten minutes. However, one must also take into consideration the proximity of other
retail facilities. For example, residents that live in the southern edge of the trade area
may find it more convenient to shop in Orleans and residents of the northern edge of
the trade area may find it more convenient to shop in Provincetown. For the purposes of
this analysis, the primary trade area (PTA) has been defined as a five-mile radius which
includes the entire town of Eastham and extends to Orleans to the south and Wellfleet
to the north. The PTA is a relatively small area given the proximity of retail facilities in
Orleans and Provincetown and the limited roadway network.
Secondary Trade Area: The Secondary Trade Area is defined as the area in which
approximately 10-15% of the customers of a given retail outlet reside. For this analysis,
the secondary trade area has been defined as a ten-mile radius which includes the
towns of Truro and Brewster.
Town of Eastham Commercial Market Study 20Map 2: Trade Area
Secondary Trade Area,
10 Mile Radius
Primary Trade Area,
10 Mile Radius
1 Mile Radius
Town of Eastham Commercial Market Study 21Consumer Characteristics
This section examines the key sociodemographic characteristics of the consumer households
within each trade area. It also examines consumer spending patterns and behaviors and
identifies the major consumer segments to help understand the retail potential in Eastham.
Demographic data can be particularly useful in the development of a retail strategy due to the
well-defined customer bases that some retailers have identified. This section will document the
demographic findings for the town of Eastham and the Primary Trade area.
Table 18 summarizes the demographic and income trends discussed in the section above.
Figures are shown for the Primary Trade Area, Secondary Trade Area and the Town of Eastham.
Table 18, Trade Area Demographics
Primary Trade Area Secondary Trade Area Eastham
Population 8,591 24,825 5,377
Number of Households 4,121 11,770 2,577
Median Disposal Income $51,915 $53,843 $53,632
Per Capita Income $44,784 $47,636 $45,414
Median Age 59.9 58.7 59.8
Source: ESRI
Retail Leakage Analysis
A retail leakage analysis is a statistical tool to help understand the retail dynamics in a certain
geography. It is commonly referred to as a retail “gap” analysis because it identifies gaps in the
retail market where demand for retail goods and services in a specific category is not being
satisfied by the existing retail businesses in that geography (i.e., sales are leaking out of the
geography).6 Supply (retail sales) estimates sales to consumers by establishments. 7 Demand
(retail potential) estimates the expected amount spent by consumers at retail establishments.
The analysis compares the estimated spending of households located in a given geography
(demand) with actual sales at retail businesses within that same geography (supply). “Estimated
spending,” or demand, is a figure that includes all retail spending by households, including at
local retail establishments as well as elsewhere in the region and online. Actual sales at retail
businesses within the geography include all sales, whether to local residents or not, thus
indicating the total supply provided to all customers. Retail leakage (gap) is calculated as
demand minus supply. Therefore, a positive retail gap indicates that demand exceeds supply
6
The data used is for 2017 from Infogroup, Inc. Supply and demand estimates are in current dollars. ESRI uses the
North American Industry Classification System (NAICS) to classify businesses by their primary type of economic
activity.
7
Sales to businesses are excluded, although many businesses responded in the Survey that they do business with
other local establishments, whenever possible. Some business-to-business sales, such as independent contractors
patronizing the Eastham Ace Hardware Store, are likely captured in the consumer sales estimates.
Town of Eastham Commercial Market Study 22within the geography, and consumers are leaving the area (or going online) to purchase goods and services in that category. It may be possible to recapture some of that spending in a given geography, and this is discussed further in the following section. A negative retail gap indicates a net inflow of spending in a retail category within a given geography. Therefore, a negative retail gap indicates that supply exceeds demand from within the geography, indicating that customers are coming from outside the geography. This is common when there is a significant retail destination that attracts shoppers from outside of the geography being examined. The negative gap is the amount of money that residents from outside the community spend in that geography. The retail leakage analysis was performed for each of the geographies. A summary of the retail leakage analysis is provided below. A more detailed breakdown by category for each geography is provided as well. Summary The Town of Eastham has a net overall retail leakage of $59 million annually. Much of this leakage is being captured by businesses just outside of town. The leakage represents the amount of retail spending by town residents that occurs at businesses outside of town (or online). That $59 million figure amounts to 50% of all Eastham’s residents’ retail spending. (Total retail spending by Eastham town residents is estimated to be $117 million annually). It should be noted that despite an overall positive retail gap, Eastham has a negative gap in the food and drink category. In both the primary and secondary trade area, there is a significant negative retail gap in both retail trade and food and drink. This suggests that the market derives a significant portion of its sales from those residing outside of these areas, whether from residents from other towns on the Cape or from tourists. The retail picture for the Primary Trade Area is different from that of the Town of Eastham. While Eastham has a net overall leakage of $59 million, the Primary Trade area has a negative retail gap of -$48 million. The total retail spending by residents of the trade area is estimated to be $190 million and the retail supply is $239 million. The Secondary Trade Area is similar to the Primary Trade Area in that the total retail spending of residents is estimated to be $538 million and total retail sales in excess of $656 million resulting in a negative retail gap of -$118 million. For both the Primary and Secondary Trade areas, the largest negative gap is in the food and drink category. Note that the Leakage/Surplus Factor represents a snapshot of retail opportunity. This is a measure of the relationship between supply and demand. A positive value represents leakage of retail opportunity outside of the defined area. A negative value represents a surplus of retail sales, a market where customers are drawn in from outside the area. Tables 19, 20, and 21 provide a summary of the Retail Gap in the three geographies. Town of Eastham Commercial Market Study 23
Table 19: Retail Gap Summary- Eastham
Leakage/Surplus
Demand Supply Retail Gap
Factor
Total Retail Trade and Food & Drink $117,388,326 $58,036,081 $59,352.245 33.8
Total Retail Trade $107,392,370 $40,493,597 $66,898,773 45.2
Total Food & Drink $9,995,956 $17,542,484 -$7,546528 -27.4
Source: ESRI Business Analyst
Table 20: Retail Gap Summary- Primary Trade Area
Leakage/Surplus
Demand Supply Retail Gap
Factor
Total Retail Trade and Food & Drink $190,366,392 $238,967,671 -$48,601,279 -11.3
Total Retail Trade $174,005,449 $188,964,226 -$14,958,777 -4.1
Total Food & Drink $16,360,942 $50,003,445 -$33,642,503 -50.7
Source: ESRI Business Analyst
Table 21: Retail Gap Summary- Secondary Trade Area
Leakage/Surplus
Demand Supply Retail Gap
Factor
Total Retail Trade and Food & Drink $538,296,297 $656,155,820 -$117,859,523 -9.9
Total Retail Trade $490,634,923 $530,850,709 -$40,215,786 -3.9
Total Food & Drink $47,661,374 $125,305,111 -$77,643,737 -44.9
Source: ESRI Business Analyst
Town of Eastham
The Town is experiencing retail leakage in many sectors. The retail sectors with the great
amounts of leakage (at the 4-digit NAICS level) are:
Automobile Dealers ($17M)
Department Stores ($8.3M)
Grocery Stores ($6.8M)
Health & Personal Care Stores ($7.5M)
Clothing Stores ($3.7M)
Building Material & Supplies Dealers ($5.5M)
Home Furnishings Stores ($2.6M)
Electronics & Appliance Stores (2.3M)
Auto Parts & Tire Stores ($1.7 M)
Jewelry, Luggage & Leather Stores ($1M)
The leakage in Health & Personal Care Stores is notable because Health & Personal Care
stores are considered “convenience” retail in that consumers will typically only drive short
distances for these stores whereas people are generally willing to drive further for
“destination” retail establishments such as Automobile Dealerships and Department stores.
Town of Eastham Commercial Market Study 24Some of the “destination” categories that consumers are willing to drive longer distances for
may not be appropriate for Eastham.
The Town does have some notable retail sectors with a negative retail gap (i.e., representing a
net influx of spending). The most significant of these include:
Restaurants/ Eating Places (-$5.9M)
Beer, Wine & Liquor Stores (-4.60M)
Special Food Services (-$2M)
Lawn & Garden Equipment & Supply Stores (-$1.5M)
Sporting Goods, Hobby, & Music Stores8 (-$1.4M)
Book & Music Stores (-1.0 M)
Table 22 provides a full breakdown of the retail gap for the Town of Eastham by retail category.
Note that retail leakage in a category does not necessarily equate to retail potential. The
surplus in the Restaurants/Other Eating Places indicates that Eastham is functioning as a
dining (and drinking) destination.
8
From Eastham’s Registered Business Database, examples include fishing tackle and bike shops.
Town of Eastham Commercial Market Study 25Table 22: Retail Leakage – Town of Eastham
NAICS Industry Group Demand Supply Retail Gap Leakage/
(Retail Potential) (Retail Sales) (Surplus)
4411 Automobile Dealers $20,321,716 $3,277,308 $20,969,522 72.2
4412 Other Motor Vehicle Dealers $2,227,419 $0 $2,227,419 100
4413 Auto Parts & Tire Stores $1,697,695 $0 $1,697,695 100
4421 Furniture Stores $1,404,972 $0 $1,404,972 100
4422 Home Furnishing Stores $2,748,902 $108,444 $2,640,458 85.1
4431 Electronics/Appliance Stores $4,057,577 $1,071,298 $2,986,279 58.2
4441 Bldg. Materials & Supply Stores $7,140,251 $1,675,861 $5,464,390 33.5
4451 Grocery Stores $17,673,701 $10,916,861 $6,756,840 23.6
4461 Health & Personal Care Stores $7,485,516 $0 $7,485,516 100
4471 Gasoline Stations $10,043,452 $3,269,452 $6,773,562 50.9
4481 Clothing Stores $4,395,781 $732,883 $3,662,898 78.6
4482 Shoe Stores $743,995 $0 $743,995 100
4483 Jewelry, Luggage / Leather Goods Stores $983,103 $0 $983,103 100
4521 Department Stores $8,288,623 $0 $8,288,623 100
4529 General Merchandise Stores $3,781,329 $0 $3,781,329 100
4531 Florists $305,739 $162,437 $143,302 30.6
4532 Office Supplies, Stationary / Gift Stores $1,282,714 $1,152,709 $130,005 5.3
4539 Miscellaneous Store Retailers $4,499,982 $2,430,331 $2,069,651 29.9
7224 Drinking Places (alcoholic beverages) $457,210 $0 $457,210 100
4442 Lawn & Garden Equip Stores $686,425 $2,218,809 -$1,532,384 -52.7
4452 Specialty Food Stores $755,647 $1,464,967 -$709,320 -31.9
4453 Beer, Wine / Liquor Stores $1,962,280 $6,562,021 -$4,599,741 -54.0
4511 Sporting Goods / Hobby Stores $3,080,208 $4,475,773 -$1,395,565 -18.5
4512 Book & Music Stores $410,137 $1,454,720 -$1,044,583 -56.0
4533 Used Merchandise Stores $251,281 $252,956 -$1,675 -0.3
7223 Special Food Services $359,862 $2,434,123 -$2,074261 -74.2
7225 Restaurants /Eating Places $9,178,884 $15,108,361 -$5,929,477 -24.4
Source: ESRI Business Analyst Online
Town of Eastham Commercial Market Study 26You can also read