Critical Aquifer Recharge Areas - Guidance Document January 2005 Publication Number
←
→
Page content transcription
If your browser does not render page correctly, please read the page content below
Critical Aquifer Recharge Areas

       Guidance Document

                January 2005
        Publication Number 05-10-028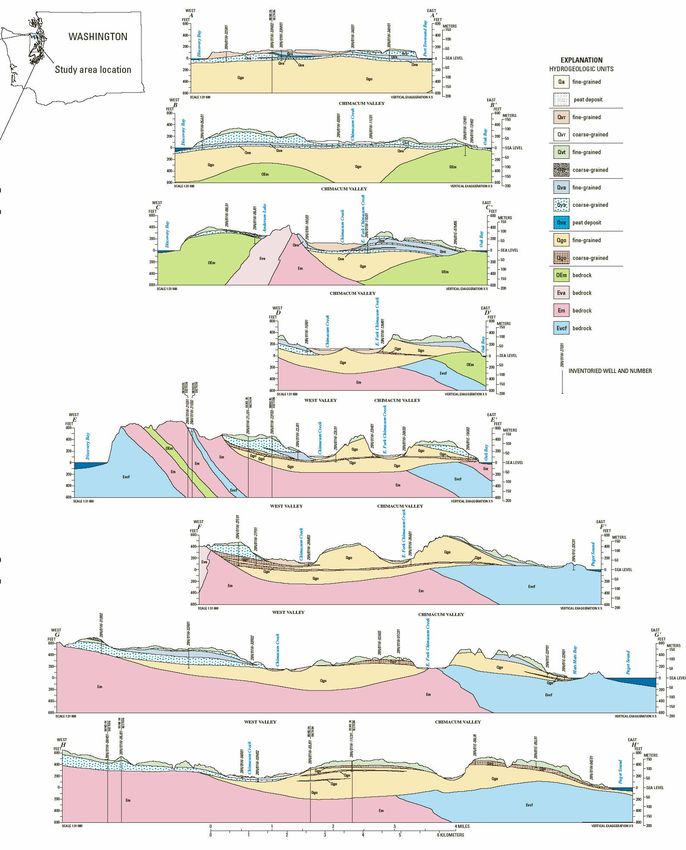
Critical Aquifer Recharge Areas

        Guidance Document

                   Prepared by:

                 Laurie Morgan
      Washington State Department of Ecology
             Water Quality Program

                   January 2005
          Publication Number 05-10-028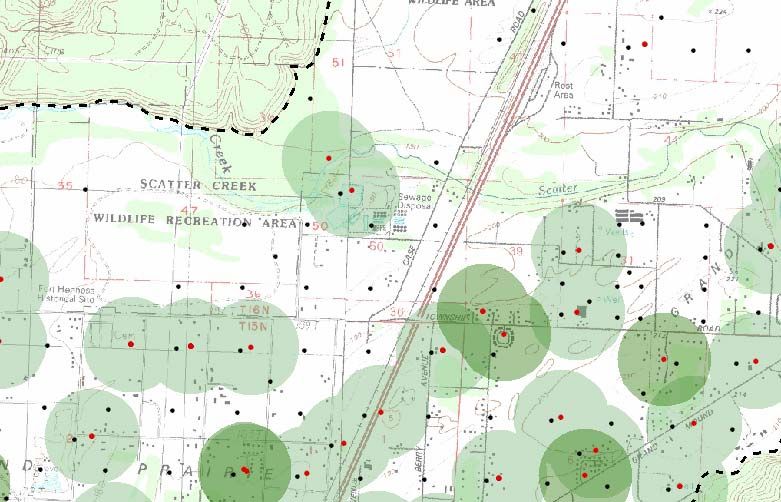
For additional copies of this document contact:

                                                   Department of Ecology
                                               Publications Distribution Center
                                                       P.O. Box 47600
                                                 Olympia, WA 98504-7600

                                                  Telephone: (360) 407-7472

                            Headquarters (Lacey) 360-407-6000
         If you are speech or hearing impaired, call 711 or 1-800-833-6388 for TTY

          Regional
                                                 Whatcom                                                                    Pend
                     San Juan                                                                                              Oreille
          Office
          location                                     Skagit                    Okanogan
                                                Northwest                                                        Stevens
                             Island                                           Central                  Ferry
                                               425-649-7000                 509-575-2490
            Clallam                                Snohomish
                                                                    Chelan
                 Jefferson
                                                                                     Douglas                               Spokane
                                Ki               Bellevue                                              Lincoln
                                  ts                                                                                  Spokane
                                       ap
            Grays                                      King
                                                                                                      Eastern
            Harbor Mason
                                                                   Kittitas             Grant       509-329-3400
                                              Pierce                                                   Adams        Whitman
                                      Lacey
                           Thurston
                       Southwest
                              Lewis
                Pacifi c                                                    Yakima               Franklin           Garfield
                      360-407-6300
               Wahkiakum                                          Yakima                                      Columbia
                                                                                        Benton        Walla                  Asotin
                                Cowlitz         Skamania                                              Walla

                                                                Klickitat
                                      Clark

If you need this information in an alternate format, please contact us at 360-407-6404. If you are
a person with a speech or hearing impairment, call 711 for relay service or 800-833-6388 for
TTY.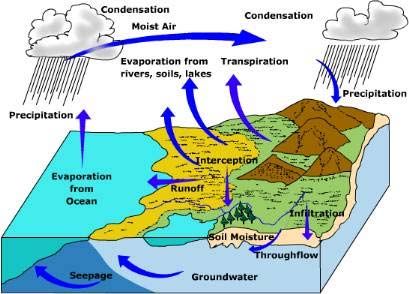
Table of Contents
List of Figures and Tables................................................................................................... ii
Acknowledgements............................................................................................................ iii
Section 1 Introduction........................................................................................................ 1
   The Growth Management Act and Critical Areas .......................................................... 2
   Critical Aquifer Recharge Areas..................................................................................... 2
Section 2 Basic Concepts................................................................................................... 5
Section 3 Protecting the Functions and Values of Critical Aquifer Recharge Areas ........ 9
   Step 1: Identify where groundwater resources are located .......................................... 10
   Step 2: Analyze the susceptibility of the natural setting where
           ground water occurs......................................................................................... 20
   Step 3: Inventory existing potential sources of groundwater contamination............... 21
   Step 4: Classify the relative vulnerability of ground water to contamination events. . 22
   Step 5: Designate areas that are most at risk to contamination events. ....................... 23
   Step 6: Protect by minimizing activities and conditions that pose
           contamination risks.......................................................................................... 23
   Step 7: Ensure that contamination prevention plans and best management
           practices are followed. ..................................................................................... 24
   Step 8: Manage groundwater withdrawals and recharge. ............................................ 24
Section 4 Best Available Science .................................................................................... 25
Section 5 Working with State and Federal Laws and Rules............................................ 29
Section 6 Adapting to Local Conditions and Settings ..................................................... 33
Section 7 Adaptive Management – Change Happens...................................................... 34
Section 8 References........................................................................................................ 35
Appendix A U.S. EPA Potential Sources of Drinking Water Contamination Index....... 37
Appendix B Where to Get More Information.................................................................. 43
Appendix C Selected GMA Hearings Board Decisions .................................................. 51
Appendix D Example Costs and Consequences of Ground Water Contamination ......... 55
Appendix E Example County Fact Sheets for Pollution Prevention ............................... 57

Critical Aquifer Recharge Area Guidance                                                                                Page i
List of Figures and Tables

Figure 1: The Hydrologic Cycle ........................................................................................ 5

Figure 2: The water table lowers when discharge is greater than recharge. ...................... 6

Figure 3: Location, extent, and uses of a drinking water supply aquifer......................... 11

Figure 4: Township, range, section, quarter-quarter, and well location .......................... 13

Figure 5: Representation of an aquifer system (Jones, 1999).......................................... 14

Figure 6: Well logs include observations about aquifers and overlying earth materials..15

Figure 7: This topographic map shows hilly bedrock next to a flatter river valley.. ....... 16

Figure 8: Hydrogeologic map of the Chimacum Basin (Simonds, 2004)....................... 18

Figure 9: Hydrogeologic cross-sections of the Chimacum Basin (Simonds, 2004) ....... 19

Figure 10: Contaminant path, vadose zone, and aquifer schematic drawing................... 20

Table 1: Laws, rules, and guidance for groundwater protection...................................... 31

Page ii                                                          Critical Aquifer Recharge Area Guidance
Acknowledgements
Many people have commented on this document and have provided helpful suggestions.
Others have been involved with Critical Aquifer Recharge Areas and this document has
benefited greatly from their knowledge and perspective. I would like to thank the
following people for their help and guidance: Stephen Swope, Pacific Ground Water
Group; John Sonnen, Thurston County; Ken Johnson, King County; Thomas Barry, city
of Redmond; Richard Hoiland, city of Vancouver; Jalyn Cummings, Snohomish County;
Doug Kelly, Island County; Catherine Weisman, Evergreen Rural Water of Washington;
Susan Braley, John Stormon, Doug Wood, Bari Schreiner, Gerry Kunkel, Diane Dent,
and Ann Kahler, Department of Ecology; Doug Peters and Chris Parsons, Department of
Community, Trade and Economic Development; David Jennings, Department of Health;
Jennifer Parker, U.S. Environmental Protection Agency; Kirk Cook, Department of
Agriculture; and the Interagency Ground Water Committee.

I would also like to express deep appreciation for all of the counties and cities that are
working on their Critical Aquifer Recharge Area ordinances and planning. I would
particularly like to mention eastern Washington jurisdictions working on groundwater
protection from which I have gained knowledge and perspective including Ferry County,
Spokane County, the Columbia Basin Ground Water Management Area, and others.

Critical Aquifer Recharge Area Guidance                                            Page iii
Page iv Critical Aquifer Recharge Area Guidance
Section 1
                                   Introduction
This guidance document helps local jurisdictions and the public understand what is
required for the protection of local groundwater resources under the Growth Management
Act. It includes guidance for planning, ordinances, and for including the Best Available
Science (BAS) as these relate to Critical Aquifer Recharge Areas.

This guidance will also explain how the laws and rules of the state of Washington for
water quality, pollution prevention, and water resources relate to Critical Aquifer
Recharge Area protection.

We are revising the guidance to improve usability and clarity, and to provide additional
explanation.

When the public drinking water supply is compromised, the community faces risk
and great expense. Contaminated water can cause illness and ingestion of toxic
chemicals or other harmful substances. Remediation of contaminated ground water is
overwhelmingly expensive. A contamination event can cause city wells to be shut down,
result in expenses for new wells, and incur costs for cleaning up contaminated soil and
ground water.

Prevention of groundwater contamination is far less expensive than cleanup. EPA
studies have shown that investing funds for groundwater protection is cost-effective
compared to groundwater cleanup at a ratio that runs anywhere from 1:5 to 1:200 (U.S.
EPA, 1995).

The Growth Management Act requires protection of public groundwater drinking
supplies so that tragic contamination events and their associated costs can be prevented.
In addition, public drinking water supply depends on groundwater availability. Without
replenishment, the amount of water in aquifers can be diminished or even depleted.

A good groundwater protection program involves:

•   Identifying groundwater resources at risk,
•   Identifying threats to ground water, and
•   Monitoring to make sure a condition that could cause an unacceptable risk is not
    occurring and taking action when necessary.

Critical Aquifer Recharge Area Guidance                                             Page 1
The Growth Management Act and Critical Areas
The Growth Management Act (Chapter 36.70A Revised Code of Washington) (GMA)
requires comprehensive land use planning by counties and cities. The act, commonly
known as the GMA, specifies 13 overall planning goals. These goals include urban
growth, transportation, economic development, natural resource industries, public
facilities, open space and recreation, historic preservation, environmental planning, and
others.
The environmental planning goal is to “protect the environment and enhance the state’s
high quality of life, including air and water quality, and the availability of water” (RCW
36.70A.020).
The GMA requires the designation and protection of “Critical Areas” to prevent harm to
the community from natural hazards and to protect natural resources.
• Natural hazards are frequently flooded areas and geologically hazardous areas.
• Natural resources are wetlands, fish and wildlife habitat conservation areas, and
“areas with a critical recharging effect on aquifers used for potable water,” which are
called Critical Aquifer Recharge Areas.
The goal of establishing Critical Aquifer Recharge Areas is to protect the functions and
values of a community’s drinking water by preventing pollution and maintaining supply.
Critical Aquifer Recharge Areas
A Critical Aquifer Recharge Area (CARA) is defined by the GMA as “areas with a
critical recharging effect on aquifers used for potable water.”
The Washington Administrative Code (WAC) Chapter 365-190 uses the following
definition:
“Areas with a critical recharging effect on aquifers used for potable water are
areas where an aquifer that is a source of drinking water is vulnerable to
contamination that would affect the potability of the water.”
Identifying “areas with a critical recharging effect on aquifers used for potable water,”
depends on understanding aquifer recharge and what is meant by “a critical recharging
effect.”
Aquifer recharge occurs where rainfall, snowmelt, infiltration from lakes, wetlands and
streams, or irrigation water infiltrates into the ground and adds to the water underground
that can supply a well. On the other hand, discharge areas are where ground water is
headed toward the ground surface and ultimately flows out from a spring, wetland,
stream, lake, estuary, or ocean shore. Wells can also serve as discharge areas, especially
larger volume wells, such as those used by municipalities.
Page 2 Critical Aquifer Recharge Area GuidanceMost of a watershed is typically a recharge area, with discharge areas occurring to a more
limited extent in topographically lower areas. Recharge areas and discharge areas can be
mapped using hydrogeologic techniques to determine where ground water is and where it
is flowing.
Aquifers used for potable water are identified by looking at existing and future planned
uses. Existing wells and their protection areas, sole source aquifers, and aquifers
otherwise identified as important supplies, are examples of “aquifers used for potable
water.”
Setting priorities for the most critical supplies helps jurisdictions make decisions about
where to focus their efforts. Areas may be categorized to reflect these priorities. An
example would be to apply more strict regulations and monitoring within the one-year
time of travel of a city well, as opposed to more sparsely developed areas of the county.
More strict regulation may be applied in an area where the aquifer is shallow and
vulnerable to contamination more than an aquifer that is deep and protected.
Ground Water and Other Critical Areas
Ground water is inextricably linked with all of the critical areas including wetlands, fish
and wildlife habitat, critical aquifer recharge areas, frequently flooded areas, and
geologically hazardous areas.
• Ground water is a source of water to streams, lakes, estuaries, wetlands, and
springs; and therefore serves a critical function for wildlife and fish habitat. Some
plants that provide habitat, like willows, depend on shallow ground water.
• Ground water is often a key factor in flooding and geologic hazards.
The GMA also requires that local jurisdictions give special consideration to conservation
or protection measures necessary to preserve or enhance anadromous fisheries. Since
ground water is an important component of stream flow, it is necessary to maintain the
groundwater supply to streams where needed to protect salmon and other anadromous
species.
Qualified Professional Assistance
Professional hydrogeologic work for the establishment of Critical Aquifer Recharge
Areas should be performed by a hydrogeologist licensed in the state of Washington
(RCW 18.220 and WAC 308-15). In particular, the delineation and characterization of
aquifers and the analysis of environmental fate and transport of potential contaminants
through the ground should be performed by a qualified licensed professional.
Critical Aquifer Recharge Area Guidance Page 3Many activities associated with Critical Aquifer Recharge Areas may be done by others (who are not licensed professional hydrogeologists) such as planning, pollution prevention, education and outreach, ordinance enforcement, and other activities associated with city and county programs. Page 4 Critical Aquifer Recharge Area Guidance
Section 2
                                  Basic Concepts
This section lists basic concepts that help with understanding the occurrence and
movement of ground water.

Where Ground Water Comes From

Recharge is water that is added to ground water, whether it is from rainfall that infiltrates
through the ground, snowmelt, or some other source. Recharge can come from quite a
distance through the ground over a long period, or it can come from relatively local and
more recent sources.

                              Figure 1: The Hydrologic Cycle

The Hydrologic Cycle

The hydrologic cycle is how water evaporates from the oceans, gathers in clouds, and
rains or snows onto the land. After it rains or the snow melts, the water then either
evaporates, is used up by plants, runs off to streams, lakes, or the ocean; or infiltrates into
the soil. Some of this infiltration will reach the underground water table and will
recharge the aquifer.

Recharge can also carry contaminants into ground water from the land surface.
Therefore, recharge is at the center of preventing pollution and maintaining supply both
for drinking water and for freshwater habitats.

Critical Aquifer Recharge Area Guidance                                                 Page 5
Where Ground Water Goes
Ground water flows through the ground from where it is recharged to where it is
discharged. Discharge is where water moves from underground to the land surface.
Springs are a familiar example. Ground water also discharges to lakes and streams. In
fact, in Washington, ground water can make up a majority of stream flow, especially in
late summer and early fall (Pitz, Sinclair, 1999). This is why groundwater discharge is
such an important aspect of maintaining or restoring freshwater habitat.
The Water Table
The water table occurs where the underground is saturated with water. Discharge of
ground water, whether by pumping or by seeping into streams and springs, can lower the
water table if the recharge does not keep up. The effect can be to pull the water down
below a well or to dry up a stream. Sometimes the water table rises above the land
surface. This can fill lakes and streams, or even cause flooding when the water has
nowhere to drain.
People can cause the water table level to lower both by removing ground water from
wells and by reducing the quantity of recharge, as happens where there is too much paved
or impervious surface and ground water cannot infiltrate where it formerly did. Figure 2
shows the effects of a declining water table (modified from USGS illustration at
http://ga.water.usgs.gov/edu/earthgwaquifer.html).
The Importance of Recharge…
Figure 2: If the groundwater table drops to the lower dashed line, both the stream and
the well go dry. The water table lowers when discharge (water out) is greater
than recharge (water in).
Hydrogeologists can map recharge and discharge zones by measuring many water levels.
The hydrogeologic setting is the framework that controls groundwater occurrence and
movement. Where ground water flows, the rate at which it flows, where it recharges or
discharges, and how deep it occurs are all functions of what the land is like – the soil,
Page 6 Critical Aquifer Recharge Area Guidancesediments, and rocks that ground water moves through. The hydrogeologic setting also
includes the topography and the weather patterns that control recharge.
Knowledge of hydrogeologic settings is useful for establishing critical aquifer recharge
areas. Prioritization of critical aquifer recharge areas can be based on the susceptibility
of those settings to contamination or water quantity impacts.
Susceptibility refers to what the ground is like. When water can move readily through
the ground, it can carry contaminants to ground water more quickly. Sandy, shallow
aquifers are more susceptible than deep aquifers that are overlain by clay.
Vulnerability refers to the risk of contamination from chemical use combined with the
risk from the susceptibility of aquifers.
Note: Sometimes, the terms vulnerability and susceptibility are used interchangeably, so
you should be sure of the author’s meaning when you encounter these terms.
Susceptibility factors:
• The vadose zone consists of the unsaturated earth materials above an aquifer. Depth
to water is the distance through the vadose zone a contaminant would travel to reach
the water table. The deeper the water table, the longer the travel time.
• Permeability is a scientific measurement of the rate of infiltration in inches of water
per hour. Infiltration rate is a measure of how fast water and pollutants can move
downwards through the earth materials of the vadose zone. The more permeable the
ground is, the faster water moves down through it, the more the underlying ground
water is susceptible to contamination. Coarse sands and gravels allow water to pass
through much more quickly than fine silts and clays.
• Chemical retardation is a measurement of how clays and organic matter react with
some chemicals to slow their passage or change them chemically.
• Adsorption is a measurement of the tendency of ions dissolved in water to stick to
particles of silt or clay. The particle size and the amount of organic matter affect the
adsorption. A sand with no organic matter may not adsorb at all, while an organic silt
or clay may adsorb well. In short, a contaminant can be captured or slowed down by
sticking to clay.
• Low permeability layers, such as clay or glacial till, may occur between the land
surface and an aquifer, either within the vadose zone or within an aquifer system.
These layers would restrict downward migration of contaminants and would provide
a measure of protection to the aquifer.
Note: Care should be taken with presuming a confining layer is protective, because
layers may not be laterally extensive and may have some feature that allows leakage.
Critical Aquifer Recharge Area Guidance Page 7• Hydraulic conductivity is a measure of how fast a quantity of water can move
through an aquifer (for a given gradient through a unit area). The higher the
hydraulic conductivity, the faster the flow.
• Gradient is the result of differences in elevation between two locations of the water
table or the differences in pressure between locations in a confined aquifer. The
higher the gradient, the faster the flow.
Just as a ball rolls downhill, water flows downhill – from higher water table
elevations to lower water table elevations. Water also flows in the direction that
pressure is moving it. Just as you can push a ball uphill, high-pressure conditions
can push water upwards. Both pressure differences and elevation differences create
gradients.
• Groundwater flow direction is determined by gradients, which in turn are
influenced by pumping, discharge to surface water, topography, and geologic setting.
• Groundwater flow rate depends on the nature of the geologic materials water flows
through along with the pressure on the water. Coarser materials allow faster flow,
and higher pressures induce faster flow.
Preventing pollution depends on controlling land use activities to prevent contaminant
spills and leaks. Critical aquifer recharge areas are designated so that greater control can
occur where land use activities are a high-risk for polluting sensitive aquifers.
Prioritization of Critical Aquifer Recharge Areas can be accomplished by identifying
where high-value water resources are located in highly susceptible areas (King County,
2004).
Critical aquifer recharge area maps are delineations of where a community’s
groundwater supply meets criteria such as susceptibility, potential for contamination, and
priority.
Wellhead protection zones are areas around wells where contamination would result in
polluting the water supply well within a specific time period. Time periods used by the
Department of Health Drinking Water Program are six months, one year, five years, and
ten years.
Aquifers are created when water saturates, or fills, the underground where the ground is
permeable enough to yield useable quantities of water to a well. Layers that are not
permeable enough to yield useable quantities of water to a well are called aquitards.
Common types of aquifers are sand and gravel, fractured bedrock, and karst (limestone).
In the Puget Sound region, the landscape that defines aquifers is made up mainly of
glacial deposits. In eastern Washington, there are several types of geologic settings that
contain aquifers. One major type of aquifer in eastern Washington is the Columbia Flood
Page 8 Critical Aquifer Recharge Area Guidancebasalts. In the Columbia Basin, irrigation has created aquifers by filling the sands and
gravels over the Columbia Flood basalts.
There may be a whole system of multiple confined aquifers and a water-table aquifer in
an area. Sometimes the water table aquifer and confined aquifers beneath are connected
and water from one aquifer flows into another.
A confined aquifer is an aquifer that lies beneath a confining layer, such as a silt or clay
layer. This condition can cause the water to be under pressure, resulting in an artesian
well. Sometimes this pressure is great enough to cause the well to flow out at the surface.
Ground water in confined aquifers flows from the direction of the highest pressure to the
lowest pressure.
A water-table aquifer is water under normal atmospheric pressure. This aquifer is not
capped by a layer of clay or fine silt. Water-table aquifers flow generally in accordance
with the topography towards rivers, streams, lakes, and springs.
Safe yield (Fetter, 1980) is the amount of naturally occurring ground water that can be
economically and legally withdrawn from an aquifer on a sustained basis without
impairing the native groundwater quality or creating an undesirable effect such as
environmental damage. It cannot exceed the increase in recharge or leakage from
adjacent strata plus the reduction in discharge caused by pumping.
Section 3
Protecting the Functions and Values of
Critical Aquifer Recharge Areas
The functions and values of Critical Aquifer Recharge Areas are to provide the public
with clean, safe, and available drinking water. In order to accomplish this goal,
information is needed about the location and extent of aquifers that supply public
drinking water, the susceptibility of these supplies to contamination, and potential
contamination risks. In addition, planning, programs, and ordinances are needed to
prevent contamination from occurring.
The following steps characterize where groundwater resources are important to the
community and how to protect them.
• Identify where groundwater resources are located.
• Analyze the susceptibility of the natural setting where ground water occurs.
• Inventory existing potential sources of groundwater contamination.
• Classify the relative vulnerability of ground water to contamination events.
• Designate areas that are most at risk to contamination events.
• Protect by minimizing activities and conditions that pose contamination risks.
Critical Aquifer Recharge Area Guidance Page 9• Ensure that contamination prevention plans and best management practices are
followed.
• Manage groundwater withdrawals and recharge impacts to:
- Maintain availability for drinking water sources.
- Maintain stream base flow from ground water to support in-stream flows,
especially for salmon-bearing streams.
The following section provides more details about each one of these steps
Step 1: Identify where groundwater resources are located
The GMA discusses the use of both mapping and performance standards to identify
critical areas.
Maps are highly useful for Critical Aquifer Recharge Areas because they can show the
location of public water supply wells, private wells, and aquifer boundaries. They can
also be used to show the location of areas that have been rated for susceptibility. Maps
can be used to see where pollution prevention is most needed and to help plan
development. Known Critical Aquifer Recharge Areas should be mapped.
Performance standards are the criteria for designation of a critical area. A performance
standard is applied when reviewing development projects to determine what category of
Critical Aquifer Recharge Area the proposal is in and what the applicable site conditions
are. Policies, planning, ordinances, and programs are applied based on the outcome of
the evaluation of the proposal using performance standards.
The use of performance standards is recommended for … circumstances where
critical areas cannot be specifically identified [WAC 365-190-040(1)]. The purpose
of a performance standard is to have an objective standard for comparison
(WWGMHB, 1997).
To use performance standards, local jurisdictions need sufficient information to:
• Make an informed determination as to whether or not critical areas are present on the
site.
• Determine whether or not the proposed activity will impact those critical areas.
The Critical Areas Handbook (Washington Dept. of Community Trade and Economic
Development, 2003) states that:
“Critical areas may be designated by adopting specific performance standards,
delineating specific geographic areas, or both. Generally, performance
standards are preferred, as any attempt to comprehensively map wetlands, for
example, throughout a jurisdiction would likely be too inexact for regulatory
purposes. Even so, mapping critical areas for information purposes is
advisable. All areas meeting the definition of one or more critical area type,
regardless of any formal identification, are required to be designated critical
areas.”
Page 10 Critical Aquifer Recharge Area GuidanceIdentifying the Location and Extent of Drinking Water Supply Aquifers
Mapping drinking water supply aquifers makes use of well location and well log
information as well as the location and characteristics of aquifers.
Well locations are important to identify to help prioritize risk and guide local ordinances
and planning near active public wells.
Aquifer locations are important to identify to give the jurisdiction information about
where groundwater resources are. When new wells are needed, knowledge of where
aquifers may supply water is critical. This knowledge is used in water system planning
and is a vital consideration for long-term planning.
The following illustration shows:
• Public water supply wells (Group A) and their protection zones
• Smaller public water supply wells (Group B)
• Wells that serve one or two households
• The location and the extent of a local aquifer - - - - - - - - - -
Possible aquifer border
Group B
Private Well
Group A
Figure 3: Location, extent, and uses of a drinking water supply aquifer.
Note: The private wells on this map appear at the nearest quarter-quarter section, NOT
where they are actually located on the ground. This is because well logs report locations
Critical Aquifer Recharge Area Guidance Page 11this way, and that is what we have to use for mapping. Private wells are included in this
illustration to give an idea of the use of the aquifer.
Public Water Supply Wells
Public drinking water supply systems are regulated by the Department of Health under
the Safe Drinking Water Act (SDWA). The state regulates systems with 15 or more
connections, and the local health jurisdiction regulates systems with 3 to 14 connections.
The SDWA also includes the Source Water Protection Program. Under this program,
wellhead protection zones are defined and the susceptibility of the well to contamination
is rated. Potential contamination sources within the protection zones are also inventoried.
The wellhead protection zones are defined by the areas where a spill incident could result
in contamination of the well within a specified time period. The time periods are six
months, one year, five years, and ten years. Zones based on these time periods are known
as time-of-travel zones. Methods of delineating wellhead protection zones vary from
modeling to drawing a circle around the well at a fixed radius (least accurate method).
These mapped wellhead protection zones may be designated as a category of Critical
Aquifer Recharge Area. A jurisdiction may have stricter requirements closer to the well.
For example, some uses may be prohibited within the one-year time-of-travel zone that is
allowed with mitigation in the ten-year time-of-travel zone.
Maps of public water supply wells and their protection zones are available on the
internet.
• Washington State Department of Health Source Water Protection:
http://www.doh.wa.gov/ehp/dw/our_main_pages/swap.htm
• Washington State Department of Ecology Facility/Site on the web:
http://www.ecy.wa.gov/services/as/iss/fsweb/fshome.html
Note: It should be kept in mind that any information system may have missing or
inaccurate information.
Domestic Wells
Residences that are located too far from a public water supply system must rely on
individual wells, springs, or surface water. Individual domestic wells are an important
and widespread source of drinking water supply in Washington.
Maps of domestic well locations together with well logs help with identifying the
location, extent and use of drinking water supply aquifers.
To find information about domestic wells, contact the Department of Ecology Water
Resources Program.
Page 12 Critical Aquifer Recharge Area GuidanceState law requires that a well log be filed with the Department of Ecology when a well is
constructed. Well log information includes location by address and
township/range/section/quarter-quarter.
The Department of Ecology
map, which is derived from
well logs, locates wells in the
center of the Township,
Section, Range, Quarter-
quarter square. The actual
well location may be
anywhere within the 40-acre
square.
Source: Washington Dept. of Natural Resources, http://www.dnr.wa.gov/geology/glogrid.htm#trs
Figure 4: Township, range, section, quarter-quarter, and well location
Well logs are available at the Department of Ecology Regional Offices in Lacey, Yakima,
Spokane, and Bellevue. Many counties also maintain copies. The Department of
Ecology Well Log Viewer internet site has downloadable well logs, well records, and
maps of well locations at http://apps.ecy.wa.gov/welllog/.
The well locations were created by placing a point at the center of the
township/range/section/quarter/quarter-quarter square. The following should be kept in
mind when using these well locations.
Critical Aquifer Recharge Area Guidance Page 13• There are many wells for which well logs have not been submitted, and therefore
do not appear on this map.
• Sometimes the location information written on the well log is incorrect, and so the
location shown for the well on the map is inaccurate.
It is up to the well driller to provide accurate information on the well log. The
well owner should make sure the location information is correct.
• The point that represents the well is placed in the center of the township, range,
section, quarter-quarter square. The actual location of the well is anywhere within
the 40-acre square.
For example, if the center of the square is in a lake, and the actual well location is
on shore, the map will plot the well in the lake. The well IS NOT in the lake.
There are thousands of well logs, and the locations have not been adjusted
individually.
Well Identification Using Parcel Maps
Another way of identifying private wells is to look at a map of parcels with existing
residences that are outside of public water supply service areas. This will give an
indication of areas within the jurisdiction that rely on private wells.
Aquifers
This section looks at what tools are used to identify and characterize aquifers. Well logs,
maps, testing, and field reconnaissance are some of the tools used to identify aquifers.
Figure 5: Representation of an aquifer system (Jones, 1999)
Page 14 Critical Aquifer Recharge Area GuidanceFigure 6: Well logs include observations about aquifers and the earth materials that
overlie the aquifers.
Critical Aquifer Recharge Area Guidance Page 15Well logs contain information about aquifers:
• Location of the well
• The kinds and depths of underground materials (sand, gravel, silt, clay, bedrock,
etc.)
• Water level at the time of drilling
• Where the aquifers are and how far they extend. Many well logs are needed for
this analysis.
• An estimate of the amount of water that can be pumped from a well.
Maps are used to help define the boundaries of aquifers.
Where the valley floor meets
the base of hills is one
example of an aquifer
boundary
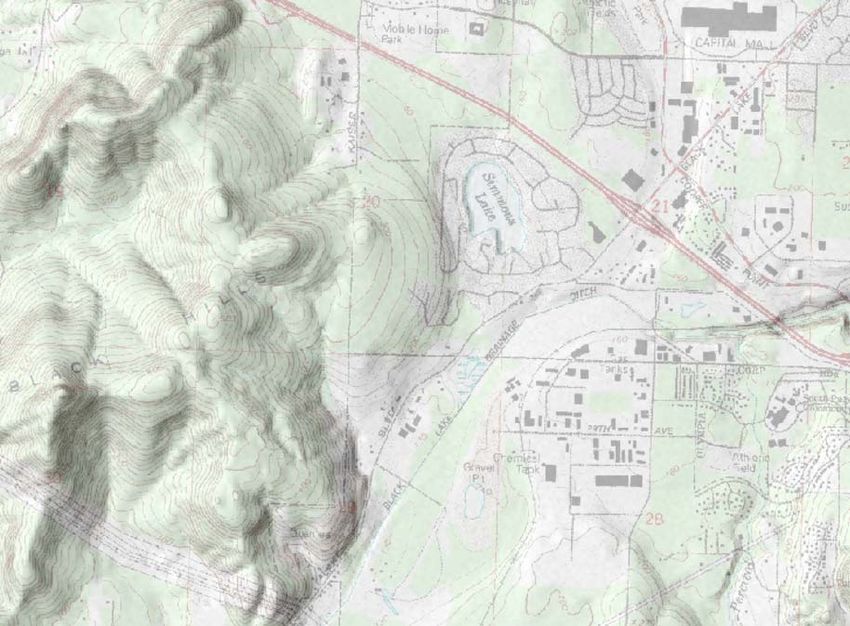
Figure 7: This topographic map shows hilly bedrock next to a flatter river valley. The
boundary of the aquifer is likely to be where the hills slope up from the valley.
Topographic maps show landscape changes that are often associated with aquifer
boundaries. (For example, the boundary for a river valley aquifer may be where the
bedrock slopes up from the valley floor.)
Surficial geology maps show where geologic materials are located that are likely to
contain aquifers, such as alluvial deposits.
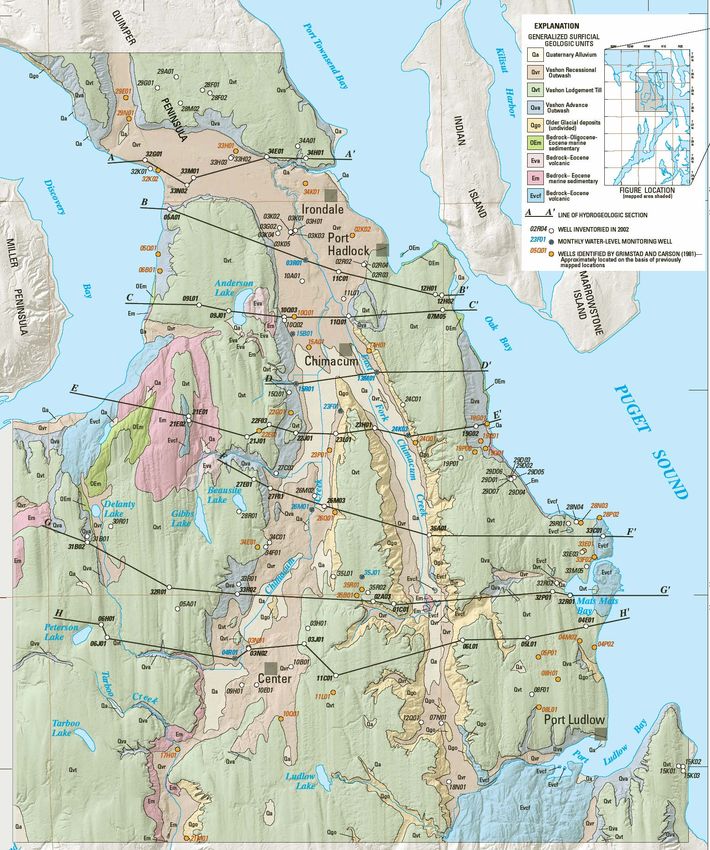
Page 16 Critical Aquifer Recharge Area GuidanceTesting methods help hydrogeologists to identify and characterize aquifers. For example, aquifer tests involve pumping water out of a well at a known rate and measuring the effect in other wells over time. These tests show how much water can be pumped from a well, how far away other wells can be affected. They may also show to what extent water from one aquifer may leak into another. Geophysical methods are used to determine characteristics such as the nature and geometry of geologic materials, the extent of aquifers, depth to water, and water quality. Modeling takes all of the available information and observations that a hydrogeologist has and uses the computer to account for known conditions. It allows a hydrogeologist to model different (what-if) scenarios and to find out what may happen when various choices are made. Example questions that modeling can address are: • What would the effect of pumping from a well field be on stream flow? • If a spill occurred here, how long would it be before the contaminants reach the well? • How would a drought affect water table levels and stream flows? Hydrogeology studies look at all the available resources to map and describe aquifers. Consultants, the state, academic studies, the U.S. Geological Survey (USGS) and other agencies are sources of this type of information. These studies can be used to support the identification and characterization of Critical Aquifer Recharge Areas. Figures 8 and 9 show a hydrogeologic map and cross-section from a USGS study in Jefferson County (Simonds, 2004). Critical Aquifer Recharge Area Guidance Page 17
Figure 8: Hydrogeologic map of the Chimacum Basin (Simonds, 2004)

Page 18                                      Critical Aquifer Recharge Area Guidance
Figure 9: Hydrogeologic cross-sections of the Chimacum Basin (Simonds, 2004)

Critical Aquifer Recharge Area Guidance                                    Page 19
Contaminant Path                                   My Well

                                     Soil Layer

                                   Vadose Zone

                                        Aquifer

      Figure 10: Contaminant path, vadose zone, and aquifer schematic drawing.

Step 2: Analyze the susceptibility of the natural setting where ground
        water occurs.

How do contaminants get to a well? Contaminants be spilled onto the ground or may
leak from an underground tank and travel downward to the aquifer. After reaching the
aquifer, contaminants may be carried along with the ground water flow to a well.

How fast and how far a contaminant travels depends on both the natural setting and the
chemical and physical characteristics of the contaminant. There are many different
chemicals with varied characteristics and this makes assessing all of the possible
environmental fate scenarios difficult.

It is much more feasible to start with characterizing susceptibility. This involves
determining the physical characteristics of the ground above the aquifer, called the
vadose zone, and the characteristics of the aquifer. With susceptibility assessed, the
nature of the contaminants can be taken into account by limiting or prohibiting the use of
chemicals that are high-risk contaminants within high priority susceptible areas.

Susceptibility of the ground (vadose zone)

Along with the characteristics of the contaminant, the characteristics of the vadose zone
determines how easily a spill of a contaminant could get down to the water table.
Characteristics important for susceptibility assessment typically may include depth to
water, infiltration rate, permeability, chemical retardation factors, adsorption, and the
presence or absence of a impermeable layer.

Page 20                                         Critical Aquifer Recharge Area Guidance
Susceptibility of the aquifer
The characteristics of the aquifer control how fast a contaminant reaches a well once it
has entered the aquifer. Factors typically considered in assessing the susceptibility of
aquifers include hydraulic conductivity, vertical and horizontal gradients, and ground
water flow direction and rate.
Hydrogeologic studies contain information about aquifers useful for understanding
aquifer characteristics and relative susceptibility. Where aquifer studies have not yet
been undertaken, well logs and maps of surficial geology and soils will begin to provide
an idea of relative susceptibility to contamination. A qualified professional knows how
to use this information along with other methods to describe the overall hydrogeologic
setting and its relative susceptibility.
Hydrogeologists use this information along with contaminant characteristics such as
solubility, sorption, concentration, and other chemical and physical properties to answer
questions such as:
• How likely is it that a contaminant spilled in a certain location would reach a
well?
• How fast would a contaminant spill get to a water well?
• How concentrated would the contaminant still be when it got there?
Source water protection susceptibility rating
The Department of Health evaluates and assigns a susceptibility rating for each public
water supply well, based on a number of factors, including whether or not there is a
protective confining layer above the aquifer. This rating and information is useful in
support of a susceptibility assessment, along with wellhead protection plans, which
include information about how fast a contaminant could move toward the well based on
time-of-travel estimates.
Step 3: Inventory existing potential sources of groundwater contamination.
Anywhere that a potential pollutant is used, handled, transferred, or stored is a potential
source of groundwater contamination. Examples are facilities for transferring chemicals
from trucks to tanks, drycleaners, machinery manufacturers, and many more. The U.S.
EPA Potential Sources of Drinking Water Contamination Index is in Appendix A.
Many of these facilities may be constructed, maintained, and operated in a way that
prevents spills from getting to the ground as much as is feasible. Some operations,
however, are inherently more risky for pollution than others. These would include
facilities that handle a large quantity of toxic materials, especially where these toxic
materials are transferred or handled, increasing the possibility of an incident leading to a
spill.
Critical Aquifer Recharge Area Guidance Page 21Source water protection contaminant inventories
Public water supply systems with 15 or more connections are regulated under the federal
Safe Drinking Water Act. They must inventory potential contamination sources around
the wells. The Department of Health works with the Department of Ecology to provide
web-based maps of potential contamination sources along with locations of wellhead
protection zones. The Facility-Site atlas can be accessed from the Department of
Ecology geographic information system (GIS) applications website:
http://www.ecy.wa.gov/services/gis/apps/apps.htm
The GIS cover of facilities and sites regulated by the Department of Ecology can be
accessed from the GIS Data website (click on Facility Site):
http://www.ecy.wa.gov/services/gis/data/data.htm
Step 4: Classify the relative vulnerability of ground water to contamination
events.
All ground water is vulnerable; some areas where strategic public groundwater resources
are located are more vulnerable than other areas. The concept of using criteria to create
classifications or categories of vulnerability helps local jurisdictions apply the appropriate
measures for the risks involved.
Susceptibility refers to natural conditions, and vulnerability refers to the total
contamination risk from both the natural conditions and potential contaminant sources.
The base classification of Critical Aquifer Recharge Areas can be based on susceptibility,
and an overlay of existing contamination sources used to give the community an idea of
where its strategic groundwater supplies may be most at risk under current land use
conditions.
For new development, classification based on natural conditions allows a jurisdiction to
make decisions about the type of land uses that should or should not be allowed, or which
may be allowed with conditions.
There is more than one way to classify Critical Aquifer Recharge Areas. Here are three
methods and some illustrations:
• Categories based on susceptibility
o Water table sand and gravel aquifers
o Deeper less susceptible aquifers
o Confined aquifers
• Categories based on set priorities and risk
o Large public water supply systems one-year time of travel protection zone
o Densely populated areas that rely on ground water
Page 22 Critical Aquifer Recharge Area Guidanceo Medium public water supply systems protection zones
o Rural areas with a high dependence on ground water
o Discontinuous local drinking water aquifers of limited extent
o Sole Source Aquifers
• Categories based on areas that have the same policies, plans, ordinances, and
programs that will be applied.
The examples are not meant to be exhaustive. The categories depend on local
hydrogeologic settings, use of the drinking water aquifers, and the actions that a local
jurisdiction needs to set in place to protect the public potable groundwater resource.
Step 5: Designate areas that are most at risk to contamination events.
The next step in establishing Critical Aquifer Recharge Areas is to designate areas where
the public drinking water supply has been determined to be at risk for contamination.
So that local planning and regulation can be guided appropriately, designation makes it
clear.
• Where these areas are located (map) and what the performance standards are
(criteria).
• Why they are at risk (susceptibility and potential contaminant sources).
• What the importance of this area is to the public drinking water supply
(prioritization).
Step 6: Protect by minimizing activities and conditions that pose
contamination risks.
Anywhere chemicals are stored, handled, transferred, or used is a potential spill or leak
risk.
There are all too many examples of groundwater contamination here in Washington.
Municipal water supplies have been contaminated by industrial or commercial use of
chemicals. The city of Tumwater, the city of Vancouver, and the city of Lakewood all
have had contaminated wells. In Eastern Washington, well water turned yellow from
dinoseb, a pesticide spilled at Alexander Farms. These events have been expensive and
distressing.
Local jurisdictions need authority to require pollution prevention and to obtain
compliance before a situation contaminates the local drinking water supply. Ordinances
can be specific to the jurisdiction, or a jurisdiction may choose to adopt state or federal
laws or rules by reference. Often, county or city hazardous waste pollution prevention
programs with associated regulations are operated to prevent local land use activities
from creating major cleanup sites.
Critical Aquifer Recharge Area Guidance Page 23Step 7: Ensure that contamination prevention plans and best management
practices are followed.
The best plans and practices cannot prevent contamination if they are not used. The
ability to inspect, obtain compliance and enforce is needed to make sure that the county
or city can stop a threat to ground water when the land user is negligent or uncooperative.
Step 8: Manage groundwater withdrawals and recharge.
• Maintain availability for drinking water sources.
• Maintain stream-base flow from ground water to support instream flows,
especially for salmon-bearing streams.
Recharge
Development has a profound effect on the hydrology of an area. The increase in
impervious surfaces and disturbance of natural vegetation result in increasing runoff and
decreasing recharge. Local jurisdictions can improve recharge by encouraging methods
that increase recharge, such as low impact development and rain gardens.
The Puget Sound Action Team is a helpful resource for information and assistance with
low impact development at http://www.psat.wa.gov/Programs/LID.htm.
Water supply planning
The Watershed Planning Act (Chapter 90.82 RCW) provides for water supply planning
by local entities within a Water Resources Inventory Area (WRIA), including at least the
counties, the largest city or town within the WRIA, and the water utility that uses the
most water. Many of the WRIAs are engaged in watershed planning. For the current
status of watershed planning, see the website at
http://www.ecy.wa.gov/watershed/index.html
Ground Water Management Areas (GMA) may be established by either the state or local
government under RCW 90.44.400. Criteria for identifying potential Ground Water
Management Areas include (among others): Aquifer systems that are declining due to
restricted recharge or over-utilization and aquifers identified as the primary source of
supply for public water supply systems.
Large water systems regulated by the Department of Health are required to have a water
system plan. This plan includes analyses of future water demand and supply. Smaller
water systems are required to have a small water system management program (see
http://www.doh.wa.gov/ehp/dw/Programs/water_sys_plan.htm.)
Page 24 Critical Aquifer Recharge Area GuidanceThe Water System Planning Handbook (Washington State Dept. of Health, 1997) is
available on the web at http://www.doh.wa.gov/ehp/dw/Publications/newes2.pdf.
Local governments also include water planning in their comprehensive plans and must
meet water supply planning requirements under the Growth Management Act. The
Washington Department of Community, Trade, and Economic Development has written a
fact sheet called Watershed Planning that explains the link between growth management,
and watershed planning at
http://www.cted.wa.gov/DesktopModules/CTEDPublications/CTEDPublicationsView.as
px?tabID=0&alias=CTED&lang=en&ItemID=897&MId=944&wversion=Staging.
Section 4
Best Available Science
Best available science is required by the Growth Management Act and is defined by the
Washington Administrative Code. Best available science guidance has been published by
the Department of Community, Trade, and Economic Development. These sources
should be consulted to obtain a good knowledge of how the concept of best available
science functions within the Growth Management Act.
The main sources of information for requirements of the Growth Management Act and
related rules for best available science and critical areas are:
• Chapter 36.70A.172 RCW
Critical areas, designation and protection, best available science to be used.
In designating and protecting critical areas under this chapter, counties and cities shall
include the best available science in developing policies and development regulations
to protect the functions and values of critical areas. In addition, counties and cities
shall give special consideration to conservation or protection measures necessary to
preserve or enhance anadromous fisheries.
• Chapter 365-195-905 through 925 WAC
Chapter 365-195-905 WAC discusses the characteristics of a valid scientific
process.
In the context of critical areas protection, a valid scientific process is one that
produces reliable information useful in understanding the consequences of a
local government’s regulatory decisions and in developing critical areas
policies and development regulations that will be effective in protecting the
functions and values of critical areas.
The objective of including science is “to protect the functions and values of
critical areas.” Science plays a central role in delineating critical areas,
Critical Aquifer Recharge Area Guidance Page 25identifying functions and values, and recommending strategies to protect their
functions and values (OCD, 2003).
The rule goes on to list the characteristics of a valid scientific process, including peer
review, methods, logical conclusions and reasonable inferences, quantitative analysis,
context, and references. It then lists sources, including research, monitoring,
inventory, survey, modeling, assessment, synthesis, and expert opinion. This section
of the WAC is particularly applicable to Critical Aquifer Recharge Areas.
• The Critical Areas Handbook (Washington Dept. of Community Trade and
Economic Development, 2003). This Handbook is available on the internet at
http://qa.cted.wa.gov/portal/alias__CTED/lang__en/tabID__418/DesktopDefault.
aspx
See Appendix B – Resources for more information about how to obtain or access these
sources.
How best available science applies to Critical Aquifer Recharge Areas
Science for Critical Aquifer Recharge Areas involves knowledge about the occurrence
and movement of ground water.
• Identifying where “areas with a critical recharging effect on potable aquifers” are
located.
• Analyzing their physical characteristics.
• Assessing the risk for contamination.
• Evaluating effective best management practices for preventing contamination.
• Assessing the potential impacts on drinking water sources and stream flow from
groundwater withdrawals and changes in recharge.
The GMA requires best available science to be used for special consideration of
anadromous fish species. Science is used to establish where ground water affects
streams and other surface water habitats, and what the effects are.
Best available science and the functions and values of Critical Aquifer Recharge
Areas. The Growth Management Act requires protection of water quality and
quantity:
• Planning goals include water quality and availability.
RCW 36.70A.020 – Planning goals
Protect the environment and enhance the state's high quality of life, including air
and water quality, and the availability of water.
Page 26 Critical Aquifer Recharge Area Guidance• Comprehensive plans should address groundwater quality and quantity protection
in the land use element.
RCW 36.70A.070 Comprehensive plans – Mandatory Elements
The land use element shall provide for protection of the quality and quantity of
ground water used for public water supplies.
Best available science for Critical Aquifer Recharge Areas, therefore, should address
both quality and quantity.
When Should Best Available Science Be Applied?
1. Upfront, during the planning process.
Two main benefits of applying best available science upfront in the planning process
(Washington Department of Community Trade and Economic Development, 2003)
are:
• It enables understanding of where critical areas are located and how they naturally
function. This guides how best to regulate land uses that may impact critical
areas.
• Upfront planning and adoption of scientifically defensible development standards
enables decisions to be made with information that is on-hand instead of needing
to be developed for each project. This should lessen the expense and time needed
to make decisions.
2. At the time of application.
Project review may entail that the applicant provide the county or city with
information that is supported by best available science. An example would be a
hydrogeologic report. This information is especially important to evaluate projects
against performance-based standards.
Sources for Best Available Science for Critical Aquifer Recharge Areas
Groundwater scientists rely on a number of standard methods for characterizing the
occurrence and movement of ground water. These methods involve everything from
topographic maps, aerial photos, on-the-ground mapping, use of existing maps for soils
and geology, well log analysis, aquifer tests, geophysics, water quality testing, water
level measurements, monitoring well installations, testing for seepage of ground water
into streams (or from streams into ground water), and modeling.
There are also dozens of approaches to assessing groundwater vulnerability or
susceptibility to contamination in the professional literature. Pollution prevention and
best management practices for preventing contamination are widely published.
These methods have standards of practice. Some examples, just to name a few, are:
Critical Aquifer Recharge Area Guidance Page 27• Quality assurance standards for water quality sampling • Standard methods for measuring water levels • Aquifer test methods and standards • Field methods Existing Sources of Information Local government can use information that local, state or federal natural resource agencies have determined represents the best available science. They can also use information provided by a qualified scientific expert or team of qualified scientific experts. Sources that provide scientifically valid information useful for Critical Aquifer Recharge Areas include: Public water supply data and source water protection information • Well head protection zone plans • Contaminant inventories • Aquifer characterization/susceptibility rating • Well information • Water quality sampling data • System size and location • Water system plans • Studies completed for public water supply systems State, federal, local, academic, and consultant studies • USGS studies • Water supply papers • State studies • Consultant studies for local government • Consultant studies for a state-regulated facility • Academic studies Smaller jurisdictions can rely on the information generated by public water supply systems, state, and federal required studies for facilities located within their jurisdiction, and other studies as listed above. A literature review helps to document best available science for the record. Asking for volunteers in the community, technical assistance from the state, and applying for grants are ways to augment local resources. (See WAC 365- 195-910 (2)). Page 28 Critical Aquifer Recharge Area Guidance
You can also read