DISTRICT MINERAL FOUNDATION - INDICATIVE PLAN BOKARO, JHARKHAND
←
→
Page content transcription
If your browser does not render page correctly, please read the page content below
INDICATIVE PLAN
DISTRICT MINERAL FOUNDATION
      BOKARO, JHARKHAND

          Centre for Science and Environment
© 2017 Centre for Science and Environment Published by Centre for Science and Environment 41, Tughlakabad Institutional Area New Delhi 110 062 Phones: 91-11-29955124, 29955125, 29953394 Fax: 91-11-29955879 E-mail: cse@cseindia.org Website: www.cseindia.org
INDICATIVE PLAN
DISTRICT MINERAL FOUNDATION
      BOKARO, JHARKHAND

          Centre for Science and Environment
Contents
PREFACE ...............................................................................................................................................................................6
SECTION 1: INTRODUCTION AND OVERVIEW.............................................................................................. 7
SECTION 2: BACKGROUND OF THE DISTRICT.............................................................................................10
SECTION 3: SITUATION ANALYSIS THROUGH STOCK-TAKING.......................................................15
SECTION 4: SITUATION ANALYSIS THROUGH PARTICIPATORY RURAL APPRAISAL.....48
SECTION 5: PRIORITIZING ISSUES AND APPROACHES FOR INTERVENTION ...................... 56
THROUGH AN OUTCOME-OUTPUT FRAMEWORK
REFERENCES ................................................................................................................................................................. 65
5Preface
District Mineral Foundation (DMF) Rules of various states as well as Pradhan
Mantri Khanij Khestra Kalyan Yojana (PMKKKY) specify that DMFs in every
district should go through an annual planning exercise for identifying and
prioritizing projects and works to be undertaken with DMF funds. Two clear
issues have been underscored for DMF planning: districts should practice a
bottom-up planning approach involving Gram Sabhas, and intervention should
focus on certain “high priority” issues in mining-affected areas to maximize the
welfare and benefit of the affected people.
Both of these specifications are given to ensure optimal deployment of financial
resources available with DMFs for the “interest and benefit” of people affected
by mining-related operations. For this, districts need to develop DMF plans
adopting a systematic approach. This will also help to reduce ad hoc and reactive
planning, poor investments and chances of special-interest interference.
To this effect, an indicative DMF plan for Bokaro district is proposed. The
purpose of this exercise is to provide a template for identifying priorities and
setting plan targets by DMFs based on an output-outcome oriented approach,
which can be considered by the district in line with its annual district and
DMF budgets. It is also as an attempt to enable more stable investments, as the
indicative plan takes into account the opinions people from mining-affected
areas, members of Gram Panchayats/wards, civil society representatives and
officials at the block and district levels, the stakeholders who are in direct
charge of the various bits of the economy.
6INDICATIVE PLAN DISTRICT MINERAL FOUNDATION, BOKARO
Section 1: Introduction
and overview
1.1 Context of indicative District Mineral
Foundation plan
Planning and budget allocation of DMFs should happen as per provisions of
the Mines and Minerals (Development and Regulation) Act (MMDR), 1957, as
amended in 2015, and the Jharkhand DMF (Trust) Rules, 2016. The provisions
under both of these emphasize on developing human capital, making people
employable, and providing security for the future. The state DMF Rules also
specify the requirement of a planning exercise that DMFs in every district
should go through for identifying and investing on works and schemes that will
benefit the people and areas affected by mining related operations. Districts
should practice a bottom-up planning approach to understand people’s needs
and include such considerations in the DMF plan. There are also some clear
directions in the state DMF Rules, aligned with the Government of India
(GOI) scheme, the Pradhan Mantri Khanij Khestra Kalyan Yojana (PMKKKY)
guidelines, which all DMFs are required to follow while developing plans and
preparing budgets. These include:
• Undertaking a bottom-up planning approach involving Gram- Sabhas of
mining-affected areas.
• Focusing on certain “high priority areas” such as, drinking water supply,
sanitation, health, education, welfare of women and children, welfare
of aged and disabled, skill development, environment preservation and
pollution control measures.
• It has been specified that at least 60 per cent of the DMF budget should be
earmarked towards addressing and mitigating the “high priority” issues.
• Limiting allocation on physical infrastructure and other big projects which
already have funds from the state coffers.The Rules clarify that for areas
such as physical infrastructure, irrigation, energy, watershed development
etc, no more than 40 per cent of the money should be used.
Besides outlining the intervention issues, the DMF Rules and PMKKKY also
emphasize on certain important factors that should be considered in DMF
budgets:
• In the case of schemes or projects which already enjoy financial support
from the Central or the state government, the developmental and welfare
activities to be taken up by the DMF should complement those schemes
and projects. This means there is a clear need to review the status of, and
the gaps in, the Central/state schemes and projects which are operational
in the districts.
• It has been clearly mentioned that a reasonable sum of the annual receipts
should be kept as endowment fund for providing sustainable livelihood.
7The indicative DMF plan as proposed for Bokaro district, takes all of these
into consideration to provide a template for identifying issues and prioritizing
investments that can serve the best interest of the people and areas affected
by mining.
1.2 Planning approach
An ‘output and outcome’ oriented approach has been followed for developing
the indicative DMF plan. In this approach, outputs are time-bound measurable
products of investments and activities that can often be expressed in physical
terms or units. The intended outcomes are collective results of the measurable
outputs, which are qualitative improvements and sustainable over long-term.
The merit of an output and outcome oriented approach is that is ensures
“accountable, pro-active and purposeful” planning as per the defined objective
of a particular scheme. For DMF planning, this means fulfilling the objectives
of the DMF law, as well as PMKKKY, which has been aligned to DMF.
The GOI has also emphasized on such approach in the latest budget of 2017-18.
The GOI has noted that budget outlays need to be presented along with outputs
and outcomes in measurable terms, to bring in greater accountability for the
agencies involved in the execution of the schemes and projects1.
1.3 Method
The method followed for developing the indicative plan involved the following
two major steps:
i. Gap analysis of key socio-economic, human development and environmental
parameters.
ii. Prioritizing issues and identifying approaches for intervention based on
DMF objectives.
For both of these steps a bottom-up approach has been followed alongside
evaluating factual and recorded information by the government.
i. Gap analysis: The deficiencies in intervention on the priority socio
economic, human development and environmental issues in the district have
been determined through gap analysis, taking into account quantitative and
qualitative information, as well as resources. The gap analysis for various
parameters was done through the following steps:
a. Collecting data/information: Collecting data and information on various
parameters constitute of both quantitative and qualitative components.
• The quantitative part is based on a stock-taking exercise on information
pertaining to various socio-economic, human development and
environmental parameters for the district, and specifically for mining-
affected areas.
• The qualitative part is based on the approach of participatory rural
appraisal (PRA), to capture people’s perception and aspiration. The
main PRA methods used for this exercise are focus group discussions
(FGD), and semi structured interviews (SSI). For the purpose of this
8INDICATIVE PLAN DISTRICT MINERAL FOUNDATION, BOKARO
study, FGDs have been conducted through randomized sampling in
village(s)/ settlements, particularly in the mining-affected areas. With
respect to SSI, discussions/ interviews were held with district and
block officials and people in the mining-affected areas (Refer to section
4 for detail on FGD and SSI process and observations).
b. Data collation and processing: The quantitative and qualitative data/
information collected is collated and compiled in a prescribed format. The
data has also to be checked for accuracy, errors, incompleteness and gaps.
Once the data is collated, it is important to analyze the situation. The
collated data (both quantitative and qualitative) is thus used to describe the
basic characteristics/features (descriptive statistics), and to draw broader
inferences (inferential statistics).
c. Resource mapping: This involved identifying the resource envelop(s) to
address the priority issues of the district. Since districts have budgets and
allocations for every financial year, therefore the finances and allocations
for only the last financial (2016-17) has been considered to understand the
investments.
ii. Prioritizing issues and identifying approaches for intervention based on
DMF objectives: Based on the gap-analysis, finally priority issues have been
determined that DMFs need to focus on for intervention through a perspective
planning approach. This will help to address issues immediately as well as plan
for long-term investments.
Considering the output-outcome approach, a framework has been developed
as the final step of the indicative planning exercise. In the framework, against
each of the intended outcomes, a number of output factors have been identified
which are considered to be crucial for achieving the target outcomes. It is
intended that these outputs will be met through short-term, medium-term and
long-term investments to achieve the final outcome.
9Section 2: Background of
the district
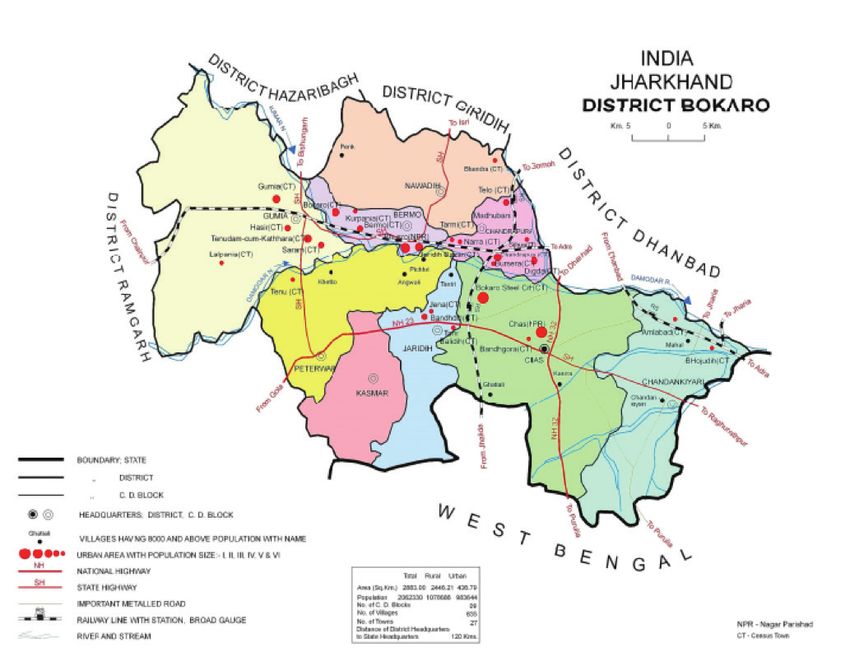
2.1 Location and geographical area
One of the 24 districts of Jharkhand, Bokaro is spread across 2,889 square
kilometers, in about 3.6 per cent of the state’s total area. It shares its boundary
with Dhanbad to the east, Ramgarh to the west and Giridih, Hazaribagh and
Dhanbad to its north. The southern boundary of the district runs along Purulia
district of West Bengal. The district lies between 23°26” to 23°57” north
latitude and 85°34” to 86°26” east latitude, and located at an elevation of 200-
546 meters from mean sea level2.
Damodar river and its tributaries flow through the district. Apart from this,
minor rivers like Kunar, Khusa and Uri and Gobei also flow in the district.
2.2 Administrative areas
The Administrative headquarter of the Bokaro district is located at Bokaro
Steel city. The district is divided into two sub-divisions – Chas and Bermo
(Tenughat). Currently there are nine administrative blocks. These include
Bermo, Chandankiyari, Chandrapura, Gomia, Petarwar, Nawadih, Chas,
Jaridih and Kasmar (See figure 1: Administrative map of Bokaro district). The
district has two municipal areas/nagar parishads, Chas and Phusro. There are a
total of 635 villages (of which 611 are inhabited), 249 gram panchayats and 27
towns in the district3.
2.3 Land use/land cover
The land use/land cover of Bokaro shows that of the total area, about 42 per
cent of the land is under active cultivation (12 per cent net sown area) or is
cultivable (fallow land). About 25 per cent is forested. A significant proportion
is also barren and wasteland, which taken together is about 17.7 per cent (See
table 1: Land use/ land cover of Bokaro district).
Land use/land cover of East Bokaro Coalfields
The East Bokaro coalfields constitute most of the mining landscape of Bokaro.
As per the mapping of the coalfields done by the Central Mine Planning
and Design Institute (CMPDI), the coalfields cover an area of about 20,266
hectares, most of which falls in Bokaro district4. As per information from the
district, about 90 per cent of the mines are operated by Central Coalfields
Limited (CCL).
The mining area constitutes about eight per cent of the coalfields. While the
predominant land use in the area is of vegetation cover (about 36 per cent), but
10INDICATIVE PLAN DISTRICT MINERAL FOUNDATION, BOKARO
Figure 1: Administrative map of Bokaro district
Source: District Census Handbook, Bokaro, 2011
Table 1: Land use/ land cover of Bokaro district
Total area
Section Area (ha)
(%)
Total geographical area 288,900
Forest area 74,182 25.67
Area under non-agriculture use 30,946 10.71
Permanent pastures and other grazing
4857 1.7
lands
Land under misc. tree crops and groves
5409 1.9
not included in net sown area
Barren and uncultured land 40,311 14
Culturable wasteland 10,547 3.7
Fallow land other than current fallow 43,703 15
Current fallow 43,819 15
Net sown area 35,218 12
Source: Department of Planning-cum-Finance, Annual Plan, 2016-17.
11most of it is covered by scrubs. Agricultural land, which is about 33 per cent, is
also majorly fallow (See table 2: Land use/land cover in East Bokaro coalfields).
Table 2: Land use/land cover in East Bokaro coalfields
Land use/land cover classes Area (ha) Total area (%)
Vegetation cover 7315 36
Mining area 155 8
Agricultural land 6787 33
Wasteland 1791 9
Water body 161 8
Settlements 1213 6
Source: CMPDI, 2015
2.4 Mining activities and mining-affected areas
Jharkhand is one of the key coal producing states in India. In 2015-2016, the
state produced more than 121 million tonnes (MT) of coal, accounting for
nearly 19 per cent of the total production in the country5. In Bokaro, the total
coal production in the last financial year was about 11.89 MT, almost all of
which (11.7 MT) came from CCL mining operations. Bokaro district’s estimated
contribution to the state’s coal production can be pegged at about 10 per cent.
As per the latest information provided by the district, Bokaro has 14 functional
coal mines, most of which are operated by CCL or its subsidiaries (See table
3: Location of mines in Bokaro district). Apart from coal, the district also has
many sand, stone and quartz quarries.
Table 3: Location of mines in Bokaro district
Block name Number of mines Name of mines
Govindpur, Jarangdih, Bermo and Bokaro
Bermo 4
colliery
Chandrapura 1 Tarmi colliery
Gomia 2 Kathara and Swang colliery
Chandankiyari 2 Parbatpur and Amlabad colliery
Nawadih 2 Gunjardih and Dhori colliery
Peterwar 3 Jarangdih, Angwali and Kargali colliery
Kasmar NIL NIL
Chas NIL NIL
Jaridih NIL NIL
Source: District mines department, Bokaro
12INDICATIVE PLAN DISTRICT MINERAL FOUNDATION, BOKARO
Mining-affected areas
The mining-affected area of Bokaro is spread across urban as well as in the rural
areas. Considering this, six blocks in the district are regarded mining-affected,
though in varied degrees. The major mining-affected area is the predominantly
urban Bermo which also has the largest concentration of coal mines. Other
areas include urban and rural parts of Chandrapura, and Gomia and rural parts
of Chandankiyari, Nawadih and Peterwar. (See table 4: Mining-affected areas
in Bokaro district).
It has to be noted that the district has currently only demarcated the villages
which are in the close vicinity of the mines. However, ground observations
suggest that many such areas have faced high displacement of the original
inhabitants. Also, many areas like Chandrapura and Chandankiyari share the
boundary with mines which fall administratively in Dhanbad. These areas have
not been accounted for as mining-affected so far.
Table 4: Mining-affected areas in Bokaro district
Block name Block affected (%)
Bermo 80
Chandrapura 70
Gomia 70
Chandankiyari 50
Nawadih 40
Peterwar 30
Kasmar NIL
Chas NIL
Jaridih NIL
Source: As per estimates provided by district mines department, Bokaro
2.5 Demographic profile
As per Census of India 2011, the population of Bokaro district is about 20 lakhs
– about 6.25 per cent of the state’s total population – of which about 52 per cent
is male and 48 per cent female. A decennial growth of nearly 16 per cent has
been observed for the district’s population in 2011 as compared to 2001 (See
table 5: Population distribution).
The demographic distribution also reveals that the district is has high
concentration of people in urban/municipal areas which is about 48 per cent
of the total population; rest 52 per cent live in rural areas of the district. The
district is also densely populated with a population density of 715 per sq km, as
compared to India’s population density of 328 (Census, 2011) and only second
to Dhanbad which is the most populated district in the state.
13Table 5: Population distribution
Total district Male Female Urban Rural SC ST
population (%) (%) (%) (%) (%) (%)
2,062,330 52 48 47.7 52.3 14.5 12.4
Sex Ratio 922
Density of Population
715
(persons per sq. km)
Total households 393,439 (rural: 206,148; urban: 188,770)
Source: Census of India, 2011
Population distribution of mining-affected areas
Among the mining-affected areas, Bermo is most urbanized, with about 96 per
cent of the people living in municipal areas. Chandrapura and Gomia are the
other two blocks with a sizeable fraction of urban population (63 per cent and
43 per cent respectively). The other affected areas have predominantly rural
population.
As per distribution across caste, while general category is predominant, but
there is considerable representation of Scheduled Caste (SC) and Scheduled
Tribes (ST) in the population. Among the mining-affected areas, Bermo and
Nawadih blocks have the highest percentage of SC population and Peterwar
the largest ST population (See table 6: Demographic profile of blocks in Bokaro
district).
Table 6: Demographic profile of blocks in Bokaro district
Block name Total Female Male SC ST Rural Urban
(no.) (%) (%) population population population population
(%) (%) (%) (%)
Bermo* 189777 47.8 52.2 14.9 6 2.2 97.8
Chandankyari 230238 48 52 25.3 8 95 5
Chandrapura 132162 48 52 11.3 8.5 37 63
Gomia 231185 48.5 51.5 12.5 20 56 43.4
Nawadih 138454 49 51 13.35 12.52 96.7 3.3
Petarwar 132150 48.5 51.5 15 29 96.5 3.43
Chas* 813402 47.4 52.6 13.5 8.1 30.6 69.4
Jaridih 104988 48 52 11 30.7 72 28
Kasmar 89974 49 51 11 15 100 –
TOTAL 2062330 48 52 14.5 12.4 52.3 47.7
Source: Census of India, 2011; *For the purpose of analysis, Phusro (NP) and Chas (NP) have been included in Bermo and Chas respectively
14INDICATIVE PLAN DISTRICT MINERAL FOUNDATION, BOKARO
Section 3: Situation
analysis through
stock-taking
The stock-taking exercise of various socio-economic, human development and
environmental parameters has been done by analyzing district and block level
data/information. The main sources of data, including contextual information,
include various Government documents and reports as published by accredited
agencies. Some key sources from where data has been obtained include-
• Census of India reports- District Census handbook, Bokaro, 2011.
• National Sample Survey (NSS) data, Ministry of Statistics and Program
Implementation.
• Socio Economic Caste Census data, Ministry of Rural Development.
• Rural Health Statistics Report (2014-15), Ministry of Health and Family
Welfare.
• District Information System for Education (DISE): School Reports
maintained by National University of Educational Planning and
Administration (NUEPA).
• Mahatma Gandhi National Rural Employment Guarantee Act
(MGNREGA) MIS Reports for districts, Ministry of Rural Development.
• District level authorities and departments- such as District Rural
Development Agency, health department, education department, water
supply and sanitation department, social welfare department etc.
• Latest reports prepared by Government, accredited institutions/agencies.
National Family Health Survey of India.
Census of India, Annual Health Survey.
Ministry of Drinking Water and Sanitation, reports on Swachh Bharat
Mission.
Central Ground Water Board (CGWB), District ground water
brochures.
3.1 Analysis of human development parameters
Human development indicators typically reflect average achievement with
respect to three key dimensions of human development. These include6:
• A long and healthy life.
• Having education and being knowledgeable.
• Having a decent standard of living.
Therefore, for a district, the key parameters of measure of human-development
include the status of public health, nutrition and concerns of food security and
livelihood of people. To ascertain the status of each of these a situation analysis
was done through stocking-taking of data/information at the district and the
block levels.
153.1.1. Public Health
Being a significant mining and industrial district of Jharkhand, Bokaro is also
one of the polluted districts with high levels of air as well as water pollution
suggests various scientific and academic studies. The Central Pollution Control
Board (CPCB) has identified Damodar river, the main source of surface
water, among the polluted river stretches (Refer to section3.3: Environmental
pollution and degradation) Interactions with the community and officials
during FGDs and SSIs reveals heavy pollution due to coal-dust and emissions
from coal based industries and its strong bearing on the health of people living
in affected areas. (Refer to section 4).
The public health and healthcare status of Bokaro district, and particularly
the mining-affected areas has been reviewed on the basis of the following key
parameters:
a. Disease prevalence.
b. Existing healthcare infrastructure in the district – primary and
secondary facilities.
c. Status of available healthcare staff – doctors, health workers etc.
Based on the situation on each of these, the overall gaps in the public healthcare
sector have been identified.
A. Review of healthcare parameters
a. Disease Prevalence
The data of disease prevalence at the district level, more so at the block
level is poor. The situation has been largely captured through both available
government data and interviews with health officials, health centre visits and
interactions with communities in mining-affected areas.
According to Annual Health Survey (2012-13), Bokaro has a high prevalence
of chronic diseases like diabetes, hypertension, tuberculosis (TB) in both rural
and urban areas, even when compared to the Jharkhand average (See table 7:
Prevalence of diseases in Jharkhand state and Bokaro district). Given the high
air pollution in the region resulting from mining and industrial emissions, the
population seems especially vulnerable to respiratory ailments such as asthma
or chronic respiratory diseases in urban areas and TB in rural areas.
The TB prevalence in the district’s rural areas is very high (254 per 1,00,000
population) when compared to the recent India average of 2117. It is to be noted
that the India average is in itself very high and is regarded as the one of the high
TB burden countries and has a Sustainable Development Goals (SDG) target
of eradicating TB by 20308. Furthermore, prevalence of other chronic diseases
such as diabetes, hypertension is extremely high in Bokaro when compared
with the state average.
During discussion, people as well as officials in mining-affected blocks reported
widespread respiratory ailments including TB, bronchitis, asthma as well as
kidney stones and skin allergies and infections.
16INDICATIVE PLAN DISTRICT MINERAL FOUNDATION, BOKARO
Table 7: Prevalence of diseases in Jharkhand state and Bokaro district
Prevalence in Jharkhand Prevalence in Bokaro district
Diseases (per 1,00,000 population) (per 1,00,000 population)
Total Rural Urban Total Rural Urban
Diabetes 802 383 1970 1608 660 2463
Hypertension 839 453 1916 1447 613 2197
Tuberculosis 307 348 192 189 254 131
Asthma/Chronic
respiratory 415 376 524 430 383 472
disease
Any kind of
7413 6536 9858 8759 7468 9923
chronic illness
Source: Annual health survey, 2012-13
Besides pulmonary diseases, incidence of water and vector-borne diseases
such diarrhoea and malaria is high, particularly among children. Data of the
Ministry of Health and Family Welfare (2017) shows that children below the
age of five years are vulnerable to these diseases9. (See table 8: Percentage of
diarrhea, dehydration and malaria in children 0-5 years of age to total reported
childhood diseases of corresponding age). Both diseases are recognized as key
factors behind child morbidity and mortality both10.
The problem is pervasive across rural and urban areas. The primary reason
for such illnesses is unavailability of clean drinking water and poor sanitation.
These conditions have a strong bearing on the development of children, as also
identified in the Global Hunger Index Report (2017). The report has clearly
identified that lack of proper sanitation has a strong effect on child health and
their nutrition absorption capacity11.
Table 8: Percentage of diarrhea, dehydration and malaria in
children 0-5 years of age to total reported childhood diseases of
corresponding age
Block name Diarrhea and dehydration (%) Malaria (%)
Bermo 79.8 18.2
Chandankiyari 100 0
Chandrapura NA NA
Gomia NA NA
Nawadih 78.9 21.1
Petarwar 26.6 70.1
Chas 70.4 15.6
Jaridih 97.9 2.1
Kasmar 55.1 29.9
Source: Ministry of Health and Family Welfare, 2017
17b. Existing healthcare infrastructure in the district – primary and
secondary facilities
Given the severity of pollution and poor health conditions of people as reported
to the researchers, the available health infrastructure, along with qualified
health staff at the facilities is critical. Considering these factors, in this section
review has been done separately for primary and secondary healthcare
facilities. Health facilities have also been seen in rural and urban context, since
requirements between these regions differ.
Primary healthcare: Health Sub Centres (HSC), Primary Health Centres (PHC)
and Community Health Centres (CHC), together constitute primary healthcare
facilities in the district.
Indian Public Health Standards (IPHS) stipulates the minimum requirements
of these public health facilities. According to IPHS, in the rural areas with plain
grounds, there should be at least one sub-centre for every 5,000 people, one
PHC per 30,000 people, and one CHC per 1,20,000 people12.
In Bokaro district, the number of CHCs when considered with regard to
the corresponding rural or urban population, are more or less as per the
IPHS standards. However, it is the HSCs and PHCs which are way short of
requirement. Considering the rural population of the district, on an average,
there is just one HSC per 14,000 people and one PHC per 98,000 people. (See
table 9: Healthcare centres in Bokaro district).
This deficit is also reflected in the requirements estimated by the district. As
per district data, about 300 more HSCs and 27 more PHCs are needed apart
from the existing ones to comfortably meet the requirements as per population.
Table 9: Healthcare centres in Bokaro district
Block name Total HSCs Total PHCs Total CHCs Sub- District
divisional hospital
hospitals
Rural areas
Chandankiyari 12 2 1
Gomia 20 3 1
Nawadih 14 3 1
3 1
Petarwar 13 1 1
Jaridih 8 1 1
Kasmar 9 1 1
Urban areas
Bermo 16 1 1
Chandrapura NIL NIL NIL
Chas 24 4 1
Source: Office of civil surgeon, Bokaro district
The situation is equally stark in urban areas. The National Urban Health Mission
(NUHM), stipulates the minimum requirements for these areas13. According
to NUHM, there should be one urban PHC (U-PHC) per 50,000- 60,000
18INDICATIVE PLAN DISTRICT MINERAL FOUNDATION, BOKARO
population in urban areas. However, in Bermo, with predominantly urban
population, there is only one U-PHC for nearly 1.85 lakh people. Additionally,
district officials reported that there is roughly one ambulance available per
block. This compounds the situation further by restricting emergency response
and referrals.
Secondary healthcare: The secondary healthcare system constitutes of sub-
district/sub-divisional hospitals and district hospital. They both constitute
important components of more specialized and comprehensive healthcare
facilities for a district’s rural as well as the urban population.
The sub-district/ sub-divisional hospitals form an important link between
HSC, PHC and CHC on one end and district hospitals on other end, and are the
first referral units for the tehsil/block population in which they are located. The
National Health Mission (NHM) also identifies these units to be significant for
bringing down the maternal mortality and infant mortality as these facilities
are meant to provide emergency obstetrics care and neonatal care14.
The district hospital on the other hand functions as a secondary level referral
centre for the public health institutions below the district level such as sub-
divisional hospitals, CHC, PHC and HSC. While all district hospitals are
required to be equipped to provide all basic specialty services, but they should
also be developed into super-specialty services gradually, particularly for bigger
districts identified in the NUHM15.
Bokaro district has three sub-divisional hospitals (SDH) and one district
hospital (DH). This means that the district has the required referral facilities.
For urban areas, these could also be points of enabling health access. However,
the man-power and resources in the hospitals is a concern and needs to be
strengthened, as discussed below.
c. Status of available healthcare staff
The healthcare staff information as obtained from official sources include
information on medical officers or doctors, staff nurses, auxiliary nurse
midwives (ANM) etc.
In Bokaro district, there is an acute shortage of doctors at both primary and
secondary healthcare facilities. Among primary healthcare facilities, PHCs are
regarded as the first port of call for a qualified doctor for people in rural areas
who are seeking healthcare and also those who are referred from sub-centres
for curative, preventive and promotive healthcare16. In Bokaro, most PHCs
are functioning with half the number of doctors. The shortage is particularly
acute in rural mining-affected areas. For example, in Gomia, there is just one
doctor for a rural population of about 1.3 lakh people, in Nawadih, there is one
doctor for every 44,600 people (See table 10: Health staff at various healthcare
facilities in Bokaro district).
The deficit is glaring even at secondary healthcare facilities, which are the
core to providing more sophisticated level of treatments. There are only 10
doctors at the district hospital against the 32 sanctioned posts reported in the
19Table 10: Health staff at various healthcare facilities in Bokaro district
HSC PHC CHC
Block name
No. of No. of No. of No. of No. of No. No. of Staff
Doctors
ANMs MPHWs ANMs MPHWs doctors ANMs Nurse
Rural areas
Chandankiyari 22 5 3 1 1 1 0 2
Gomia 24 7 1 1 1 1 0 4
Nawadih 15 5 5 1 2 1 0 4
Peterwar 16 5 1 1 2 1 0 4
Jaridih 10 4 1 0 1 1 0 9
Kasmar 11 4 2 0 0 1 0 1
Urban areas
Bermo 28 6 3 0 1 2 0 2
Chandrapura* NA NA NA NA NA NA NA NA
Chas 42 13 11 2 4 2 0 3
Sub-divisional hospital (doctors) 14
District hospital (doctors) 10
Source: Office of civil surgeon, Bokaro district;*Chandrapura is not considered as health block yet. Hence there are no separate healthcare facilities for
the block.
district data. The shortage is equally acute at the CHC level. For example, in
Chandankiyari, there are only two doctors for a population of 2.3 lakh people.
Overall, CHCs in Bokaro are functioning with only half the required number
of specialists. Besides doctors, there is also significant shortage of staff nurses.
So far, none of the CHCs in the district have a full-time staff nurse. The IPHS
norms require at least 1 staff nurse per CHC.
There is also a clear deficit of ANMs, which are the main health links for people
at primary healthcare facilties, particularly at HSCs. Mining- affected Gomia,
Peterwar and Nawadih are worse than other blocks, with just about one ANM
per HSC. IPHS standard stipulate at least two.
Also the number of multi-purpose health workers (MPHW), who are critical
to the medical edifice as they monitor and reach out as extension of the key
government health programmes for TB, malaria, leprosy etc., fall short of the
required capacity.
B. Gaps in health sector
The gaps or deficits in the health sector in the mining-affected areas shows
deficits both in infrastructure as well as resources. The key deficits include:
a. Inadequate human resources – doctors, nurses and frontline health workers.
b. Inadequate number of primary healthcare facilities.
20INDICATIVE PLAN DISTRICT MINERAL FOUNDATION, BOKARO
a. Inadequate human resources – doctors, nurses and frontline health
workers
There is a clear deficit of healthcare personnel (particularly doctor and nurses)
in the district including in mining-affected areas. The requirement, as indicated
by the sanctioned posts provided by the district, brings out this deficit very
clearly. (See table 11: Deficits in health staff Bokaro district)
The number of doctors in the district, at all levels is currently way short of
the requirement. At the DH, for instance, there is a 69 per cent deficit in the
number of doctors. At SDH and CHCs the shortfall is about 45 percent on an
average. Additionally there is 50 per cent shortfall of specialists like surgeons,
gynaecologist etc at CHCs in Bokaro.
There is also an acute crunch of staff nurses at CHCs. In the absence of full-time
staff-nurses, CHCs in the district are managing with seven contractual nurses.
At the primary health facilities, there is about 28 per cent shortage of ANMs at
HSCs and about 60 per cent deficit of multi-purpose health workers (MPHWs)
at both HSC and PHC level.
Bokaro is the only district in Jharkhand which has three sub-divisional hospitals
in addition to the district hospital, as reflected in Rural Health Statistics, 2014-
15. The analysis shows that the district also has almost adequate number of
CHCs. The infrastructure can be very effective if they have adequate, qualified
and trained healthcare personnel.
Table 11: Deficits in health staff in Bokaro district
Type of healthcare Sanctioned In-position Contractual Deficit (%)
personnel as per facility
Total number of ANMs at HSCs 232 168 - 28
Total number of MPHW at
116 49 - 58
HSCs
Total number of ANMs at PHCs 32 27 - 16
Total number of MPHW at
16 6 - 63
PHCs
Total number of sanctioned
pharmacist and lab technicians 32 11 - 66
at PHCs
Total number of staff nurse at
56 0 7 88
CHCs
Total number of ANM at CHC 16 9 6 7
Medical officers at PHCs 30 13 56
Medical officers at CHC 55 29 - 48
Specilists at CHC 16 32 - 50
Medical officers at SDH 25 14 - 44
Medical officers at DH 32 10 - 69
21b. Inadequate number of primary healthcare facilities
Considering the total rural population of about 10.8 lakh in Bokaro district,
the primary healthcare infrastructure, specifically the HSCs and PHCs, is sub-
optimal.
The primary healthcare infrastructure is particularly important for rural areas,
as it is the first point of health contact, as well as delivery and referral services
in cases of emergencies. It is also important for women and children to ensure
nutrition and health monitoring.
In rural areas, all HSCs are serving more than double their capacity. In mining-
affected Gomia, one HSC is serving more than four times the stipulated
population (See table 12: Deficits in infrastructure of primary healthcare
facilities). The situation is equally poor in other rural areas like Chandakiyari,
Nawadih and Peterwar. Similarly, the PHCs in mining-affected areas are also
over-burdened, serving about two to three times their capacity. Peculiarly worse
off are Chandankiyari and Peterwar, which are serving more than three to four
times the capacity. Ground-level interactions also back the district data (Refer
to section 4). With a high pollution and health burden, lack of primary facilities
remains a key concern for Bokaro.
In the urban context, having the minimum required number of U-PHCs
as stipulated under NUHM is crucial for the poor, as well as for extending
maternal and child benefits. In Bermo, the only U-PHC is catering to 6.2 times
its stipulated population.
Table 12: Deficits in infrastructure of primary healthcare facilities
Block name Average Serving over Average Serving over Average Serving over IPHS
people IPHS norms people IPHS norms people norms
served per (1 HSC/5000 served per (1 PHC/30,000 served per (1 CHC/1,20,000
HSC people) PHC people) CHC people)
Rural areas
Chandankiyari 18,216 2.7 109,299 3.6 218,597 1.8
Gomia 6545 4.6 43,633 1.5 130,898 1.1
Jaridih 9459 3.2 75,671 2.5 75,671 0.6
Kasmar 9997 3.0 89,974 3.0 89,974 0.7
Nawadih 9561 3.1 44,616 1.5 133,848 1.1
Petarwar 9817 2 127,617 4.3 127,617 1.1
Urban areas
Block name Average Serving over Average Serving over Average Serving over IPHS
people IPHS norms people IPHS norms people norms
served per (1 HSC/5000 served per (1 PHC/50- served per (1 CHC/2,50,000
HSC people)* PHC 60,000 CHC people)
people)
Bermo 11,600 2.6 185595 6.2 185,556 0.7
Chas 23513 1.3 141080 2.8 564319 2.3
*NUHM does not prescribe standards for HSCs. The standard for assessment has been taken as per IPHS.
22INDICATIVE PLAN DISTRICT MINERAL FOUNDATION, BOKARO
3.1.2 Nutrition and food security
With respect to nutrition and food security, the primary parameters looked at
include:
a. Infant mortality, under five mortality and malnourishment.
b. Coverage under Integrated Child Development Services.
c. Coverage under National Food Security Act.
Based on the situation of each of these, overall gaps with respect to nutrition
and food security have been identified.
A. Review of nutrition and food security parameters
a. Infant mortality, under five mortality and malnourishment
In Bokaro district, the average infant mortality rate (IMR) is 28 and under
five mortality rate (U5MR) is 38 (See table 13: IMR and U5MR for Bokaro
district). Both these indicators are worse for rural areas. The rural areas, IMR
is 35 and U5MR is 50. These parameters fall short of the country’s commitment
for Sustainable Development Goals (SDG), necessitating focused and serious
intervention. Under SDG, India’s target is to reduce U5MR to 25 by year 203017.
Table 13: IMR and U5MR for Bokaro district
Indicators Total Rural Urban
IMR 28 35 19
U5MR 38 50 24
Source: Annual health survey, 2012-13
Besides mortality indicators, child growth and development indicators are
also critical for ensuring well-being. Malnutrition is the key for assessing child
nutrition and development. Some of its main symptoms are prevalence of
stunting, wasting, low weight among children below the age of five years.
In Bokaro district, these indicators are poor, reflecting prevalence of poor
nutrition among children (See table 14: Symptoms of malnutrition among
children below five years). About 40 per cent children in the district are stunted,
close to 37 per cent are wasted and, about 50 per cent are underweight. The
data also shows that only about seven per cent children in the six to 23 months
age group receive and adequate diet18.
Table 14: Symptoms of malnutrition among children below five years
Nutritional Indicators Urban Rural Total
Children under 5 years who are stunted 32.9 45.9 39.8
Children under 5 years who are wasted 29 43.8 36.9
Children under 5 years who are severely 14.6 20.3 17.6
wasted
Children under 5 years who are under- 38.8 61.3 50.8
weight
Total children age 6-23 months receiving 8.9 6.4 7.7
an adequate diet
Source: National family health survey (NFHS), 2015-16
23Poor nutrition among children is also inextricably linked with poor nutritional
status of mothers. As per National Family Health Survey (NFHS), 2015-16,
about 30 per cent women in the 15-49 years age-group in the district have a
below normal (lower than 18.5 kg/m) body mass index (BMI) and about 73 per
cent pregnant women in the same age-group were also found to be anemic19.
b. Coverage under Integrated Child Development Services
The primary goal of Integrated Child Development Services (ICDS) as identified
by the Government of India is to reduce malnutrition and morbidity and
mortality caused by nutritional deficiencies. To achieve this, the government
identifies six services that must be assured. These include – supplementary
nutrition, health education, non-formal pre-school education, immunisation,
health check-up and monitoring and referral services. Among these, the former
three are required to be provided and supported by the network of anganwadi
centers (AWCs), while the latter three are designed to be delivered through the
primary healthcare infrastructure.
All children below the age of six years are the target group for ICDS as per
the universal coverage aim of the programme. Further, the government has
stipulated coverage norms for ICDS for this age-group. This requires that in
non-tribal areas each AWC should cover 40 beneficiaries, and in tribal areas
each AWC should cover 42 beneficiaries20.
The status of ICDS coverage and AWCs has been looked into through four
parameters – the coverage of beneficiaries under ICDS, adequacy of AWCs, staff
at AWCs and availability of basic infrastructure and facilities such as AWCs
with permanent structure, drinking water and toilet facilities within premises.
The overall coverage of ICDS beneficiaries considering children below six years
of age is low in various areas, particularly the rural parts. Among mining-
affected areas, except for Bermo, the coverage on an average is around or below
50 per cent. For example, in Chandrapura it is 45 per cent, in Nawadih 47 per
cent (See table 15: Number of AWCs and beneficiaries covered in Bokaro).
Table 15: Number of AWCs and beneficiaries covered in Bokaro
Block name No. of 0-6 Coverage of Average number of
AWCs population children 0-6 children covered per
years Anganwadi
Bermo 163 23,740 93,45 145
Chandrapura 157 18,110 8,137 115
Chandankiyari 324 36,317 19,612 112
Gomia 302 35,144 21,227 116
Nawadih 176 22,236 10,471 126
Peterwar 201 19,946 11,326 99
Chas* 669 110,068 45,161 164
Jaridih 140 15,342 8,602 109
Kasmar 124 12,883 7,030 103
Source: District social welfare department, Bokaro; Census of India, 2011; *includes B.S. City which has
otherwise been recorded separately
24INDICATIVE PLAN DISTRICT MINERAL FOUNDATION, BOKARO
Considering the basic infrastructure to deliver ICDS services, that is the AWCs,
all mining-affected areas seem to have inadequate number of AWCs when
compared against the ICDS benchmark. Considering universal coverage of all
children below six years (potential beneficiaries), on an average every AWC in
these areas need to support 2.5 to three times the number of children that the
ICDS stipulates.
Many AWCs also lack the necessary infrastructure and basic facilities, such
as having a permanent structure, drinking water facility and toilets (See table
16: Infrastructure and status of facilities in AWCs in Bokaro). For instance,
only about 60 per cent AWCs have drinking water facility. Barring Bermo, very
few AWCs have toilets and more than half the AWCs in Bokaro district are
operating without a permanent structure.
Table 16: Infrastructure and status of facilities in AWCs in Bokaro
Block name No. of AWCs with AWCs with AWCs with
AWCs permanent drinking water toilet facility
structure (%) facility (%) (%)
Bermo 163 26.3 76 72.4
Chandankiyari 324 51 67 12.7
Chandrapura 157 53.5 84 32
Gomia 302 32.5 43.7 23
Nawadih 176 51 65 32
Peterwar 201 38 35 13
Chas 669 26.5 51 9
Jaridih 140 60.7 72 41
Kasmar 124 59 76 32
Source: District social welfare department, Bokaro
Though no quantitative indicators are available, discussions with the people
in mining-affected areas as well as with district officials suggest that the
AWC staff also needs to be trained for proper nutrition education as well as
monitoring child health. Responses also point towards a limitation of AWC
meals in addressing the nutrition issues. Most responses highlight need for
nutritive enhancements in meals to tackle the issue of poor nutrition in both
children as well as expectant and new mothers (Refer to section 4).
c. Coverage under National Food Security Act
The National Food Security Act (NFSA), 2013, aims to ensure people’s access
to adequate quantity of quality food at affordable prices through public
distribution system21. In Jharkhand, The NFSA implementation has been
made more targeted through an “inclusion and exclusion” criteria notified by
the Jharkhand Food, Public Distribution and Consumer Affairs Department
in January, 2017.
The notification particularly specifies two categories as beneficiaries to cover
the vulnerable section through the targeted public distribution system (TPDS).
These include “priority households” and the Antyodaya Anna Yojana (AAY)
25households. Further there can be some other (which the notification does not
elaborate on) as identified by the state government22.
While the AAY category includes the already defined, poorest of the poor,
the notification provides detailed criteria to identify priority households. The
“priority households” include those living on alms, households without shelter,
and households of Primitive Tribal Groups (PTG). The criteria also includes
all people with 40 per cent or more disability, those suffering from incurable
diseases like AIDS, cancer, leprosy etc, widows, people above 60 years of age. All
these beneficiaries must not be employed or retired as an employee of Central
or state government, public sector undertakings (PSU), government aided
autonomous and local bodies.
For urban areas, the notification specifically includes people of certain low
earning/wage professions such as, those engaged in rag-picking, sweeping,
domestic work, unskilled labour, rickshaw-puller, painter, mechanic, mason,
plumber, tailor, security guard etc.
The notification also clarifies on who are excluded as being beneficiaries. The
exclusion criteria includes households owning a motorized four wheeler/heavy
vehicle like tractor, households with any member who is a regular employee of
Central or state government, public sector undertakings (PSU), government
aided autonomous bodies and local bodies, household with any member
owning or managing a government registered business, households with any
member paying income tax/service tax/occupational tax, households with any
member owning five acres of more of irrigated land or land more than 10 acres,
households that have an air-conditioner, refrigerator, washing machine etc., or
own a pucca house with three or more rooms.
In Bokaro, there are 13.3 lakh people covered under priority and AAY households.
This is essentially about 65 per cent of the total district population (See table 17:
Coverage under TPDS in Bokaro district). The number therefore suggests that
there is a huge section of people in the district who are economically vulnerable
and need proper social and welfare support to secure the basics.
Table 17: Coverage under TPDS in Bokaro district
Block name No. of beneficiaries under priority No. of beneficiaries
households under AAY
Bermo 83,079 3140
Chandrapura 83,447 6435
Chandankiyari 169,275 15,767
Gomia 156,511 17,084
Nawadih 115,425 11,933
Peterwar 88,340 8471
Chas* 401,288 20,858
Jaridih 63,921 10,092
Kasmar 70,473 6719
Source: Food, public distribution and consumer affairs department website, Jharkhand;* Includes BS City which
has otherwise been recorded separately.
26INDICATIVE PLAN DISTRICT MINERAL FOUNDATION, BOKARO
B. Gaps in nutrition and food security
The deficits with respect to nutrition related issues in the mining-affected
areas as identified from the analysis of the official data shows deficits both in
infrastructure as well as resources. The key deficits include:
a. Inadequate number of AWCs.
b. AWCs not having a permanent structure.
c. AWCs lacking drinking water and toilet facilities.
Considering the absolute number of AWCs, as well as availability of basic
infrastructure and facilities, there is a clear deficit in every aspect (See table 18:
Overall gap in AWC infrastructure and facilities).
a. Inadequate number of AWCs
As analyzed, on an average, AWCs in mining-affected areas on an average are
serving about three times their stipulated capacity. The fairly low coverage under
ICDS also falls in line with such deficit as discussed earlier. The coverage which
in most areas is now less than 50 per cent needs to be scaled up significantly.
Having adequate number of functional AWCs will be key to this.
b. AWCs not having a permanent structure
The data also clearly reveals that not only the number of AWCs is of concern,
but even the recorded existing ones do not have permanent structures. In
extensively affected areas such as Bermo, Gomia and even Chandrapura, about
70 per cent AWCs do not have permanent structures.
c. AWCs lacking drinking water and toilet facilities
With respect to availability of proper drinking water and toilet facilitates,
which are critical for proper functioning of AWCs and health of children, most
AWCs in the district fare poorly. For instance, in Gomia, 65 per cent AWCs lack
drinking water facilities. Similarly, barring Bermo, close to 70 per cent AWCs
in other areas lack toilet facilities. Bermo is only relatively better with about 27
per cent AWCs not having toilets.
Table 18: Overall gap in AWC infrastructure and facilities
Block name Total Coverage AWCs AWCs lack- AWCs
AWCs of children lacking ing drinking lacking
exceeding permanent water toilet
capacity structure facilities facilities
(%) (%) (%)
Bermo 163 3.5 73.7 24 27.6
Chandrapura 157 3 46.5 16 68
Chandankiyari 324 2.8 49 33 87.3
Gomia 302 2.9 67.5 56.3 77
Nawadih 176 3 49 35 68
Peterwar 201 2.5 62 65 87
Chas 669 4 73.5 49 91
Jaridih 140 2.7 39.3 28 59
Kasmar 124 2.6 41 24 68
273.1.3 Education
The education status of Bokaro district, specifically of the mining-affected
blocks has been reviewed on the basis of the following parameters:
a. Status of literacy and level of education.
b. Educational infrastructure – number of schools for various grades,
availability of basic amenities in schools such as drinking water, toilets and
electricity.
c. Current enrollment status.
d. Pupil teacher ratio (PTR).
Based on the situation of each of these, the overall gaps in the education sector
have been identified.
A. Review of educational parameters
a. Status of literacy and level of education
The overall literacy rate in Bokaro is 72 per cent, which is better than the state’s
average of 66.4 per cent and close to the national average of 74 per cent (See
table 19: Literacy in Bokaro district). Among the literate population, male
literacy is about 82 per cent, which is way higher than 60 per cent literacy
among the females. Among the scheduled groups, the literacy rate is poorer
than the overall figures. It is about 56 per cent among ST population and about
63 per cent among SC population.
Table 19: Literacy in Bokaro district
Category Total Literates SC Literates ST Literates
(%) (%) (%)
Total 72 63 56
Male 82 75 68
Female 60 50 44
Source: Census of India, 2011
Among the blocks, Bermo (including the NPs) has the highest literacy rate,
close to 79 per cent. The data shows that predominantly rural areas have lower
levels of literacy compared to the urban (See table 20: Block-wise literacy).
Table 20: Block-wise literacy
Block name Literate population out of block population (%)
Bermo 79
Chandrapura 75
Chandankiyari 64
Gomia 65
Nawadih 63
Peterwar 62
Chas 78
Jaridih 69
Kasmar 65
Source: Census of India, 2011
28INDICATIVE PLAN DISTRICT MINERAL FOUNDATION, BOKARO
Table 21: Level of education in Bokaro district
Age-group 18-19 20-39 40-59
Total Male Female Total Male Female Total Male Female
Illiterates (%) 14 9 21 28 15 41 47 29 66
Literates (%) 86 91 79 72 85 59 53 71 34
Literates without
1 1 2 3 2 3 4 3 6
education level (%)
Below primary (%) 4 4 5 6 5 8 8 7 11
Primary (%) 14 14 14 18 16 20 22 19 29
Middle (%) 17 16 17 19 19 18 19 19 19
Matric/Secondary (%) 26 27 25 17 19 18 20 21 17
Higher Secondary (%) 37 36 38 17 18 15 8 10 6
Graduate and above (%) 0 0 0 18 19 17 16 18 12
Source: Census of India, 2011; The proportion of male and female literates is calculated from their respective population.
While the percentage of literate population is high, the level of education
completion that is required for securing employment (such as at least higher
secondary or graduation level) is poor. For example, among the 72 per cent
literates in the 20-39 years age group, which is the most employable age, only
17 per cent people completed highest secondary schooling, and just about 18
per cent completed graduation or above. The proportion of literate females is
again poor in this age group, with about 59 per cent falling in the illiterate
category (See table 21: Level of education in Bokaro district).
However, the trend seems to be improving over time, though far from the
necessary development goals of education for all. For example, in the 18-19 years
age group during the same enumeration period, of the 86 per cent literates, 37
per cent had completed higher secondary education.
b. Educational infrastructure
The educational infrastructure has been evaluated with respect to some key
infrastructural issues such as number of schools of various grades and schools
with basic amenities such as tap water supply, toilet facilities and electricity.
Number of schools for various grades: Official statistics show the presence of
all levels of schools for elementary, secondary and higher secondary education.
However, the numbers of schools for various levels vary (See table 22:
Distribution of schools in Bokaro district).
In all blocks, including mining-affected areas, the number of schools providing
elementary education (primary and upper primary levels) is considerably
more than the number of secondary and higher secondary schools. During
ground level interaction as well (Refer to section 4), most people pointed out
the shortage of secondary and higher secondary schools (including their poor
accessibility due to distance), often leading to drop-outs, particularly among
females. The urban-rural divide is also apparent. Bermo and Chandrapura, for
instance, have more number of secondary schools compared to the rural areas.
29Table 22: Distribution of schools in Bokaro district
Block name Pr. Pr.+U.P. Pr.+UP+ Pr.+ U.P. U.P.+ U.P.+ Sec. H.S. Sec.+
Sec+H.S. U.P.+ Sec. Sec+ H.S.
Sec. H.S.
Bermo 58 51 5 18 0 3 0 2 2 2
Chandrapura 89 56 3 7 0 2 2 7 2 0
Chandankiyari 176 86 1 11 0 4 1 3 2 1
Gomia 202 104 4 13 0 7 1 7 2 1
Nawadih 145 61 0 7 0 3 1 2 1 1
Petarwar 163 73 0 11 0 1 2 4 3 1
Chas 323 251 28 29 0 14 3 11 13 1
Jaridih 98 64 0 7 0 1 1 5 2 1
Kasmar 119 47 0 8 0 1 1 4 1 1
Total 1373 793 41 111 0 36 12 45 28 9
Source: The DISE Report, 2015-16
Availability of basic amenities in schools – drinking water, toilet, electricity:
Guidelines under both Right to Education (RTE) Act, 2009, and Rashtriya
Madhyamik Shiksha Abhiyan (RMSA) stipulate the need for infrastructure
support to enhance access and provide quality education. Supporting
infrastructure include, having separate toilets for boys and girls at all levels of
education, availability of clean drinking water at premises and electricity supply
in schools23.
The data on these basic amenities shows that while toilets are present in most
of the schools across the district, the access to tap water and the coverage of
electricity is very limited (See table 23: Schools with tap water, toilets and
electricity facilities). Though schools in urban areas, Bermo and Chandrapura
have better access to these two, the situation is only relatively better. Very few
schools in the rural blocks have tap water and electricity.
c. Current enrolment status
The assessment of student enrolment is done through Gross Enrolment Ratio
(GER) and Net Enrolment Ratio (NER) which are two key indicators for the
number of children attending school.
GER is the number of children enrolled (irrespective of the age) at a particular
level (elementary or secondary school), in comparison to the population of the
age group who should “officially” be studying at that level. NER on the other
hand records age and education level specific enrollment. It is the number
of children enrolled belonging to a particular age group at a particular level
(elementary or secondary), in comparison to the population of the age group
who should “officially” be studying at that level.
At the elementary level, the GER and NER data shows high enrollment in all
blocks/municipal areas – GER on an average being nearly 100 per cent and
NER 96 per cent (See table 24: GER and NER at various school levels).
30You can also read