ASUTIFI NORTH DISTRICT - Amazon AWS
←
→
Page content transcription
If your browser does not render page correctly, please read the page content below
ASUTIFI NORTH DISTRICT
Copyright © 2014 Ghana Statistical Service

                    ii
PREFACE AND ACKNOWLEDGEMENT

No meaningful developmental activity can be undertaken without taking into account the
characteristics of the population for whom the activity is targeted. The size of the population
and its spatial distribution, growth and change over time, in addition to its socio-economic
characteristics are all important in development planning.
A population census is the most important source of data on the size, composition, growth
and distribution of a country’s population at the national and sub-national levels. Data from
the 2010 Population and Housing Census (PHC) will serve as reference for equitable
distribution of national resources and government services, including the allocation of
government funds among various regions, districts and other sub-national populations to
education, health and other social services.
The Ghana Statistical Service (GSS) is delighted to provide data users, especially the
Metropolitan, Municipal and District Assemblies, with district-level analytical reports based
on the 2010 PHC data to facilitate their planning and decision-making.
The District Analytical Report for the Asutifi North is one of the 216 district census reports
aimed at making data available to planners and decision makers at the district level. In
addition to presenting the district profile, the report discusses the social and economic
dimensions of demographic variables and their implications for policy formulation, planning
and interventions. The conclusions and recommendations drawn from the district report are
expected to serve as a basis for improving the quality of life of Ghanaians through evidence-
based decision-making, monitoring and evaluation of developmental goals and intervention
programmes.
For ease of accessibility to the census data, the district report and other census reports
produced by the GSS will be disseminated widely in both print and electronic formats. The
report will also be posted on the GSS website: www.statsghana.gov.gh.
The GSS wishes to express its profound gratitude to the Government of Ghana for providing
the required resources for the conduct of the 2010 PHC. While appreciating the contribution
of our Development Partners (DPs) towards the successful implementation of the Census, we
wish to specifically acknowledge the Department for Foreign Affairs, Trade and
Development (DFATD) formerly the Canadian International Development Agency (CIDA)
and the Danish International Development Agency (DANIDA) for providing resources for
the preparation of all the 216 district reports. Our gratitude also goes to the Metropolitan,
Municipal and District Assemblies, the Ministry of Local Government, Consultant Guides,
Consultant invaluable support during the report writing exercise. Finally, we wish to thank all
the report writers, including the GSS staff who contributed to the preparation of the reports,
for their dedication and diligence in ensuring the timely and successful completion of the
district census reports, Editors, Project Steering Committee members and their respective
institutions for their.

Dr. Philomena Nyarko
Government Statistician
                                              iii
TABLE OF CONTENTS
PREFACE AND ACKNOWLEDGEMENT ....................................................................... iii
LIST OF TABLES ................................................................................................................. vi
LIST OF FIGURES .............................................................................................................. vii
ACRONYMS AND ABBREVIATIONS ............................................................................ viii
EXECUTIVE SUMMARY ................................................................................................... ix
CHAPTER ONE: INTRODUCTION ...................................................................................1
1.1 Background ................................................................................................................. 1
1.2 Physical Features ......................................................................................................... 2
1.3 Political and Administrative Structure ........................................................................ 2
1.4 Social and Cultural structure ....................................................................................... 4
1.5 Economy...................................................................................................................... 4
1.6 Census Methodology, Concepts and Definitions ........................................................ 5
1.7 Organization of the Report ........................................................................................ 15
CHAPTER TWO: DEMOGRAPHIC CHARACTERISTICS.........................................16
2.1 Introduction ............................................................................................................... 16
2.2 Population Size and Distribution .............................................................................. 16
2.3 Age and Sex Structure ............................................................................................... 17
2.4 Fertility, Mortality And Migration ............................................................................ 18
CHAPTER THREE: SOCIAL CHARACTERISTICS ....................................................25
3.1 Introduction ............................................................................................................... 25
3.2 Household Size, Composition and Headship ............................................................ 25
3.3 Marital Status ............................................................................................................ 27
3.4 Nationality ................................................................................................................. 32
3.5 Religious Affiliation .................................................................................................. 32
3.6 Literacy and Education.............................................................................................. 33
CHAPTER FOUR: ECONOMIC CHARACTERISTICS ...............................................36
4.1 Introduction ............................................................................................................... 36
4.2 Economic Activity Status .......................................................................................... 36
4.3 Occupation ................................................................................................................ 38
4.4 Industry of Employment............................................................................................ 39
4.5 Employment Status ................................................................................................... 41
4.6 Employment Sector ................................................................................................... 42
CHAPTER FIVE: INFORMATION COMMUNICATION TECHNOLOGY ..............43
5.1 Introduction ............................................................................................................... 43
5.2 Ownership of Mobile Phones .................................................................................... 43
5.3 Use of Internet ........................................................................................................... 43
5.4 Household Ownership of Desktop or Laptop Computer ........................................... 44
CHAPTER SIX: DISABILITY ...........................................................................................45
6.1 Introduction ............................................................................................................... 45
6.2 Population with disability and locality ...................................................................... 45
6.2 Disability and Economic Activity ............................................................................. 46
iv6.3 Disability by Type of Locality .................................................................................. 47
6.4 Disability and Education ........................................................................................... 48
CHAPTER SEVEN: AGRICULTURAL ACTIVITIES ...................................................50
7.1 Introduction ............................................................................................................... 50
7.2 Households and non-households in agriculture ........................................................ 50
7.3 Households in Agriculture ........................................................................................ 50
7.4 Type of livestock numbers and keepers .................................................................... 51
CHAPTER EIGHT: HOUSING CONDITIONS ...............................................................53
8.1 Introduction ............................................................................................................... 53
8.2 Housing Stock ........................................................................................................... 53
8.3 Type of Dwelling, Holding and Tenancy Arrangement ............................................ 53
8.4 Construction Materials .............................................................................................. 55
8.5 Room Occupancy ...................................................................................................... 57
8.7 Main source of cooking fuel and cooking space used by households ....................... 59
8.8 Main Source of Water for Drinking and for other Domestic Use ............................. 60
8.9 Bathing and Toilet Facilities ..................................................................................... 61
8.10 Method of Waste Disposal .................................................................................... 63
CHAPTER NINE: SUMMARY OF FINDING, CONCLUSIONS AND
RECOMMENDATIONS ....................................................................65
9.1 Summary of Findings and Conclusions .................................................................... 65
9.2 Conclusion................................................................................................................. 66
9.3 Policy Implications .................................................................................................... 67
REFERENCES .......................................................................................................................69
APPENDICES ........................................................................................................................70
LIST OF CONTRIBUTORS ................................................................................................72
vLIST OF TABLES
Table 2.1: Population by age, sex and type of locality .........................................................17
Table 2.2: Total fertility rate, general fertility rate and crude birth rate by district ..............19
Table 2.3: Female population 12 years and older by age, children ever born, children
surviving and sex of child ....................................................................................20
Table 2.4: Total population, deaths in households and crude death rate, by District ...........21
Table 2.5: Causes of death ....................................................................................................23
Table 2.6: Birthplace by duration of residence of migrants................................................24
Table 3.1: Household size by locality ...................................................................................25
Table 3.2: Household population by composition and sex ...................................................26
Table 3.3: Household population by structure and sex .........................................................27
Table 3.4: Persons 12 years and older by sex, age-group and marital status........................28
Table 3.5: Persons 12 years and older by sex, marital status and level of education ...........30
Table 3.6: Persons 12 years and older by sex, marital status and economic activity status .31
Table 3.7: Population by nationality and sex ........................................................................32
Table 3.8: Population by religion and sex ............................................................................33
Table 3.9: Population 11 years and older by sex, age and literacy status .............................33
Table 3.10: Population three years and older by level of education, school attendance ........35
Table 4.1: Population 15 years and older by activity status and sex ...................................37
Table 4.3: Employed population 15 years and older by occupation and sex .......................39
Table 4.4: Employed population 15 years and older by industry and sex ...........................40
Table 4.5: Employed population 15 years and older by employment status and sex ..........42
Table 4.6: Employed population 15 years and older by employment sector and sex ........42
Table 5.1: Population 12 years and older by mobile phone ownership, internet facility
usage and sex .....................................................................................................43
Table 5.2: Households having desktop/laptop computers and sex of head ........................44
Table 6.1: Population by type of locality, disability type and sex .......................................46
Table 6.2: Persons 15 years and older with Disability by Economic Activity Status .........47
Table 6.5: Population 3 years and older by sex, disability type and level of education ......49
Table 7.1: Households by agricultural activities and locality ..............................................51
Table 8.1: Stock of houses and households by type of locality ...........................................53
Table 8.3: Type of occupied dwelling unit by sex of household head and type of locality 55
Table 8.4: Main construction material for outer wall of dwelling unit by type of locality .56
Table 8.5: Main construction materials for the floor of dwelling unit by type of locality ..56
Table 8.6: Main construction material for roofing of dwelling unit by type of locality ......57
Table 8.8: Main source of lighting of dwelling unit by type of locality ..............................58
Table 8.9: Main source of cooking fuel used by households ...............................................59
Table 8.10: Main cooking space used by households ............................................................60
viTable 8.11: Main source of water of dwelling unit for drinking ...........................................61
Table 8.12: Bathing facility used by household.....................................................................62
Table 8.13: Toilet facilities used by household .....................................................................62
Table 8.14: Method of solid waste disposal by locality.........................................................63
Table 8.15: Method of liquid waste disposal by locality .......................................................64
Table A1: Population by sex, number of households and houses in the20 largest
communities ........................................................................................................70
Table A2: Population by age group in the 20 largest communities .....................................71
LIST OF FIGURES
Figure 1.1: Map of Ho Municipal ............................................................................................3
Figure 2.1: Population pyramid of Asutifi North...................................................................18
Figure 2.2: Reported age specific death rate by sex ..............................................................22
Figure 3.1: Population 12 years and older by sex and marital status .....................................29
Figure 4.1: Employed population 15 years and older by Industry and sex............................41
Figure 6.2: Type of Disability by locality ..............................................................................48
Figure 7.1: Agricultural and Non-Agricultural households by locality .................................50
Figure 8.1: Main source of lighting .......................................................................................59
viiACRONYMS AND ABBREVIATIONS
CBR Crude Birth Rate
CDR Crude death Rate
CEB Children Ever Born
CS Children Surviving
CHIPS Community Health Planning Services
ECOWAS Economic Community of West African States
EA Enumeration Area
GFR General Fertility Rate
GSS Ghana Statistical Service
ICT Information Communication Technology
JSS Junior Secondary School
JHS Junior High School
SSS Senior Secondary School
SHS Senior High School
MDGs Millennium Development Goals
NDPC National Development Planning Commission
NGOs Non-governmental Organizations
PWDs Persons With Disabilities
TFR Total Fertility Rate
UNDP United Nations Development Programme
WC Water Closet
PHC Population and Housing Census
viiiEXECUTIVE SUMMARY
Introduction
The district census report is the first of its kind since the first post-independence census was
conducted in 1960. The report provides basic information about the district. It gives a brief
background of the district, describing its physical features, political and administrative
structure, socio-cultural structure and economy. Using data from the 2010 Population and
Housing Census (2010 PHC), the report discusses the population characteristics of the district,
fertility, mortality, migration, marital status, literacy and education, economic activity status,
occupation, employment; Information Communication Technology (ICT), disability,
agricultural activities and housing conditions of the district. The key findings of the analysis are
as follows (references are to the relevant sections of the report).
Population size, structure and composition
The population of the Asutifi North district, according to the 2010 Population and Housing
Census, is 52,259 representing 2.7 percent of the region’s total population. Males constitute
51.2 percent and females represent 49.8 percent. Nearly seventy (67.8%) percent of the
population is rural. The district has a sex ratio of 105.0. The population of the district is
youthful (49.8%) depicting a broad base population pyramid which tapers off with a small
number of elderly persons (6.7%). The total age dependency ratio for the District is 77.8, the
age dependency ratio for males is less (77.6) than that of females (71.9).
Fertility, mortality and migration
The Total Fertility Rate for the district 4.3. The General Fertility Rate is 126.6 births per 1000
women aged 15-49 years which is among the highest for the region. The Crude Birth Rate
(CBR) is 30.7 per 1000 population. The crude death rate for the district is 8.8 per 1000. The
death rate for males is highest for age 70 and above representing 50 deaths per 1000 population
while for the females, the highest death rate of 30 deaths per 1000 population is for ages 65-69.
Accident/violence/homicide/suicide accounted for 6.7 percent of all deaths while other causes
constitute 93.2 percent of deaths in the district. Migrants representing (12.8 percent) living in
the district were born in another region while almost 27.2 percent were born elsewhere in the
Region.
Household Size, composition and structure
The district has a household population of 51,524 with a total number of 12,138 households.
The average household size in the district is 4.2 persons per household. Children constitute the
largest proportion of the household members accounting for 44.1 percent. Spouses form about
11.4 percent. Nuclear households (head, spouse(s) and children) constitute 33.0 percent of the
total number of households in the district.
Marital status
About four in ten (46.3%) of the population aged 12 years and older are married, 37.9 percent
have never married, 6.5 percent are in consensual unions, 3.4 percent are widowed, 3.9
percent are divorced and 1.7 percent are separated. By age 25-29 years, more than 61.8
percent of females are married compared to nearly forty percent (38.5%) of males. At age 65
ixand above, widowed females account for as high as 50.37 percent while widowed males
account for only 7.7 percent. . Among the married, 33.2 percent have no education while
about 10.2 percent of the unmarried have never been to school. More than eighty percent
(83.0%) of the married population are employed, 3.5 percent are unemployed and 13.5
percent are economically not active. A greater proportion of those who have never married
(63.5%) are economically not active with 5.1 percent unemployed.
Nationality
The proportion of Ghanaians by birth in the district is 94.3 percent. Those who have
naturalised constitute 0.8 percent and the non-Ghanaian population in the district is 2.6
percent.
Literacy and education
Of the population 11 years and above, 76.3 percent are literate and 23.7 percent are non-
literate. The proportion of literate males is lesser (41.8 %) than that of females (58.2%).
Seven out of ten people (75.0%) indicated they could speak and write both English and
Ghanaian languages. Of the population aged 3 years and above currently attending school in
the district account for 51.1 percent with those who attended in the past being 49.9 percent.
Economic Activity Status
About 72.9 percent of the population aged 15 years and older are economically active while
27.1 percent are economically not active. Of the economically active population, 93.5 percent
are employed while 6.5 percent are unemployed. For those who are economically not active,
a larger percentage of them are students (47.6%), 31.1% perform household duties and 3.8
percent are disabled or too sick to work. Six out of ten (67.3%) unemployed are seeking work
for the first time.
Occupation
Of the employed population, about 58.0 percent are engaged as skilled agricultural, forestry
and fishery workers, 11.2 percent in service and sales, 10.4 percent in craft and related trade,
and 6.5 percent are engaged as managers, professionals, and technicians.
Employment status and sector
Of the population 15 years and older 66.6 percent are self-employed without employees, 17.5
as employees, 8.6 percent are contributing family workers, 2.3 percent are casual workers and
0.5 percent are domestic employees (house helps). Overall, men constitute the highest
proportion in each employment category except self-employed without employees and the
contributing family workers. The private informal sector is the largest employer in the
district, employing 80.0 percent of the population followed by the private informal sector
with 13.1 percent.
Information Communication Technology
Of the population 12 years and above, 44.0 percent have mobile phones. Males who own
mobile phones constitute 49.2 percent as compared to 38.6 percent of females. A little over
three percent (3.7%) of the population 12 years and older use internet facilities in the district.
Only 621 households representing 5.1 percent of the total households in the district have
desktop/laptop computers.
xDisability
About 2.4 percent of the district’s total population has one form of disability or the other. The
proportion of the female population with disability is slightly lesser (2.3%) than males
(2.4%). The types of disability in the district include sight, hearing, speech, physical,
intellect, and emotion. Persons with sight disability recorded the highest of 36.4 percent
followed by physical disability (26.1%). About 2.5 percent of the population with disability
are in the rural localities. There are more females with sight disability (38.1%) in both urban
and rural areas in the district. Of the population disabled, 37.7 percent have never been to
school.
Agriculture
As high as 66.1 percent of households in the district are engage in agriculture. The
distribution of agricultural households by locality shows there are more households into
agriculture in the rural areas than the urban areas (80.2%). Most households in the district
(64.9%) are involved in crop farming. Poultry (chicken) is the dominant animal reared in the
district
Housing
The housing stock of the Asutifi North district is 7,923 representing 2.4 percent of the total
number of houses in the Brong Ahafo Region. The average number of persons per house is
6.6.
Type, tenancy arrangement and ownership of dwelling units
Over half (65.7%) of all dwelling units in the district are compound houses; 24.3 percent are
separate houses and 6.0 percent are semi-detached houses. More than half (53.7%) of the
dwelling units in the district are owned by members of the household; 21.8 percent are owned
by private individuals; 15.5 percent are owned by a relative who is not a member of the
household and only 2.0 percent are owned by public or government. A little over one percent
(1.1%) of the dwelling units is owned through mortgage schemes.
Material for construction of outer wall, floor and roof
The main construction material for outer walls of dwelling units in the district is cement
block/concrete accounting for 48.3 percent with mud bricks constituting 45.4 percent of outer
walls of dwelling units in the district. Cement (69.8%) and mud/earth (28.6%) are the two
main materials used in the construction of floors of dwelling units in the district. Metal sheets
are the main roofing material (91.7 %) for dwelling units in the district.
Room occupancy
One room constitutes the highest percentage (91.9%) of sleeping rooms occupied by
households in housing units in the district. About 10.5 percent of households with 10 or more
members occupy single rooms.
Utilities and household facilities
The three main sources of lighting in dwelling units in the district are electricity main
(47.6%), flashlight/torch (42.6%) and kerosene lamp (8.2%). The main source of fuel for
cooking for most households in the district is wood (57.6%). The proportion for rural (74.1%)
xiis higher than that of urban (27.2%). The four main sources of water in the district are
borehole 34.4 percent, public tap or standpipe 22.7 percent, pipe-borne outside the dwelling
14.8 percent and river stream 7.2 percent. About a third of households (37.1%) water from
boreholes for other domestic purposes.
The most important toilet facility used in the district is (WC/KVIP/PIT/PAN etc.) accounting
for (50.5%) for both the urban and rural areas respectively. About 4.3 percent of the
population in the district has no toilet facility. A third of households (36.5%) in the district
share separate bathrooms in the same house while 26.3 percent own bathrooms for their
exclusive use.
Waste disposal
The most widely method of solid waste disposal is by public dump in the open space
accounting for 55.7 percent. About one in ten households (19.9%) dump their solid waste
indiscriminately. House to house waste collection accounts for 3.3 percent. For liquid waste
disposal, throwing waste onto the compound (46.4%) and onto the street (41.0%) are the two
most common methods used by households in the district.
xiiCHAPTER ONE
INTRODUCTION
The Government of Ghana has recognized that the country’s population is the nation’s
greatest asset. The population is both the instrument and objective of all development efforts.
The Government therefore, has responsibility towards its protection and enhancement of the
quality of life (Government of Ghana, 1969). Government also explicitly recognized the
reciprocal relationship between population and development (i.e. population affects
development even as development affects population. An understanding of the population, its
characteristics and dynamics, is therefore crucial for realistic development planning.
The Government of Ghana has formulated and implemented a decentralized local
government system since 1988 with the district assemblies as the focal point for
development. The District Assembly is expected to initiate and coordinate the processes of
planning, programming, budgeting and implementation of District plans, programmes and
projects to ensure development. Each district assembly is expected to produce medium and
long term development plan to meet the needs and aspirations of the population. They are
also mandated to generate revenues by charging fees and levies.
The overall level of development and demographic structure of the country conceals
differences between and within regions, districts, urban and rural localities. As such, there are
bound to be differences in the population and development needs and priorities between and
within regions, districts, urban and rural localities.
The report covers the Asutifi North District of the Brong Ahafo Region and its cardinal
objective is to make available to decision makers, planners, researchers, and the general
public, analysis of the results of the 2010 Population and Housing Census (PHC) and their
full implication for policy and planning in the District.
This chapter focuses on the profile of the District. It further discusses the physical features
including location, size, relief, drainage, climate, vegetation, geology and soils in the District.
In addition, it covers the socio-cultural characteristics of the population, administrative and
political structure as well as social and economic infrastructural facilities. Finally, the chapter
discusses the methodology employed in conducting the 2010 PHC and definition of the
concepts used.
1.1 Background
In 1989 the Asutifi District was established and it was split into two districts namely, Asutifi
North and South in 2012. Thus, the Asutifi North District with Kenyasi as the capital was
carved out of the former Asutifi District by Legislative Instrument 2093 of 2012 (Republic of
Ghana, 2012).
The Assembly’s vision is to become a highly professional local government body responsible
for the provision of District services such as education, water, health, and sanitation with
other development partners and consolidate agriculture as the leading productive sector while
supporting the development of other economic activities with the core purpose of improving
the living conditions of the people in the District.
11.2 Physical Features
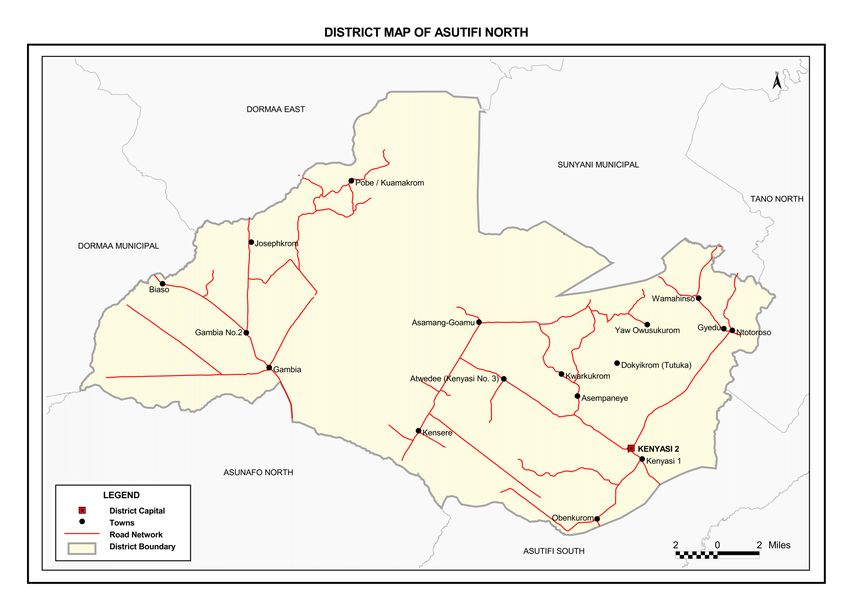
1.2.1 Location and Size
Asutifi North District is located between latitudes 6°40' and 7°15' North and Longitudes
2°15' and 2°45' West. It shares boundaries with Sunyani Municipal in the North, Tano South
District to the North East, Dormaa East District to North West, Asutifi South District to the
west, Asunafo North and South Districts in the South West and Ahafo Ano South and North
Districts (Ashanti Region) in the South East. With a total land surface area of 1,500 square
kilometres, the District is one of the smallest in the Brong Ahafo. The urban forms thirty two
percent of the District while rural constitute seventy eight percent. The land size of the
Asutifi North District is 936.31 square kilometers.
1.2.2 Climate and Vegetation
The District lies within the Wet Semi-Equatorial Zone marked by double rainfall maxima
with a mean annual rainfall between 125cm and 200cm. The main rainy season is from May
to July with the peak (maximum) in June, and the minor rainy season is from September to
October with its peak (minimum) in October when the District comes under the influence of
the Wet Maritime Air Mass. The beginning of the rainy season is marked by heavy
thunderstorms which sometimes cause the ripping-off of building roofs, trees and crops like
Plantain and Banana. There is a sharp dry season between the two rainy seasons (August).
Relative humidity is generally high ranging from 75 percent to 80 percent during the two
rainy seasons and seventy percent (70%) to eighty percent (80%) during the rest of the year.
The District is located in the Moist Semi-Deciduous Forest Belt and the nature of the land is
water-logged in many places. Human activities notably farming, lumbering and occasional
bush fires have however disturbed this vegetation. This has transformed the forest in some
areas into a derived wooded savannah. Such transitional zones could be observed along
Kenyasi to Goamu-Koforidua. Notwithstanding, there are large areas of forest reserves.
These include the following: Biaso shelter belt, Bia Tam, Asukese, Goa and Desiri Forest
Reserves. These forest reserves together cover a total of about 475.63 square kilometers
representing 31.7 percent of the entire land surface area of the District.
1.3 Political and Administrative Structure
The Asutifi North District Assembly is the highest political and administrative body in the
District. As mandated by the Local Government Act, (Act 462 of 1993), the Assembly
exercises deliberative, legislative and executive functions (Republic of Ghana, 1993). The
Assembly comprises the District Chief Executive (DCE), Presiding Member, Member of
Parliament, and Assembly Members (Republic of Ghana, 1992). The District is under the
leadership of a District Chief Executive who is appointed by the President and approved by
majority of the Assembly Members. DCE is supported by the District Coordinating Director
and a team of administrative and technical officers who operate the central and decentralized
units. The Asutifi North District has one constituency and 36 Electoral areas. There are 36
Assembly Members who are elected by universal adult suffrage to represent the various
Electoral Areas in the District. In addition, there are 11 Assembly Members appointed by the
government bringing the total number of Assembly Members to 25. General meetings are
held at least three times in a year during which policies and programs are determined.
2Figure 1.1: Map of Ho Municipal
Source: Ghana Statistical Service, GIS
31.4 Social and Cultural structure
The District has two paramountcies and one divisional council which are Kenyasi No.1 and
Kenyasi No.2 Traditional Councils; and Ntotroso Divisional Council. The indigenes are
predominantly Akans who speak mainly Asante Twi and are largely Christians. Among the
minor ethnic groups in the District are the Ewes, Wangaras, Dagombas and Kusase who
constitute about 35.0 percent of the population. The peaceful co-existence of the residents is
welcomed as the likelihood of ethnic conflicts is minimized. The District is well noted for the
annual Apomasu Festival which is celebrated in every first quarter of the year by the Chiefs
and people of Ntotroso.
The District has one FM station known as Anapua FM and a host of community information
centers.
1.5 Economy
The District economy is mostly agrarian with most of them being peasant farmers who
largely depend on rudimentary methods of farming. Cocoa, Coffee, Oil palm, and Cashew are
the major cash crops in the District with plantain, cassava cocoyam and maize being the food
crops.
There are a number of financial institutions in the District which basically help the citizenry
to mobilize funds through savings and investment packages and also deal with their financial
needs in times of difficulty by making loan facilities accessible. With the presence of these
financial institutions, notably; EcoBank, Agricultural Development Bank (ADB), Tano Rural
Bank, Asutifi Rural Bank, and Ahafo Community Bank, traders and tourists alike do not have
to carry large sums of money when travelling to the District.
1.5.2 Tourism
The operations of Newmont Gold Ghana in the district do not only provide employment but
also offer persons who would like to know about gold exploration, the opportunity to visit the
District.
1.5.3 Economic Potential
The water log nature of the land is viable for the cultivation of rice and fish farming. Again,
with the discovery of mineral deposits, especially gold in the District, investors in the mining
industry frequent the district to explore for opportunities. Notwithstanding, the quarry waste
from the mining activities provides an avenue for potential entrepreneurs to enter the quarry
waste industry. By so doing, they acquire these wastes to further sell or use for construction
work.
1.5.4 Social Infrastructure/Amenities
The District has educational facilities for basic and second cycle institutions. There are over
one hundred elementary schools district-wide with two second cycle institutions; Ola Girls
Senior High School and Gyamfi Kumani Senior High School situated at Kenyasi and
Wamahinso respectively.
4With respect to health care facilities, the Asutifi North District has a Health Centre and a
private maternity home located at Kenyasi No 1. There are also three Community-based
Health Planning and Services (CHPS) compounds in Biaso, Goamu, Yawusukrom-
Koforidua.
1.6 Census Methodology, Concepts and Definitions
1.6.1 Introduction
Ghana Statistical Service (GSS) was guided by the principle of international comparability
and the need to obtain accurate information in the 2010 Population and Housing Census
(2010 PHC). The Census was, therefore, conducted using all the essential features of a
modern census as contained in the United Nations Principles and Recommendations for
countries taking part in the 2010 Round of Population and Housing Censuses.
Experience from previous post independence censuses of Ghana (1960, 1970, 1984 and 2000)
was taken into consideration in developing the methodologies for conducting the 2010 PHC.
The primary objective of the 2010 PHC was to provide information on the number,
distribution and social, economic and demographic characteristics of the population of Ghana
necessary to facilitate the socio-economic development of the country.
1.6.2 Pre-enumeration activities
Development of census project document and work plans
A large scale statistical operation, such as the 2010 Population and Housing Census required
meticulous planning for its successful implementation. A working group of the Ghana
Statistical Service prepared the census project document with the assistance of two
consultants. The document contains the rationale and objectives of the census, census
organisation, a work plan as well as a budget. The project document was launched in
November 2008 as part of the Ghana Statistics Development Plan (GSDP) and reviewed in
November 2009.
Census secretariat and committees
A well-structured management and supervisory framework that outlines the responsibilities
of the various stakeholders is essential for the effective implementation of a population and
housing census. To implement the 2010 PHC, a National Census Secretariat was set up in
January 2008 and comprised professional and technical staff of GSS as well as staff of other
Ministries, Departments and Agencies (MDAs) seconded to GSS. The Census Secretariat was
primarily responsible for the day-to-day planning and implementation of the census activities.
The Secretariat had seven units, namely; census administration, cartography, recruitment and
training, publicity and education, field operations and logistics management, data processing,
and data analysis and dissemination.
The Census Secretariat was initially headed by an acting Census Coordinator engaged by the
United Nations Population Fund (UNFPA) in 2008 to support GSS in the planning of the
Census. In 2009, the Census Secretariat was re-organised with the Government Statistician
as the National Chief Census Officer and overall Coordinator, assisted by a Census
Management Team and a Census Coordinating Team. The Census Management Team had
oversight responsibility for the implementation of the Census. It also had the responsibility of
taking critical decisions on the census in consultation with other national committees. The
5Census Coordinating Team, on the other hand, was responsible for the day-to-day
implementation of the Census programme.
A number of census committees were also set up at both national and sub-national levels to
provide guidance and assistance with respect to resource mobilization and technical advice.
At the national level, the committees were the National Census Steering Committee (NCSC),
the National Census Technical Advisory Committee (NCTAC) and the National Census
Publicity and Education Committee (NCPEC). At the regional and municipal levels, the
committees were the Regional Census Implementation Committee and the Municipal Census
Implementation Committee, respectively.
The Regional and Municipal Census Implementation Committees were inter-sectoral in their
composition. Members of the Committees were mainly from decentralized departments with
the Regional and Municipal Coordinating Directors chairing the Regional Census
Implementation Committee and Municipal Census Implementation Committee, respectively.
The Committees contributed to the planning of Municipal, community and locality level
activities in areas of publicity and field operations. They supported the Regional and
Municipal Census Officers in the recruitment and training of field personnel (enumerators
and supervisors), as well as mobilizing logistical support for the census.
Selection of census topics
The topics selected for the 2010 Population and Housing Census were based on
recommendations contained in the UN Principles and Recommendations for 2010 Round of
Population and Housing Censuses and the African Addendum to that document as well as the
needs of data users. All the core topics recommended at the global level, i.e., geographical
and internal migration characteristics, international migration, household characteristics,
demographic and social characteristics such as age, date of birth, sex, and marital status,
fertility and mortality, educational and economic characteristics, issues relating to disability
and housing conditions and amenities were included in the census.
Some topics that were not considered core by the UN recommendations but which were
found to be of great interest and importance to Ghana and were, therefore, included in the
2010 PHC are religion, ethnicity, employment sector and place of work, agricultural activity,
as well as housing topics, such as, type of dwelling, materials for outer wall, floor and roof,
tenure/holding arrangement, number of sleeping rooms, cooking fuel, cooking space and
Information Communication Technology (ICT).
Census mapping
A timely and well implemented census mapping is pivotal to the success of any population
and housing census. Mapping delineates the country into enumeration areas to facilitate
smooth enumeration of the population. The updating of the 2000 Census Enumeration Area
(EA) maps started in the last quarter of 2007 with the acquisition of topographic sheets of all
indices from the Survey and Mapping Division of the Lands Commission. In addition, digital
sheets were also procured for the Geographical Information System Unit.
The Cartography Unit of the Census Secretariat collaborated with the Survey and Mapping
Division of the Lands Commission and the Centre for Remote Sensing and Geographic
Information Services (CERSGIS) of the Department of Geography and Resource
Development, University of Ghana, to determine the viability of migrating from analog to
6digital mapping for the 2010 PHC, as recommended in the 2000 PHC Administrative Report.
Field cartographic work started in March 2008 and was completed in February 2010.
Development of questionnaire and manuals
For effective data collection, there is the need to design appropriate documents to solicit the
required information from respondents. GSS consulted widely with main data users in the
process of the questionnaire development. Data users including MDAs, research institutions,
civil society organisations and development partners were given the opportunity to indicate
the type of questions they wanted to be included in the census questionnaire.
Documents developed for the census included the questionnaire and manuals, and field
operation documents. The field operation documents included Enumerator’s Visitation
Record Book, Supervisor’s Record Book, and other operational control forms. These record
books served as operational and quality control tools to assist enumerators and supervisors to
control and monitor their field duties respectively.
Pre-tests and trial census
It is internationally recognized that an essential element in census planning is the pre-testing
of the questionnaire and related instructions. The objective of the pre-test is to test the
questionnaire, the definition of its concepts and the instructions for filling out the
questionnaire.
The census questionnaire was pre-tested twice in the course of its development. The first pre-
test was carried out in March 2009 to find out the suitability of the questions and the
instructions provided. It also tested the adequacy and completeness of the responses and how
respondents understood the questions. The second pre-test was done in 10 selected
enumeration areas in August, 2009. The objective of the second pre-test was to examine the
sequence of the questions, test the new questions, such as, date of birth and migration, and
assess how the introduction of ‘date of birth’ could help to reduce ‘age heaping’. With regard
to questions on fertility, the pre-tests sought to find out the difference, if any, between proxy
responses and responses by the respondents themselves. Both pre-tests were carried in the
Greater Accra Region. Experience from the pre-tests was used to improve the final census
questionnaire.
A trial census which is a dress rehearsal of all the activities and procedures that are planned
for the main census was carried out in October/November 2009. These included recruitment
and training, distribution of census materials, administration of the questionnaire and other
census forms, enumeration of the various categories of the population (household,
institutional and floating population), and data processing. The trial census was held in six
selected Municipals across the country namely; Saboba (Northern Region), Chereponi
(Northern Region), Sene (Brong Ahafo Region), Bia (Western Region), Awutu Senya
(Central Region), and Osu Klottey Sub-Metro (Greater Accra Region). A number of factors
were considered in selecting the trial census Municipals. These included: administrative
boundary issues, ecological zone, and accessibility, enumeration of floating population/
outdoor-sleepers, fast growing areas, institutional population, and enumeration areas with
scattered settlements.
The trial census provided GSS with an opportunity to assess its plans and procedures as well
as the state of preparedness for the conduct of the 2010 PHC. The common errors found
7during editing of the completed questionnaires resulted in modifications to the census
questionnaire, enumerator manuals and other documents. The results of the trial census
assisted GSS to arrive at technically sound decisions on the ideal number of persons per
questionnaire, number of persons in the household roster, migration questions, placement of
the mortality question, serial numbering of houses/housing structures and method of
collection of information on community facilities. Lessons learnt from the trial census also
guided the planning of the recruitment process, the procedures for training of census field
staff and the publicity and education interventions.
1.6.3 Census enumeration
Method of enumeration and field work
All post-independence censuses (1960, 1970, 1984, and 2000) conducted in Ghana used the
de facto method of enumeration where people are enumerated at where they were on census
night and not where they usually reside. The same method was adopted for the 2010 PHC.
The de facto count is preferred because it provides a simple and straight forward way of
counting the population since it is based on a physical fact of presence and can hardly be
misinterpreted. It is thought that the method also minimizes the risks of under-enumeration
and over enumeration. The canvasser method, which involves trained field personnel visiting
houses and households identified in their respective enumeration areas, was adopted for the
2010 PHC.
The main census enumeration involved the canvassing of all categories of the population by
trained enumerators, using questionnaires prepared and tested during the pre-enumeration
phase. Specific arrangements were made for the coverage of special population groups, such
as the homeless and the floating population. The fieldwork began on 21st September 2010
with the identification of EA boundaries, listing of structures, enumeration of institutional
population and floating population.
The week preceding the Census Night was used by field personnel to list houses and other
structures in their enumeration areas. Enumerators were also mobilized to enumerate
residents/inmates of institutions, such as, schools and prisons. They returned to the
institutions during the enumeration period to reconcile the information they obtained from
individuals and also to cross out names of those who were absent from the institutions on
Census Night. Out-door sleepers (floating population) were also enumerated on the Census
Night.
Enumeration of the household population started on Monday, 27th September, 2010.
Enumerators visited houses, compounds and structures in their enumeration areas and started
enumerating all households including visitors who spent the Census Night in the households.
Enumeration was carried out in the order in which houses/structures were listed and where
the members of the household were absent, the enumerator left a call-back-card indicating
when he/she would come back to enumerate the household. The enumeration process took off
smoothly with enumerators poised on completing their assignments on schedule since many
of them were teachers and had to return to school. However, many enumerators ran short of
questionnaires after a few days’ work.
Enumeration resumed in all Municipals when the questionnaire shortage was resolved and by
17th October, 2010, enumeration was completed in most Municipals. Enumerators who had
finished their work were mobilized to assist in the enumeration of localities that were yet to
8be enumerated in some regional capitals and other fast growing areas. Flooded areas and
other inaccessible localities were also enumerated after the end of the official enumeration
period. Because some enumeration areas in fast growing cities and towns, such as, Accra
Metropolitan Area, Kumasi, Kasoa and Techiman were not properly demarcated and some
were characterized by large EAs, some enumerators were unable to complete their assigned
tasks within the stipulated time.
1.6.4 Post enumeration survey
In line with United Nations recommendations, GSS conducted a Post Enumeration Survey
(PES) in April, 2011 to check content and coverage error. The PES was also to serve as an
important tool in providing feedback regarding operational matters such as concepts and
procedures in order to help improve future census operations. The PES field work was
carried out for 21 days in April 2011 and was closely monitored and supervised to ensure
quality output. The main findings of the PES were that:
97.0 percent of all household residents who were in the country on Census Night (26th
September, 2010) were enumerated.
1.3 percent of the population was erroneously included in the census.
Regional differentials are observed. Upper East region recorded the highest coverage
rate of 98.2 percent while the Volta region had the lowest coverage rate of 95.7
percent.
Males (3.3%) were more likely than females (2.8%) to be omitted in the census. The
coverage rate for males was 96.7 percent and the coverage rate for females was 97.2
percent. Also, the coverage rates (94.1%) for those within the 20-29 and 30-39 age
groups are relatively lower compared to the coverage rates of the other age groups.
There was a high rate of agreement between the 2010 PHC data and the PES data for
sex (98.8%), marital status (94.6%), relationship to head of household (90.5%) and
age (83.0%).
1.6.5 Release and dissemination of results
The provisional results of the census were released in February 2011 and the final results in
May 2012. A National Analytical report, six thematic reports, a Census Atlas, 10 Regional
Reports and a report on Demographic, Social, Economic and Housing were prepared and
disseminated in 2013.
1.6.6 Concepts and definitions
Introduction
The 2010 Population and Housing Census of Ghana followed the essential concepts and
definitions of a modern Population and Housing Census as recommended by the United
Nations (UN). It is important that the concepts, definitions and recommendations are adhered
to since they form the basis upon which Ghana could compare her data with that of other
countries.
The concepts and definitions in this report cover all sections of the 2010 Population and
Housing Census questionnaires (PHC1A and PHC1B). The sections were: geographical
9location of the population, Household and Non-household population, Literacy and
Education, Emigration, Demographic and Economic Characteristics, Disability, Information
Communication Technology (ICT), Fertility, Mortality, Agricultural Activity and Housing
Conditions.
The concepts and definitions are provided to facilitate understanding and use of the data
presented in this report. Users are therefore advised to use the results of the census within the
context of these concepts and definitions.
Region
There were ten (10) administrative regions in Ghana during the 2010 Population and Housing
Census as they were in 1984 and 2000.
Districts
In 1988, Ghana changed from the local authority system of administration to the District
assembly system. In that year, the then existing 140 local authorities were demarcated into
110 Districts. In 2004, 28 new Districts were created; this increased the number of Dists in
the country to 138. In 2008, 32 additional Districts were created bringing the total number of
Districts to 170. The 2010 Population and Housing Census was conducted in these 170
administrative Districts (these are made-up of 164 districts/municipals and 6 metropolitan
areas). In 2012, 46 new Districts were created to bring the total number of Municipals to 216.
There was urgent need for data for the 46 newly created Municipals for planning and
decision-making. To meet this demand, the 2010 Census data was re-programmed into 216
Municipals after carrying out additional fieldwork and consultations with stakeholders in the
Municipals affected by the creation of the new Municipals.
Locality
A locality was defined as a distinct population cluster (also designated as inhabited place,
populated centre, settlement) which has a NAME or LOCALLY RECOGNISED STATUS. It
included fishing hamlets, mining camps, ranches, farms, market towns, villages, towns, cities
and many other types of population clusters, which meet the above criteria. There were two
main types of localities, rural and urban. As in previous censuses, the classification of
localities into ‘urban’ and ‘rural’ was based on population size. Localities with 5,000 or more
persons were classified as urban while localities with less than 5,000 persons were classified
as rural.
Population
The 2010 Census was a “de facto” count and each person present in Ghana, irrespective of
nationality, was enumerated at the place where he/she spent the midnight of 26th September
2010.
Household
A household was defined as a person or a group of persons, who lived together in the same
house or compound and shared the same house-keeping arrangements. In general, a
household consisted of a man, his wife, children and some other relatives or a house help who
may be living with them. However, it is important to remember that members of a household
10are not necessarily related (by blood or marriage) because non-relatives (e.g. house helps)
may form part of a household.
Head of household
The household head was defined as a male or female member of the household recognised as
such by the other household members. The head of household is generally the person who has
economic and social responsibility for the household. All relationships are defined with
reference to the head.
Household and non-household population
Household population comprised of all persons who spent the census night in a household
setting. All persons who did not spend the census night in a household setting (except
otherwise stated) were classified as non-household population. Persons who spent census
night in any of the under listed institutions and locations were classified as non-household
population:
a) Educational institutions
b) Children's and old people’s homes
c) Hospitals and healing centres
d) Hotels
e) Prisons
f) Service barracks
g) Soldiers on field exercise
h) Floating population: The following are examples of persons in this category:
i. All persons who slept in lorry parks, markets, in front of stores and offices,
public bathrooms, petrol filling stations, railway stations, verandas,
pavements, and all such places which are not houses or compounds.
ii. Hunting and fishing camps.
iii. Beggars and vagrants (mentally sick or otherwise).
Age
The age of every person was recorded in completed years disregarding fractions of days and
months. For those persons who did not know their birthdays, the enumerator estimated their
ages using a list of Municipal, regional and national historical events.
Nationality
Nationality is defined as the country to which a person belongs. A distinction is made
between Ghanaians and other nationals. Ghanaian nationals are grouped into Ghanaian by
birth, Ghanaian with dual nationality and Ghanaian by naturalization. Other nationals are
11You can also read