ASUNAFO NORTH MUNICIPALITY - : Ghana Statistical ...
←
→
Page content transcription
If your browser does not render page correctly, please read the page content below
ASUNAFO NORTH
 MUNICIPALITY

      i
Copyright © 2014 Ghana Statistical Service

                    ii
PREFACE AND ACKNOWLEDGEMENT

No meaningful developmental activity can be undertaken without taking into account the
characteristics of the population for whom the activity is targeted. The size of the population
and its spatial distribution, growth and change over time, in addition to its socio-economic
characteristics are all important in development planning.
A population census is the most important source of data on the size, composition, growth
and distribution of a country’s population at the national and sub-national levels. Data from
the 2010 Population and Housing Census (PHC) will serve as reference for equitable
distribution of national resources and government services, including the allocation of
government funds among various regions, districts and other sub-national populations to
education, health and other social services.
The Ghana Statistical Service (GSS) is delighted to provide data users, especially the
Metropolitan, Municipal and District Assemblies, with district-level analytical reports based
on the 2010 PHC data to facilitate their planning and decision-making.
The District Analytical Report for the Asunafo North Municipality is one of the 216 district
census reports aimed at making data available to planners and decision makers at the district
level. In addition to presenting the district profile, the report discusses the social and
economic dimensions of demographic variables and their implications for policy formulation,
planning and interventions. The conclusions and recommendations drawn from the district
report are expected to serve as a basis for improving the quality of life of Ghanaians through
evidence-based decision-making, monitoring and evaluation of developmental goals and
intervention programmes.
For ease of accessibility to the census data, the district report and other census reports
produced by the GSS will be disseminated widely in both print and electronic formats. The
report will also be posted on the GSS website: www.statsghana.gov.gh.
The GSS wishes to express its profound gratitude to the Government of Ghana for providing
the required resources for the conduct of the 2010 PHC. While appreciating the contribution
of our Development Partners (DPs) towards the successful implementation of the Census, we
wish to specifically acknowledge the Department for Foreign Affairs, Trade and
Development (DFATD) formerly the Canadian International Development Agency (CIDA)
and the Danish International Development Agency (DANIDA) for providing resources for
the preparation of all the 216 district reports. Our gratitude also goes to the Metropolitan,
Municipal and District Assemblies, the Ministry of Local Government, Consultant Guides,
Consultant Editors, Project Steering Committee members and their respective institutions for
their invaluable support during the report writing exercise. Finally, we wish to thank all the
report writers, including the GSS staff who contributed to the preparation of the reports, for
their dedication and diligence in ensuring the timely and successful completion of the district
census reports.

Dr. Philomena Nyarko
Government Statistician

                                              iii
TABLE OF CONTENT
PREFACE AND ACKNOWLEDGEMENT ........................................................................ iii
LIST OF TABLES.................................................................................................................. vi
LIST OF FIGURES .............................................................................................................. vii
ACRONYMS AND ABBREVIATIONS ............................................................................ viii
EXECUTIVE SUMMARY.................................................................................................... ix
CHAPTER ONE: INTRODUCTION ...................................................................................1
1.1 Background .................................................................................................................... 1
1.2 Physical Features ........................................................................................................... 1
1.3 Political and Administrative Structures ......................................................................... 3
1.4 Cultural and Social Structure ......................................................................................... 3
1.5 Economy ........................................................................................................................ 3
1.6 Census Methodology, Concepts and Definitions ........................................................... 5
1.7 Organization of the Report........................................................................................... 14
CHAPTER TWO: DEMOGRAPHIC CHARACTERISTICS .........................................16
2.1 Introduction .................................................................................................................. 16
2.2 Population Size and Distribution ................................................................................. 16
.2.3 Age-Sex Structure .................................................................................................... 17
2.4 Fertility, Mortality and Migration ................................................................................ 18
2.4.2 Mortality ................................................................................................................. 20
CHAPTER THREE: SOCIAL CHARATERISTICS ........................................................24
3.1 Introduction .................................................................................................................. 24
3.2 Household Size by Type of Locality ............................................................................ 24
3.3 Household Composition and Sex ................................................................................. 24
3.4 Household Population by Structure and Sex ............................................................... 25
3.5 Marital Status ............................................................................................................... 26
3.6 Nationality.................................................................................................................... 30
3.7 Religious Affiliation................................................................................................. 30
3.8 Literacy and Education ................................................................................................ 31
CHAPTER FOUR: ECONOMIC CHARACTERISTICS ...............................................35
4.1 Introduction .................................................................................................................. 35
4.2 Activity Status ............................................................................................................. 35
4.3 Economic Activity Status ............................................................................................. 37
4.4 Occupation ................................................................................................................... 39
4.5 Industry ........................................................................................................................ 39
4.6 Employment Status ...................................................................................................... 40
4.7 Employment Sector ...................................................................................................... 41
CHAPTER FIVE: INFORMATION COMMUNICATION TECHNOLOGY ...............43
5.1 Introduction .................................................................................................................. 43
5.2 Ownership of Mobile Phones....................................................................................... 43
5.3 Use of Internet Facility ................................................................................................ 43
5.4 Household Ownership of Desktop or Laptop Computer ............................................. 43
ivCHAPTER SIX: DISABILITY ...........................................................................................45
6.1 Introduction .................................................................................................................. 45
6.2 Population with Disability ........................................................................................... 45
6.3 Type of Disability ........................................................................................................ 45
6.4 Disability and Economic Activity ................................................................................ 46
6.5 Disability, Education and Literacy ............................................................................... 47
CHAPTER SEVEN: AGRICULTURAL ACTIVITIES ....................................................49
7.1 Introduction .................................................................................................................. 49
7.2 Households in Agriculture ....................................................................................... 49
7.3 Types of Farming Activities ......................................................................................... 50
7.4 Type of Livestock and Other Animals Reared ............................................................. 50
CHAPTER EIGHT: HOUSING CONDITIONS ...............................................................52
8.1 Introduction .................................................................................................................. 52
8.2 Housing Stock .............................................................................................................. 52
8.3 Type of Dwelling, Housing and Tenancy Arrangements ............................................. 52
8.6 Main Construction Materials for the Floor of Dwelling Unit by Type of Locality. ..... 55
8.7 Main Construction Material for Roofing of Dwelling Unit by Type of Locality......... 55
8.8 Room Occupancy. ........................................................................................................ 56
8.9 Access to Utilities and Household Facilities ........................................................... 57
8.10 Main Source of Water for Drinking and Other Domestic Purposes......................... 58
8.11 Main Source of Cooking Fuel and Cooking Space Use by Households.................. 60
8.12 Type of Toilet Facility and Bathing Facility Use by Households ............................ 61
8.13 Method of Solid and Liquid Waste Disposal ........................................................... 62
CHAPTER NINE: SUMMARY OF FINDING, CONCLUSION AND POLICY
RECOMMENDATIONS .....................................................................64
9.1 Introduction ................................................................................................................. 64
9.2 Summary of Findings ................................................................................................... 64
9.2 Conclusion ............................................................................................................... 67
9.3 Policy Recommendation .............................................................................................. 67
REFERENCES .......................................................................................................................69
APPENDICES ........................................................................................................................70
LIST OF CONTRIBUTORS .................................................................................................72
vLIST OF TABLES
Table 2.1: Population by age, sex and type of locality ........................................................... 17
Table 2.2: Reported total fertility rate, general fertility rate and crude birth rate by district .. 19
.................................................................................................................................................. 19
Table 2.3: Female population 12 years and older by age, children ever born, rate by district20
Table 2.5: Cause of deaths in households ............................................................................... 22
Table 2.6: Birthplace by duration of residence of migrants .................................................... 23
Table 3.1: Household size by type of locality ......................................................................... 24
Table 3.2: Household population by composition and sex ..................................................... 25
Table 3.3: Household population by structure and sex ........................................................... 26
Table 3.4: Persons 12 years and older by sex, age-group and marital status .......................... 27
Table 3.5: Persons 12 years and older by sex, marital status and level of education.............. 28
Table 3.6: Persons 12 years and older by sex, marital status and economic activity status ... 29
Table 3.7: Population by nationality and sex .......................................................................... 30
Table 3.8: Population by religion and sex ............................................................................... 30
Table 3.9: Population 11 years and older by age group, sex and literacy status ..................... 32
Table 3.10:Population 3 years and older by level of education, school attendance and sex ... 34
Table 4.1: Population 15 years and older by activity status and sex ....................................... 36
Table 4.2: Employed population 15 years and older by sex, age and activity status .............. 38
Table 4.3: Employed population 15 years and older by occupation and sex .......................... 39
Table 4.4: Employed population 15 years and older by Industry and sex .............................. 40
Table 4.5: Employed population 15 years and older by employment status and sex ............. 41
Table 4.6: Employed population 15 years and older by employment sector and sex ............. 41
Table 5.1: Population 12 years and older by mobile phone ownership, internet facility
usage and Sex ......................................................................................................... 43
Table 5.2: Households having desktop/laptop computers, by sex of household head ............ 44
Table 6.1: Population by type of locality, disability type and sex .......................................... 46
Table 6.2: Persons 15 years and older with disability by economic activity status and sex ... 47
Table 6.3: Population 3 years and older by sex, disability type and level of education ......... 48
Table 7.1: Households by agricultural activities and locality ................................................. 50
Table 7.2: Types of livestock numbers and keepers ................................................................ 51
Table 8.1: Stock of houses and households by type of locality .............................................. 52
Table 8.2: Type of occupied dwelling unit by sex of household head and type of locality .... 53
Table 8.3: Ownership status of dwelling by sex of household head and type of locality ....... 54
Table 8.4: Main construction material for outer wall of dwelling unit by type of locality ..... 54
Table 8.5: Main construction materials for the floor of dwelling unit by type of locality...... 55
Table 8.6: Main construction material for roofing of dwelling unit by type of locality ......... 56
Table 8.7: Household size and number of sleeping rooms occupied in dwelling unit ............ 56
Table 8.8: Main source of lighting of dwelling unit by type of locality ................................. 57
Table 8.9: Main source of water of dwelling unit for drinking and other domestic purposes 59
Table 8.10:Main source of cooking fuel, and cooking space used by households .................. 61
Table 8.11:Type of toilet facility and bathing facility used by household by type of locality . 62
Table 8.12:Method of solid and liquid waste disposal by type of locality .............................. 63
Table A1: Total population, Sex, number of households and houses in the20 largest
communities ........................................................................................................... 70
Table A2: Population by age groups in the 20 largest communities ....................................... 71
viLIST OF FIGURES
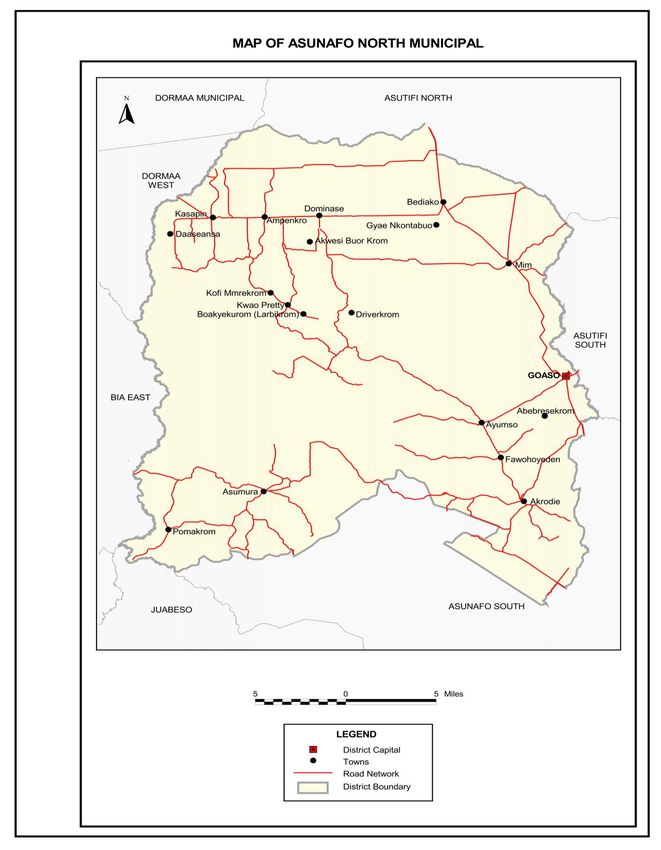
Figure 1.1: Map of Asunafo North Municipality ...................................................................... 2
Figure 2.1: Population pyramid .............................................................................................. 18
Figure 2.2: Reported age specific death rates by sex, 2010 .................................................... 23
Figure 3.1: Marital status of the population aged 12 years and older ..................................... 26
Figure 3.2: Population 11 years and older by sex and literacy status ..................................... 31
Figure 4.1: Economically active and economically not active population ............................. 36
Figure 4.2: Employed and unemployed population ................................................................ 37
Figure 4.3: Employed population by sector ............................................................................ 42
Figure 7.1: Households in agriculture ..................................................................................... 49
Figure 7.2: Access to utilities .................................................................................................. 58
Figure 7.3: Sources of drinking water..................................................................................... 60
viiACRONYMS AND ABBREVIATIONS
CEB: Children Ever Born
CHIPS: Community Health Planning Service
CIDA: Canadian International Development Agency
CBR: Crude Birth Rate
CS: Children Surviving
DANIDA: Danish International Development Agency
DCE: District Chief Executive
DCD: District Coordinating Director
DFID: Department for International Development
DMTDP: District Medium Term Development Plan
ECOWAS: Economic Community of West African States
fCUBE: Free Compulsory Universal Basic Education
GFR: General Fertility Rate
GSS: Ghana Statistical Service
ICT: Information Communication Technology
JSS: Junior Secondary School
JHS: Junior High School
MMDAs: Metropolitan, Municipal and District Assemblies
MDGs: Millennium Development Goals
MP: Member of Parliament
NGOs: Non-governmental Organizations
PHC: Population and Housing Census
PHD: Prestea Huni-Valley District
PHDA: Prestea Huni-Valley District Assembly
PWDs: Persons with disabilities
SSS: Senior Secondary School
SHS: Senior High School
TFR: Total Fertility Rate
UN: United Nations
UNDP: United Nations Development Programme
UNICEF United Nations International Children’s Education Fund
W.C: Water Closet
WHO: World Health Organization
viiiEXECUTIVE SUMMARY
Introduction
The Municipality census report is the first of its kind since the first post-independence census
was conducted in 1960. The report provides basic information about the Municipality. It gives a
brief background of the Municipality, describing its physical features, political and
administrative structure, socio-cultural structure and economy. Using data from the 2010
Population and Housing Census (2010 PHC), the report discusses the population characteristics
of the Municipality , fertility, mortality, migration, marital status, literacy and education,
economic activity status, occupation, employment; Information Communication Technology
(ICT), disability, agricultural activities and housing conditions of the Municipality . The key
findings of the analysis are as follows (references are to the relevant sections of the report):
Population size, structure and composition
The population of Asunafo North Municipality, according to the 2010 Population and Housing
Census, is 124,685 representing 5.4 percent of the region’s total population. Males constitute
50.4 percent and females 49.6 percent. Sixty percent of the population is rural. The
Municipality has a sex ratio of 101.7. The population of the Municipality is youthful (41.8%)
depicting a broad base population pyramid which tapers off with a small number of elderly
persons (5.4%). The total age dependency ratio for the Municipality is 84.1, the age dependency
ratio for males is higher (86.4) than that of females (81.9).
Fertility, mortality and migration
The Total Fertility Rate for the Municipality is 3.9. The General Fertility Rate is 115.0 births
per 1000 women aged 15-49 years which is the second highest for the region. The Crude Birth
Rate (CBR) is 27.7 per 1000 population. The crude death rate for the Municipality is 5.0 per
1000. Accident/violence/homicide/suicide accounted for 10.4 percent of all deaths while other
causes constitute 89.6 percent of deaths in the Municipality. Majority of migrants (68.3 percent)
living in the Municipality were born in another region while 31.2 percent were born elsewhere
in the Brong Ahafo Region. For migrants born in another region, those born in Brong Ahafo
region constitute the highest (25.0%).
Household Size, composition and structure
The Municipality has a household population of 123,134 with a total number of 46,460
households. The average household size in the Municipality is 4.6 persons per household.
Nuclear households (head, spouse(s) and children) constitute 32.6 percent of the total number of
households in the Municipality. Children constitute 44.8 percent of the household members.
Marital status
About four in ten (42.0%) of the population aged 12 years and older are married and 40.2
percent have never married. By age 25-29 years, 57.5 percent of females are married
compared to 32.5 percent of males. At age 65 and above, widowed females account for as
high as 49.7 percent while widowed males account for only 7.5 percent. Among the married,
37.8 percent have no education while about 16.0 percent of the unmarried have never been to
school. Nearly 88.2 percent of the married population are employed, 2.2 percent are
unemployed and 9.6 percent are economically not active. A greater proportion of those who
have never married (62.4%) are economically not active with 3.3 percent unemployed.
ixNationality
The proportion of Ghanaians by birth in the Municipality is 95.2 percent. Those who have
naturalised constitute 0.6 percent and the non-Ghanaian population in the Municipality is 2.2
percent.
Literacy and education
Of the population 11 years and above, 74.4 percent are literate and 25.6 percent are non-
literate. The proportion of literate males is higher (53.8 %) than that of females (48.2%).
Seven out of ten people (70.8%) indicated they could read and write both English and
Ghanaian languages.
Economic Activity Status
Three quarters (75.1%) of the population aged 15 years and older are economically active
while 24.9 per cent are economically not active. Of the economically active population, 95.8
percent are employed while 4.2 percent are unemployed. For those who are economically not
active, a larger percentage of them are students (57.7%) and 25.1 % perform household
duties.
Occupation
Of the employed population, 60.3 percent are engaged as skilled agricultural, forestry and
fishery workers, 13.4 percent in service and sales and 1.7 percent are engaged as managers,
professionals, and technicians.
Employment status and sector
Of the population 15 years and older 54.7 percent are self-employed without employee(s) and
16.5 percent are contributing family worker. There are more females (57.3%) engaged as
service and sales workers compared to males (52.2%). The private informal sector is the
largest employer in the Municipality, employing 87.3 percent of the population.
Information and Communication Technology
Of the population 12 years and above, 40.8 percent have mobile phones. Males who own
mobile phones constitute 46.8 percent as compared to 34.9 percent of females. Three percent
of the population 12 years and older use internet facilities in the Municipality. Only 3.5
percent of the total households in the Municipality have desktop/laptop computers.
Disability
About 2.5 percent of the Municipality’s total population has one form of disability or the
other. The proportion of the female population with disability is equal (2.5%) to males
(2.5%). The types of disability in the Municipality include sight, hearing, speech, physical,
intellect, and emotion. Persons with sight disability recorded the highest of 0.9 percent. About
1.1 percent of the population with disability are in the urban localities. Of the population
disabled, 41.7 percent have never been to school.
Agriculture
Households engaged in agriculture in the Municipality stand at 71.8 percent. In the rural
localities, 85.9 percent households and urban (51.1%) are agricultural households. Crop
farming (97.2%) is predominant in the Municipality while Poultry (chicken) is the dominant
animal reared in the Municipality.
xHousing
The housing stock of the Municipality is 18,708 representing 5.6 percent of the total number
of houses in the Brong Ahafo Region. The average number of persons per house is 6.6.
Type, tenancy arrangement and ownership of dwelling units
Over half (54.1%) of all dwelling units in the Municipality are compound houses and 30.3
percent are separate houses. Almost half (49.4%) of the dwelling units in the Municipality are
owned by household member and a quarter (25.9%) are owned by other private individuals.
Material for construction of outer wall, floor and roof
The main construction material for outer walls of dwelling units in the Municipality is mud
brick/earth (47.7%). Cement (71.0%) and earth/muds (26.9%) are the main materials used in
the construction of floors and metal sheet (94.1%) as roofing material for dwelling units in
the Municipality.
Room occupancy
One room constitutes the highest percentage (90.2%) of sleeping rooms occupied by
households in housing units in the Municipality. About 7.9 percent of households with 10 or
more members occupy single rooms.
Utilities and household facilities
The two three sources of lighting in dwelling units in the Municipality are electricity (mains)
(93.1%), flashlight/torch (42.4%) and kerosene lamp (7.5%). The main source of fuel for
cooking for most households in the Municipality is wood (65.7%). The proportion for rural
(86.6%) is higher than that of urban (35.2%). Bore-hole/pump/tube account for the highest
(28.1%) of drinking water for households in the Municipality.
The most important toilet facility used in the Municipality is public toilet (WC, KVIP, Pit,
Pan) representing 48.0 percent followed by pit latrine (34.3%). About 5.5 percent of the
population in the Municipality has no toilet facility. Three out of ten (32.8%) of households in
the Municipality share separate bathrooms in the same house while 30.1 percent own
bathrooms for their exclusive use.
Waste disposal
The most widely method of solid waste disposal is by public dump in the open space
accounting for 55.8 percent. About 16.4 percent of households dump their solid waste
indiscriminately. House to house waste collection accounts for only 1.5 percent. For liquid
waste disposal, throwing waste onto compound (51.8%) and thrown onto the street/outside
(29.2%) are the two most common methods used by households in the Municipality.
xiCHAPTER ONE
INTRODUCTION
1.1 Background
This chapter provides a brief description of profile of Asunafo North Municipality in terms of
the physical features, political and administrative structure, cultural and social structure and
the municipal economy. It also discusses the organization of the report as well as concepts
and definitions used in the report.
Asunafo North Municipal is one of the twenty-seven (27) districts in the Brong Ahafo Region
of Ghana. The Municipal was created when the then Asunafo District was divided into two in
2004.The Legislative Instrument that established the Municipal Assembly is LI 1873 of 2008.
1.2 Physical Features
1.2.1 Location and size
The Asunafo North Municipal shares boundaries with Asutifi District in the north-east,
Dormaa Municipal in the north-west and Juaboso Bia and Sefwi-Wiaso Districts in the
Western Region in the south-west border, and Asunafo South District in the Brong Ahafo
Region in the south-eastern border. The total land size of the municipal is 1,412.0km2 with
578.63 km2 largely covered by forest reserves. The municipal area forms about 3.5 percent of
the regional land area of 40,095sq km.
1.2.2 Relief and drainage
The municipality has a gently rolling landscape ranging between 500 feet and a little over
1,000 feet above sea level. The topography is more rugged towards the north-eastern (Mim
Area) and south-western (Abuom Area). The Soil type in the municipality is mostly forest
ochrosols which supports crops like plantain, cocoyam, cocoa, oil palm, cassava, maize, etc.
Asunafo North Municipal lies within the central part of the forest dissected plateau of the
physiographic region of Ghana. There are different types of rocks in the municipality. These
include the pre-cambrianbirrimian and taruwaian formations. The municipality is drained by
2 rivers, namely the Goa and the Ayum. There are also a number of smaller streams.
1.2.3 Climate
The municipality is within the wet semi-deciduous climatic zone which experiences
substantial amount of rainfall. It experiences double rainfall with the annual rainfall between
1250mm and 1750mm. Major rains are in April and July and minor season occurs between
September and October. The mean monthly temperature for the municipality is about 25.5oC.
1.2.4 Vegetation
The municipality is located within the semi-deciduous forest belt of Ghana. The vegetation is
mainly characterized by tall trees with evergreen undergrowth and has an abundance of
economic trees. Scattered patches of secondary or broken forest are characteristics of the
vegetation. This has been as a result of farming, lumbering and settlements by peasant
farmers in the forest. There are large trees among which are Antaris Africana (kyenkyen),
clorophoraexcelsa (Odum), Ceiba Pentandra (Onyina), Dahoma, Kusia, Sapele, Aprokuma
and Emire in this vegetation.
1Figure 1.1: Map of Asunafo North Municipality
Source: Ghana Statistical Service, GIS
21.3 Political and Administrative Structures
The office of the Municipal Chief Executive is at the apex of the municipal administration,
followed by the Executive Committee, which serve as the executive, as well as the co-
ordinating body of the assembly. The next level comprises five sub-committees and any other
committees that the executive deems necessary. The mandatory sub-committees include
Social Services, Development Planning, Justice and Security, Works, and Finance and
Administration. These committees are to collate community concerns and deliberate on them
as the executive may direct. To ensure effective and efficient grass root participation in
decision making, the municipality was further divided into 6 Zonal Councils, namely; Mim,
Goaso, Asumura, Akrodie, Ayomso and Dominase. The municipal capital, Goaso is the
second largest town after Mim in terms of population and functions.
1.4 Cultural and Social Structure
1.4.1 Chieftaincy
The Asunafo North Municipal has two Traditional Councils which are headed by the
Paramount Chiefs of Goaso and Mim traditional areas respectively. The chiefs, who are the
custodians of culture and land, are the motivating force behind development projects in many
communities. Fortunately, the municipality is not plagued with any serious volatile disputes,
land litigation which hamper development.
1.4.2 Ethnicity
Asunafo North Municipality is heterogeneous in terms of ethnicity. The major ethnic group
is the Akans who constitute about 79 percent. Other ethnic groups that form the minority are
Dagombas, Ewes, Gas, and other ethnic groups.
1.4.3 Religion and festivals
The municipality is predominantly Christian, constituting about 83 percent of the population.
Moslems form about 16 percent with traditional religion forming about one percent. The
festival celebrated by the people is the Akwasidae. The festival is celebrated to enable chiefs
under the Ashanti Kingdom to pay homage to the Asantehene. The festival serves as a means
by which the chiefs and people honour their ancestors. It is also a source of tourism which
enhances revenue generation. In addition, the festival brings people from far and near which
foster unity among the people.
1.5 Economy
1.5.1 Tourism
The municipality has two major historical tourist sites that have the potential to attract
people. The “mimbuor” is believed to have some spiritual history surrounding its existence. It
is believed that the mountain, which is about 2 sq. km, serves as a protective god to the
people of Mim. In addition, the white-necked rock fowls (known locally as Anamie) can be
found in the Subin Forest Reserves, near Asumura. In addition, are a number of guest houses
and hotel facilities located in different parts of the municipality, especially, Goaso, the
municipal capital and Mim.
1.5.2 Economic Potentials
The Asunafo North Municipality is predominantly agrarian. Agriculture activities in the
municipality are centred mainly on crop production. The predominant farming system is
3mixed cropping. The major food crops cultivated include maize, cassava, plantain, cocoyam,
yams and vegetables whilst cocoa and cashew are the major cash crops produced which
enhances employment opportunities in the municipality and productivity in the country in
general. The municipality has diverse industry such as the Mim cashew brandy processing
factory, small scale palm oil extraction, soap making, Batik Tie and Dye industries etc. The
municipality also has a Wednesday market which serves as a major revenue source for the
assembly.
1.5.3 Financial institutions
The municipality can also boast of a number of financial institutions such as the Agricultural
Development Bank, Ghana Commercial Bank, Asutifi and Ahafo Community Banks.
Additionally, microfinance institutions such as First allied Savings and Loans Company,
Sinapi Aba Trust, Supernick Savings and Loans Company and RIMDA Microfinance
Company. These financial institutions grant credit to business operators and farmers in the
municipality.
1.5.4 Non-banking financial institutions
The following insurance companies are non-banking financial institutions in the municipality;
The Social Security and National Insurance Trust (SSNIT), Vanguard Assurance Company,
State Insurance Company and the Star Assurance Company. The insurance companies render
services to the people in the form of live and property insurance cover.
1.5.5 Social Development
Health/Education
For good health service delivery system, the municipality has a government hospital and
Ahmaddiya Moslem hospital located in Goaso and Mim respectively. There is a midwifery
training school, located in Goaso to train midwives not to serve in the municipal hospital
alone but also health facilities all over the country. Besides health infrastructure, there are a
number of educational facilities such as Kindergarten (42), Primary (88), Junior High School
(20), Senior High School (2), and Vocational School (3).
1.5.6 Telecommunication sector
Communication plays a vital role in modern global world. Asunafo North Municipal in
addition to the fixed telephone system is presently connected to four main mobile
telecommunication services, namely Vodafone, Tigo, Airtel, and MTN. The municipality
currently has three local Frequency Modulation (FM) stations all located in Goaso. These
mode of communication are not only instruments in promoting good governance, but they are
also relied upon for entertainment, civic education, advertisement of products for the
industrial and business sectors as well avenue for jobs.
About 72.7 percent of households in the municipal use improve sources of water (piped
system, mechanized borehole, well with pump, protected well) for drinking.
1.5.7 Transportation
The municipality has about 370km motorable roads out of which 127 km roads are tarred and
243km roads untarred connecting the major towns and farming centres.
41.6 Census Methodology, Concepts and Definitions
1.6.1 Introduction
Ghana Statistical Service (GSS) was guided by the principle of international comparability
and the need to obtain accurate information in the 2010 Population and Housing Census
(2010 PHC). The Census was, therefore, conducted using all the essential features of a
modern census as contained in the United Nations Principles and Recommendations for
countries taking part in the 2010 Round of Population and Housing Censuses.
Experience from previous post independence censuses of Ghana (1960, 1970, 1984 and 2000)
was taken into consideration in developing the methodologies for conducting the 2010 PHC.
The primary objective of the 2010 PHC was to provide information on the number,
distribution and social, economic and demographic characteristics of the population of Ghana
necessary to facilitate the socio-economic development of the country.
1.6.2 Pre-enumeration activities
Development of census project document and work plans
A large scale statistical operation, such as the 2010 Population and Housing Census required
meticulous planning for its successful implementation. A working group of the Ghana
Statistical Service prepared the census project document with the assistance of two
consultants. The document contains the rationale and objectives of the census, census
organisation, a work plan as well as a budget. The project document was launched in
November 2008 as part of the Ghana Statistics Development Plan (GSDP) and reviewed in
November 2009.
Census secretariat and committees
A well-structured management and supervisory framework that outlines the responsibilities of
the various stakeholders is essential for the effective implementation of a population and
housing census. To implement the 2010 PHC, a National Census Secretariat was set up in
January 2008 and comprised professional and technical staff of GSS as well as staff of other
Ministries, Departments and Agencies (MDAs) seconded to GSS. The Census Secretariat was
primarily responsible for the day-to-day planning and implementation of the census activities.
The Secretariat had seven units, namely; census administration, cartography, recruitment and
training, publicity and education, field operations and logistics management, data processing,
and data analysis and dissemination.
The Census Secretariat was initially headed by an acting Census Coordinator engaged by the
United Nations Population Fund (UNFPA) in 2008 to support GSS in the planning of the
Census. In 2009, the Census Secretariat was re-organised with the Government Statistician
as the National Chief Census Officer and overall Coordinator, assisted by a Census
Management Team and a Census Coordinating Team. The Census Management Team had
oversight responsibility for the implementation of the Census. It also had the responsibility of
taking critical decisions on the census in consultation with other national committees. The
Census Coordinating Team, on the other hand, was responsible for the day-to-day
implementation of the Census programme.
A number of census committees were also set up at both national and sub-national levels to
provide guidance and assistance with respect to resource mobilization and technical advice.
At the national level, the committees were the National Census Steering Committee (NCSC),
the National Census Technical Advisory Committee (NCTAC) and the National Census
5Publicity and Education Committee (NCPEC). At the regional and district levels, the
committees were the Regional Census Implementation Committee and the District Census
Implementation Committee, respectively.
The Regional and District Census Implementation Committees were inter-sectoral in their
composition. Members of the Committees were mainly from decentralized departments with
the Regional and District Coordinating Directors chairing the Regional Census
Implementation Committee and District Census Implementation Committee, respectively.
The Committees contributed to the planning of district, community and locality level
activities in areas of publicity and field operations. They supported the Regional and District
Census Officers in the recruitment and training of field personnel (enumerators and
supervisors), as well as mobilizing logistical support for the census.
Selection of Census topics
The topics selected for the 2010 Population and Housing Census were based on
recommendations contained in the UN Principles and Recommendations for 2010 Round of
Population and Housing Censuses and the African Addendum to that document as well as the
needs of data users. All the core topics recommended at the global level, i.e., geographical
and internal migration characteristics, international migration, household characteristics,
demographic and social characteristics such as age, date of birth, sex, and marital status,
fertility and mortality, educational and economic characteristics, issues relating to disability
and housing conditions and amenities were included in the census.
Some topics that were not considered core by the UN recommendations but which were
found to be of great interest and importance to Ghana and were, therefore, included in the
2010 PHC are religion, ethnicity, employment sector and place of work, agricultural activity,
as well as housing topics, such as, type of dwelling, materials for outer wall, floor and roof,
tenure/holding arrangement, number of sleeping rooms, cooking fuel, cooking space and
Information Communication Technology (ICT).
Census mapping
A timely and well implemented census mapping is pivotal to the success of any population
and housing census. Mapping delineates the country into enumeration areas to facilitate
smooth enumeration of the population. The updating of the 2000 Census Enumeration Area
(EA) maps started in the last quarter of 2007 with the acquisition of topographic sheets of all
indices from the Survey and Mapping Division of the Lands Commission. In addition, digital
sheets were also procured for the Geographical Information System Unit.
The Cartography Unit of the Census Secretariat collaborated with the Survey and Mapping
Division of the Lands Commission and the Centre for Remote Sensing and Geographic
Information Services (CERSGIS) of the Department of Geography and Resource
Development, University of Ghana, to determine the viability of migrating from analog to
digital mapping for the 2010 PHC, as recommended in the 2000 PHC Administrative Report.
Field cartographic work started in March 2008 and was completed in February 2010.
Development of questionnaire and manuals
For effective data collection, there is the need to design appropriate documents to solicit the
required information from respondents. GSS consulted widely with main data users in the
process of the questionnaire development. Data users including MDAs, research institutions,
6civil society organisations and development partners were given the opportunity to indicate
the type of questions they wanted to be included in the census questionnaire.
Documents developed for the census included the questionnaire and manuals, and field
operation documents. The field operation documents included Enumerator’s Visitation
Record Book, Supervisor’s Record Book, and other operational control forms. These record
books served as operational and quality control tools to assist enumerators and supervisors to
control and monitor their field duties respectively.
Pre-tests and trial census
It is internationally recognized that an essential element in census planning is the pre-testing
of the questionnaire and related instructions. The objective of the pre-test is to test the
questionnaire, the definition of its concepts and the instructions for filling out the
questionnaire.
The census questionnaire was pre-tested twice in the course of its development. The first pre-
test was carried out in March 2009 to find out the suitability of the questions and the
instructions provided. It also tested the adequacy and completeness of the responses and how
respondents understood the questions. The second pre-test was done in 10 selected
enumeration areas in August, 2009. The objective of the second pre-test was to examine the
sequence of the questions, test the new questions, such as, date of birth and migration, and
assess how the introduction of ‘date of birth’ could help to reduce ‘age heaping’. With regard
to questions on fertility, the pre-tests sought to find out the difference, if any, between proxy
responses and responses by the respondents themselves. Both pre-tests were carried in the
Greater Accra Region. Experience from the pre-tests was used to improve the final census
questionnaire.
A trial census which is a dress rehearsal of all the activities and procedures that are planned
for the main census was carried out in October/November 2009. These included recruitment
and training, distribution of census materials, administration of the questionnaire and other
census forms, enumeration of the various categories of the population (household,
institutional and floating population), and data processing. The trial census was held in six
selected districts across the country namely; Saboba (Northern Region), Chereponi (Northern
Region), Sene (Brong Ahafo Region), Bia (Western Region), Awutu Senya (Central Region),
and Osu Klottey Sub-Metro (Greater Accra Region). A number of factors were considered in
selecting the trial census districts. These included: administrative boundary issues, ecological
zone, and accessibility, enumeration of floating population/outdoor-sleepers, fast growing
areas, institutional population, and enumeration areas with scattered settlements.
The trial census provided GSS with an opportunity to assess its plans and procedures as well
as the state of preparedness for the conduct of the 2010 PHC. The common errors found
during editing of the completed questionnaires resulted in modifications to the census
questionnaire, enumerator manuals and other documents. The results of the trial census
assisted GSS to arrive at technically sound decisions on the ideal number of persons per
questionnaire, number of persons in the household roster, migration questions, placement of
the mortality question, serial numbering of houses/housing structures and method of
collection of information on community facilities. Lessons learnt from the trial census also
guided the planning of the recruitment process, the procedures for training of census field
staff and the publicity and education interventions.
71.6.3 Census enumeration
Method of enumeration and field work
All post- independence censuses (1960, 1970, 1984, and 2000) conducted in Ghana used the
de facto method of enumeration where people are enumerated at where they were on census
night and not where they usually reside. The same method was adopted for the 2010 PHC.
The de facto count is preferred because it provides a simple and straight forward way of
counting the population since it is based on a physical fact of presence and can hardly be
misinterpreted. It is thought that the method also minimizes the risks of under-enumeration
and over enumeration. The canvasser method, which involves trained field personnel visiting
houses and households identified in their respective enumeration areas, was adopted for the
2010 PHC.
The main census enumeration involved the canvassing of all categories of the population by
trained enumerators, using questionnaires prepared and tested during the pre-enumeration
phase. Specific arrangements were made for the coverage of special population groups, such
as the homeless and the floating population. The fieldwork began on 21st September 2010
with the identification of EA boundaries, listing of structures, enumeration of institutional
population and floating population.
The week preceding the Census Night was used by field personnel to list houses and other
structures in their enumeration areas. Enumerators were also mobilized to enumerate
residents/inmates of institutions, such as, schools and prisons. They returned to the
institutions during the enumeration period to reconcile the information they obtained from
individuals and also to cross out names of those who were absent from the institutions on
Census Night. Out-door sleepers (floating population) were also enumerated on the Census
Night.
Enumeration of the household population started on Monday, 27th September, 2010.
Enumerators visited houses, compounds and structures in their enumeration areas and started
enumerating all households including visitors who spent the Census Night in the households.
Enumeration was carried out in the order in which houses/structures were listed and where
the members of the household were absent, the enumerator left a call-back-card indicating
when he/she would come back to enumerate the household. The enumeration process took off
smoothly with enumerators poised on completing their assignments on schedule since many
of them were teachers and had to return to school. However, many enumerators ran short of
questionnaires after a few days’ work.
Enumeration resumed in all districts when the questionnaire shortage was resolved and by
17th October, 2010, enumeration was completed in most districts. Enumerators who had
finished their work were mobilized to assist in the enumeration of localities that were yet to
be enumerated in some regional capitals and other fast growing areas. Flooded areas and
other inaccessible localities were also enumerated after the end of the official enumeration
period. Because some enumeration areas in fast growing cities and towns, such as, Accra
Metropolitan Area, Kumasi, Kasoa and Techiman were not properly demarcated and some
were characterized by large EAs, some enumerators were unable to complete their assigned
tasks within the stipulated time.
1.6.4 Post enumeration survey
In line with United Nations recommendations, GSS conducted a Post Enumeration Survey
(PES) in April, 2011 to check content and coverage error. The PES was also to serve as an
8important tool in providing feedback regarding operational matters such as concepts and
procedures in order to help improve future census operations. The PES field work was
carried out for 21 days in April 2011 and was closely monitored and supervised to ensure
quality output. The main findings of the PES were that:
97.0 percent of all household residents who were in the country on Census Night (26th
September, 2010) were enumerated.
1.3 percent of the population was erroneously included in the census.
Regional differentials are observed. Upper East region recorded the highest coverage
rate of 98.2 percent while the Volta region had the lowest coverage rate of 95.7
percent.
Males (3.3%) were more likely than females (2.8%) to be omitted in the census. The
coverage rate for males was 96.7 percent and the coverage rate for females was 97.2
percent. Also, the coverage rates (94.1%) for those within the 20-29 and 30-39 age
groups are relatively lower compared to the coverage rates of the other age groups.
There was a high rate of agreement between the 2010 PHC data and the PES data for
sex (98.8%), marital status (94.6%), relationship to head of household (90.5%) and
age (83.0%).
1.6.5 Release and dissemination of results
The provisional results of the census were released in February 2011 and the final results in
May 2012. A National Analytical report, six thematic reports, a Census Atlas, 10 Regional
Reports and a report on Demographic, Social, Economic and Housing were prepared and
disseminated in 2013.
1.6.6 Concepts and definitions
Introduction
The 2010 Population and Housing Census of Ghana followed the essential concepts and
definitions of a modern Population and Housing Census as recommended by the United
Nations (UN). It is important that the concepts, definitions and recommendations are adhered
to since they form the basis upon which Ghana could compare her data with that of other
countries.
The concepts and definitions in this report cover all sections of the 2010 Population and
Housing Census questionnaires (PHC1A and PHC1B). The sections were: geographical
location of the population, Household and Non-household population, Literacy and
Education, Emigration, Demographic and Economic Characteristics, Disability, Information
Communication Technology (ICT), Fertility, Mortality, Agricultural Activity and Housing
Conditions.
The concepts and definitions are provided to facilitate understanding and use of the data
presented in this report. Users are therefore advised to use the results of the census within the
context of these concepts and definitions.
Region
There were ten (10) administrative regions in Ghana during the 2010 Population and Housing
Census as they were in 1984 and 2000.
9District
In 1988, Ghana changed from the local authority system of administration to the district
assembly system. In that year, the then existing 140 local authorities were demarcated into
110 districts. In 2004, 28 new districts were created; this increased the number of districts in
the country to 138. In 2008, 32 additional districts were created bringing the total number of
districts to 170. The 2010 Population and Housing Census was conducted in these 170
administrative districts (these are made-up of 164 districts/municipals and 6 metropolitan
areas). In 2012, 46 new districts were created to bring the total number of districts to 216.
There was urgent need for data for the 46 newly created districts for planning and decision-
making. To meet this demand, the 2010 Census data was re-programmed into 216 districts
after carrying out additional fieldwork and consultations with stakeholders in the districts
affected by the creation of the new districts.
Locality
A locality was defined as a distinct population cluster (also designated as inhabited place,
populated centre, settlement) which has a NAME or LOCALLY RECOGNISED STATUS. It
included fishing hamlets, mining camps, ranches, farms, market towns, villages, towns, cities
and many other types of population clusters, which meet the above criteria. There were two
main types of localities, rural and urban. As in previous censuses, the classification of
localities into ‘urban’ and ‘rural’ was based on population size. Localities with 5,000 or more
persons were classified as urban while localities with less than 5,000 persons were classified
as rural.
Population
The 2010 Census was a “de facto” count and each person present in Ghana, irrespective of
nationality, was enumerated at the place where he/she spent the midnight of 26th September
2010.
Household
A household was defined as a person or a group of persons, who lived together in the same
house or compound and shared the same house-keeping arrangements. In general, a
household consisted of a man, his wife, children and some other relatives or a house help who
may be living with them. However, it is important to remember that members of a household
are not necessarily related (by blood or marriage) because non-relatives (e.g. house helps)
may form part of a household.
Head of Household
The household head was defined as a male or female member of the household recognised as
such by the other household members. The head of household is generally the person who has
economic and social responsibility for the household. All relationships are defined with
reference to the head.
Household and Non-household population
Household population comprised of all persons who spent the census night in a household
setting. All persons who did not spend the census night in a household setting (except
otherwise stated) were classified as non-household population. Persons who spent census
night in any of the under listed institutions and locations were classified as non-household
population:
10You can also read