INDONESIA ON THE THRESHOLD OF POPULATION AGEING - No.1 UNFPA Indonesia Monograph Series
←
→
Page content transcription
If your browser does not render page correctly, please read the page content below
UNFPA Indonesia
Monograph Series:

No.1

INDONESIA
ON THE THRESHOLD OF
POPULATION AGEING

UNFPA Indonesia
            Monograph Series:

                    No.1

          INDONESIA
ON THE THRESHOLD OF
  POPULATION AGEING
Contributors

Authored by:
Professor Sri Moertiningsih Adioetomo
(Demographic Institute, Faculty of Economics - University of Indonesia)
Dr. Ghazy Mujahid
(York Centre for Asian Research, Toronto, Canada)

Edited by
Horst Posselt (UNFPA)

Disclaimer
Funding for this work was provided by UNFPA, the United Nations Population Fund.
The findings,interpretations and conclusions presented in this document are those
of the authors, not necessarily those of UNFPA, and do not reflect the policies and
positions of the Government of Indonesia.

Contents

Foreword and Acknowledgement...................................................................................................... vii
Note From the Authors .......................................................................................................................... ix
Abbreviations and Acronyms............................................................................................................... x
Executive Summary.................................................................................................................................. xi
Introduction................................................................................................................................................. xv

Chapter 1 :
The Demographics of Ageing in Indonesia........................................... 1
   1.1    Decline in fertility.........................................................................................................                      2
   1.2    Decline in mortality......................................................................................................                         3
   1.3    Changes in Age Structure..............................................................................................                             5
   1.4    Demographic impact of changes in age structure.........................................................                                            6
          1.4.1 Dependency ratio....................................................................................................                         6
          1.4.2 Median Age.............................................................................................................                      7
          1.4.3 Ageing Index...........................................................................................................                      8
          1.4.4 Potential Support Ratio...........................................................................................                           9

Chapter 2:
Characteristic Features of Population Ageing..............................11
   2.1 Ageing of the older population..................................................................................... 12
       2.1.1 Impact of ageing of the older population............................................................... 13
   2.2 Feminization of ageing................................................................................................. 14
       2.2.1 Greater vulnerability of older women.................................................................... 16
   2.3 Rural-Urban differences in population ageing............................................................... 20

Chapter 3:
Provincial Variations in Population Ageing......................................23
   3.1 Provincial distribution of population............................................................................ 24
   3.2 Factors explaining inter-provincial variations in ageing................................................. 25
       3.2.1 Impact of fertility differentials on provincial variations in ageing........................... 27
   3.3 The projected provincial pattern of population ageing................................................. 28
       3.3.1 Inter-provincial differences in population growth projections - associated with
             population ageing...................................................................................................29

Chapter 4:
Emerging Ageing-Related Issues................................................................33
   4.1 Key issues facing older persons.................................................................................... 34
   4.2 Older persons living with a disability........................................................................... 34
   4.3 Providing appropriate living arrangements.................................................................. 38

                                                                                                                                                                   iii
4.4 Ensuring income security in old age............................................................................. 41
       4.5   Meeting the growing demand for health services........................................................ 44

     Chapter 5 :
     Demographic Change in the ASEAN countries...................................47
       5.1 Indonesia in the ASEAN................................................................................................ 48
       5.2 Fertility and Mortality trends in the ASEAN region....................................................... 49
           5.2.1 Fertility trends in the ASEAN region........................................................................ 49
           5.2.2 Mortality in the ASEAN region................................................................................ 50
       5.3 Population ageing in the ASEAN region........................................................................ 51
           5.3.1 Past and projected trends in ASEAN ageing............................................................ 51
           5.3.2 The impact of population ageing in ASEAN countries............................................. 51

     Chapter 6 :
     Conclusion and Recommendations..........................................................55
       6.1 Economic, health and social implications of population ageing.................................... 56
           6.1.1 Financial security.................................................................................................... 56
           6.1.2 Health care.............................................................................................................. 57
           6.1.3 Social support......................................................................................................... 58
       6.2 Conclusion.................................................................................................................... 59
       6.3 Recommendations for Policy and Research.................................................................. 60
           6.3.1 Financial security.................................................................................................... 60
           6.3.2 Health and Health care........................................................................................... 61
           6.3.3 Social support......................................................................................................... 62
           6.3.4 Avoiding ageing-related problems.......................................................................... 62
           6.3.5 Advocacy for Provincial Executives......................................................................... 63
       6.4 The need for further research....................................................................................... 64
       6.5 Regional cooperation................................................................................................... 64

     Bibliography............................................................................................................65
     Apendix tAble 1.......................................................................................................66

iv    INDONESIA ON THE THRESHOLD OF POPULATION AGEING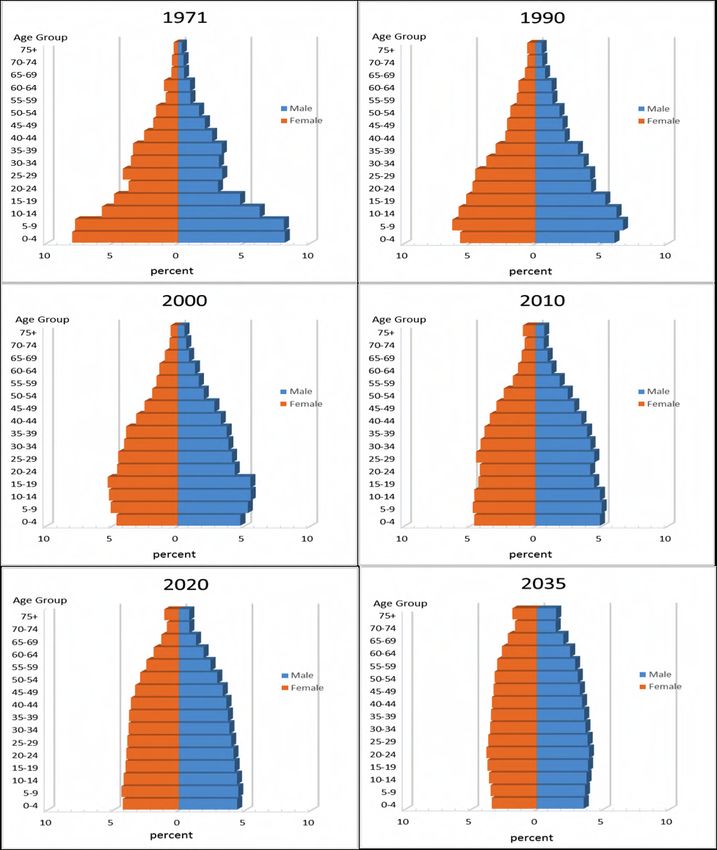
List of Tables
Table 1    Total and older population in Indonesia, 1971-2035...................................................... xv
Table 2    The past and future of population ageing in Indonesia, 1971-2010-2035..................... 6
Table 3    Age-sex differentials in life expectancy in Indonesia, 1971, 1990, 2010......................... 16
Table 4    Educational attainment of older population by age and sex: Indonesia, 2010............. 19
Table 5    Rural-urban fertility differentials in Indonesia, 1967-1970............................................. 20
Table 6    Ageing and feminization of older population by residence: Indonesia, 2010............... 21
Table 7    Provincial distribution of older people and the relative size of the older population in
           each province: Indonesia, 2010.................................................................................... 24
Table 8    Population ageing and fertility by province: Indonesia, 2010....................................... 26
Table 9    Distribution of provinces by extent of population ageing: 2010-2035.......................... 29
Table 10   Share of older persons in total population of province: 2010-2035............................. 31
Table 11   Prevalence of disability by agegroup and sex: Indonesia, 2010.................................... 35
Table 12   Prevalence of disability by severity/multiplicity type among older persons by age and
           sex: Indonesia, 2010...................................................................................................... 35
Table 13   Percentage of older persons with functional difficulties by type and degree of difficulties
           and age and sex: Indonesia, 2010................................................................................ 37
Table 14   Percentage of older population by age, sex and living arrangement: Indonesia, 2010 ... 39
Table 15   Incidence of poverty in the older population by age, gender and residence: Indonesia,
           2009.............................................................................................................................. 41
Table 16   Labour Force Participation rates by age, sex and residence: Indonesia, 2010.............. 42
Table 17   Percentage of employed older persons by agegroup, sex and employment status:
           Indonesia, 2010............................................................................................................. 43
Table 18   Percentage of employed older persons by age, sex and industry of employment:
           Indonesia, 2010............................................................................................................. 43
Table 19   Percentage of population reporting health complaint during the last month by age group
           and sex: Indonesia, 2012............................................................................................... 44
Table 20   Incidence of selected Non Communicable Diseases in older population by age and sex:
           Indonesia, 2007............................................................................................................ 45
Table 21   Total population and older population in ASEAN countries, 2010................................ 48
Table 22   Past and projected trends in fertility in ASEAN countries, 1950-2050.......................... 49
Table 23   Past and projected trends in mortality in ASEAN countries, 1950-2050....................... 50
Table 24   Population ageing in ASEAN countries, 1950-2050....................................................... 51
Table 25   Impact of population ageing in ASEAN countries, 1950-2050...................................... 52

List of Figures
Figure 1   Past and future trends in Total Fertility Rate (TFR) and Net Reproduction Rate (NRR):
           Indonesia, 1971-2035.................................................................................................................   2
Figure 2   Past and future trends in Infant Mortality Rate and life expectancy: Indonesia, 1971-2035.                                              3
Figure 3   Population Pyramid of Indonesia, 1971-2010-2035.......................................................                                  4
Figure 4   Distribution of population by major agegroups: Indonesia, 1971-2035.........................                                            5

                                                                                                                                                       v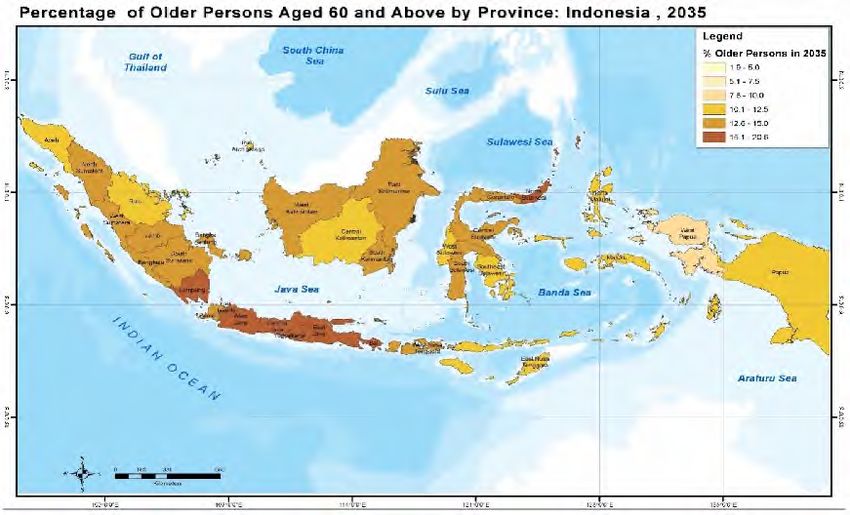
Figure 5       Past and projected trends in Dependency Ratio: Indonesia, 1971-2035.......................                                    7
     Figure 6       Median Age: Indonesia, 1971-2035...............................................................................               8
     Figure 7       Past and projected trends in the Ageing Index: Indonesia, 1971-2035..........................                                 8
     Figure 8       Past and projected trends in the Potential Support Ratio, 1971-2035...........................                                9
     Figure 9       Ageing of the older population in Indonesia, 2010-2035..............................................                         12
     Figure 10      Labour force participation of older persons by age: Indonesia, 2010..........................                                13
     Figure 11      Older population by agegroup and marital status: Indonesia, 2010.............................                                14
     Figure 12      Proportion of females in Indonesia’s older population.................................................                       15
     Figure 13      Feminization of ageing: Indonesia, 2010.......................................................................               15
     Figure 14      Labour Force Participation rates of older males and females by age: Indonesia, 2010...                                       17
     Figure 15      Proportion of singles in older population by age and sex: Indonesia, 2010..................                                  18
     Figure 16      Percentage of older persons living alone by age and sex: Indonesia, 2010..................                                   18
     Figure 17      Education attainment of the female older population: Indonesia, 2010 & 2035..........                                        19
     Figure 18      Total Fertility Rate and population ageing across the provinces: Indonesia, 2010.......                                      27
     Figure 19      Life expectancy at birth and population ageing across the provinces: Indonesia, 2010..                                       27
     Figure 20      Percentage of older population by age and living arrangement: Indonesia, 2010........                                        38

     List of Pictures
     Picture 1 The changing pattern of population ageing across Indonesia’s provinces, 2010.......... 30
     Picture 2 The changing pattern of population ageing across Indonesia’s provinces, 2035.......... 30

     Appendix tables:
     Apendix Table 1
     Population Census counts (in ‘000s) of older people by age, sex and selected characteristics:
     Indonesia, 2010.............................................................................................................................. 66

vi     INDONESIA ON THE THRESHOLD OF POPULATION AGEING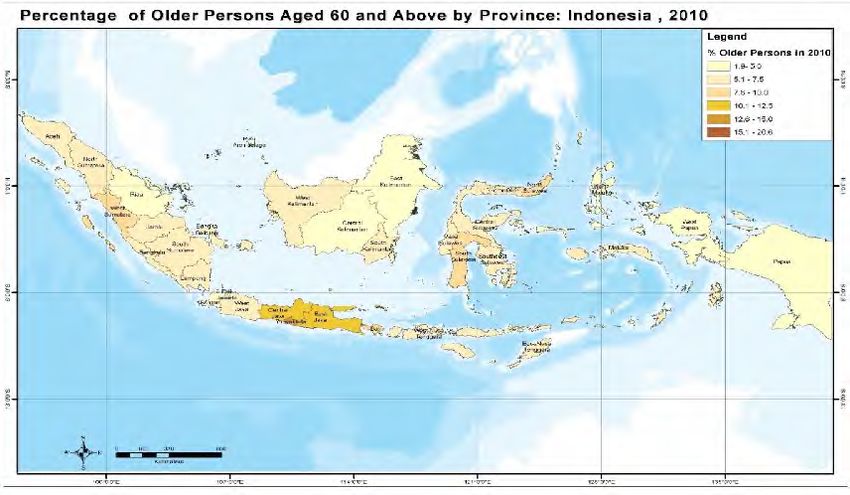
Foreword and Acknowledgement

In Indonesia, as in other countries around the world, the number
of births is declining while life expectancy is rising. The world
today is experiencing rapid demographic change, characterised
by the fastest-growing segment of the world population being
those aged 60 and over. This phenomenon is widely known to
impact on issues of pensions, social insurance, taxation and, most
importantly, the welfare of the elderly.

UNFPA, the United Nations Population Fund, continues to support
BPS-Statistics Indonesia in disseminating census results and
ensuring their broader utilization through various initiatives. One
of these initiatives, besides supporting the 2010 Population Census
documentation exercise, is the development of a series of census-
based thematic monographs focused on emerging population
issues and social trends of public policy concern.

This monograph on Indonesia’s ageing population is the first in this series. Besides ageing, the series
of monographs will cover other population-related issues such as youth, urbanisation, internal
migration and gender. The output component of this ageing monograph is to provide high-quality
statistical information to support informed debate on policies and programmes related to Indonesia’s
ageing population and the wellbeing of its older people.

The aim of this publication is to present an authoritative yet reader-friendly description of
contemporary data relating to older people that describes i) the size and structure of the elderly
population and how it has changed over time; ii) the demographic trends underpinning population
ageing in Indonesia; and iii) the life circumstances of older people and how they vary depending on
age, sex, place of residence and other characteristics.

This publication is an updated and extended version of an earlier version of the same monograph
that was published in 2013 in Jakarta. It now includes the official population projections for 2010-
2035, released by BPS-Statistics Indonesia and launched by the President of the Republic of Indonesia
in January 2014, and has also been extended to include a chapter showing the pace of population
ageing in other countries in the ASEAN region.

It is hoped that this monograph will draw attention to pressing issues related to ageing in Indonesia.
The data analysis pointed to areas for further research such as the difference in morbidity rate for
men and women, and issues that affect older women in particular, including certain types of sexual
and reproductive health-related illnesses, as well as social protection for older women who are
vulnerable to gender-based violence, poverty and abandonment.

It is with pleasure that we present this monograph, Indonesia on the Threshold of Population
Ageing. We hope that it will serve as a valuable reference for advocates of the elderly, as well as
government, academic, development, civil society and other stakeholders, in promoting, developing
and implementing policies and programmes to support the wellbeing of Indonesia’s older people
and the prosperity of the country as a whole.

                                                                                                          vii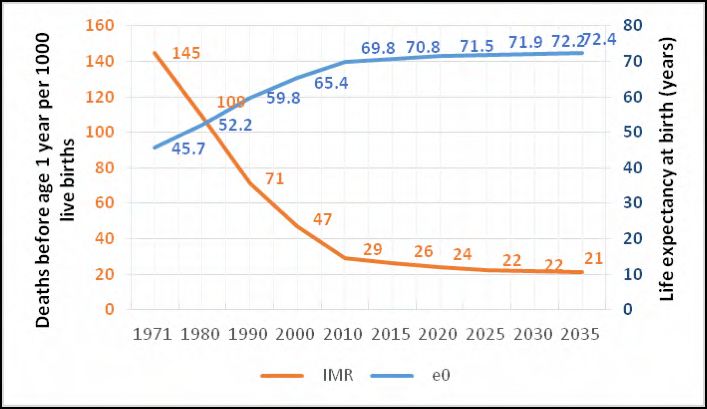
This monograph was primarily prepared and co-authored by Professor Sri Moertiningsih Adioetomo
       (University of Indonesia) and Dr. Ghazy Mujahid (York Centre for Asian Research). My greatest
       appreciation goes to them both as the two authors of this report. I also would like to acknowledge
       the valuable contributions made by Mr. Horst Posselt and Professor Mayling Oey-Gardiner, Ph.D.,
       who provided very constructive input as reviewers.

       I also wish to thank UNFPA staff, Mr. Richard Makalew, Mr. Dikot P. Harahap and Mr. Narwawi
       Pramudhiarta for their technical and substantive support for and commitment to developing this
       monograph. I also thank Mr. Dedek Prayudi (UNFPA) and Ms. Catriona Croft-Cusworth for their
       review and editing in the final stage of the development of the monograph. Finally, my gratitude
       goes to BPS-Statistics Indonesia for providing access to the 2010 Population Census data files and
       other authoritative data sets.

       Mr. Jose Ferraris
       UNFPA Representative in Indonesia

       Jakarta, August 2014.

viii    INDONESIA ON THE THRESHOLD OF POPULATION AGEING
Note From the Authors
The publication of this monograph would not have been possible without the support of UNFPA
Indonesia, and especially its Representative, Mr. Jose Ferraris. We would like to thank Mr. Ferraris,
or Pak Pepe as we know him, for his guidance and assistance in developing the content and outline
for this monograph, and ensuring its high quality. Thanks also go to Dr. Richard J. Makalew, Mr. Dikot
P. Harahap and Mr. Narwawi Pramudhiarta from UNFPA Indonesia, who provided valuable technical
assistance in developing this monograph. A million thanks go to Mr. Nashrul Wajdi, who assisted
in painstakingly processing the large number of observations in the data of the 2010 Population
Census. Without his overall assistance, and particularly his statistical expertise, we would not have
been able to see the pictures and profiles of Indonesian older people in this report.
Many thanks go to Professor Mayling Oey-Gardiner, Ph.D., and Mr. Horst Posselt from UNFPA
Indonesia, who reviewed the draft of this monograph and provided highly useful technical and
substantive input to improve the quality of the report. Our gratitude also goes to Mr. Dedek Prayudi
from UNFPA Indonesia, who carried out the final review and edit of the monograph.
Finally, we would like to thank BPS-Statistics Indonesia for providing the 2010 Population Census data
set. Dissemination of such data helps researchers to improve their technical skills in using data to
support governments in developing precise and timely policy action. Responsibilities for errors and
omissions rest entirely with us, while comments and criticism are welcome, and should be directed
to us.
Jakarta, August 2014
Prof. Sri Moertiningsih Adioetomo, Ph.D. Dr. Ghazy Mujahid
Faculty of Economics, University of Indonesia York Centre for Asian Research
Toronto, Canada
ixAbbreviation and Acronyms
ASFR Age Specific Fertility Rate
ASEAN Association of South East Asian Nations
ASLUT Asisteni Lanjut Usia Terlantar (Assistance to Displaced Older People)
Badan Kependudukan dan Keluarga Berencana Nasional (National Population and
BKKBN Family Planning Coordination Board)
BPS Badan Pusat Statistik (Statistics Indonesia)
IDHS Indonesia Demographic Health Survey
IMR Infant Mortality Rate
ISEAS The Institute of South East Asian Studies
NCD Non Communicable Disease
Nilai Keluarga Kecil Bahagia Sejahtera (The Happy and Prosperous Small Family
NKKBS Values)
NRR Net Reproductive Rate
PBI Penerima Bantuan Iuran (Premium Payment Assistance)
RISKESDAS Basic Health Research
SUSENAS Survey Sosial Ekonomi Nasional (National Socio-economic Survey)
TFR Total Fertility Rate
UN United Nations
UNFPA United Nations Population Fund
WHO World Health Organisation
x D T T D T
IN
ONESIA
ON
HE
HRESHOL
OF
POPULA
ION
AGEINGExecutive Summary
Findings
Indonesia is heading toward an ageing population. In 2010, the population census found that the
number of people aged 60 years and above was 18.1 million, or 7.6 percent of the total population.
This number is projected to increase to 33.7 million, or 11.8 percent of the population, by 2025 and
to reach 48.2 million, or 15.8 percent, by 2035. Indonesia’s age structure is gradually shifting toward
having more people in higher age groups, indicated by an increase in median age from 27.2 years in
2010 to a projected 33.7 years in 2035. The Ageing Index, which is the ratio of older persons per 100
children (aged 0-14 years), is projected to increase from 26.3 in 2010 to 73.4 in 2035. Meanwhile, the
Potential Support Ratio, or the average number of workers who have the potential to support older
persons, is expected to decline from 13 workers per one older person in 2010 to only 6.4 workers
in 2035. This demographic transition poses challenges for policy makers on how to maintain older
people’s quality of life.
In Indonesia, provincial disparity of ageing can be explained by disparity in family planning
performance. Provinces with great success in reducing fertility, such as East Java, show the fastest
ageing process. The increment of older person in East Java will be 24.2 percent above the increment
of total population 2010-2035. Meanwhile, older persons will constitute only 17.4 percent of the
increase in East Nusa Tenggara’s population. Therefore, policy makers should not only focus on the
effect of fertility reduction, but also on the ageing process.
Morbidity increases with age. The most common health complaints reported by Indonesian older
persons are fevers (7-10 %), coughs (13-23%), colds (10-12%), asthma (1-11%), diarrhoea (1-2.4%),
recurring headaches (5-11%) and toothaches (0.8-1.8%). The most common non-communicable
diseases are asthma (5-6%), heart disease (3%), rheumatism (30-35%), hypertension (18-24%) and
cataracts (5-6%). Incidence among older women is always higher than that of men.
Disability also increases significantly with age, with 26percent of the older population being affected.
The proportion of the older population reporting a disability in 2010 was 28.2 percent among older
women, compared to 23.4 percent among older men. Difficulties in seeing, hearing and climbing
stairs are common problems suffered by older Indonesians. Cataracts cause loss of sight, which
hampers older people from conducting their usual activities, and from working, thereby leading to
income loss. Loss in hearing prevents older persons from engaging in social activities due to their
difficulties in communication with others, which leads to increasing loneliness and social exclusion.
Difficulty in climbing stairs is the impact of, among other things, arthritis. These types of illnesses are
degenerative diseases that accompany the ageing process. However, some can easily be cured by
surgery,as in the case of cataracts, while the effects of others can be reduced with the use of assistive
devices.
xiAnother challenge for policy makers in maintaining quality of life for older persons is the decreasing
rate of labour force participation. In 2010, half of Indonesia’s older persons aged 60 years and
above were still active in the labour force, although this figure decreased from 61.4 percent of those
aged 60-69 years, to 40.9 percent of those aged 70-79 years, and only 22.5 percent for those aged
80 years and above. Decreased labour force participation is an indication of decreased economic
independence, which brings consequences for policy makers on how to support economic security
for older persons. The greatest concern is that 37.2 percent of males and 12.3 percent of females
aged 80 years and above were reported to be still economically active. Most of these working older
persons are not absorbed in formal sector, but in the informal sector, thus raising questions on
whether their work is for leisure, is compulsory, or is a survival strategy. In Indonesia, as in other
developing countries, the incidence of poverty among older persons is high, and increases with age.
The pension system, to the extent it exists, has limited coverage. That is why some older persons
need to continue to engage in income-earning activities to meet basic needs.
Another concern is how to find appropriate living arrangements for older persons. The proportion of
singles among older persons increases with age, and those living alone are more likely to be women
than men. Indonesians tend to place importance on the value of extended family. In 2010, about 36
percent of older persons lived with three generations in one household, providing potential support
Policy Recommendations
1. On providing economic security: it is suggested that policy makers provide a gender response
intervention on employment opportunities for older persons who still want to work, and facilitate
this through easy access to small credit for self-employed older persons. Regulations should also
be developed for older persons’ formal employment in jobs that are suitable to their physical
and mental capacities. The existing poverty reduction programme should focus on older persons
who are poor and neglected, while the ASLUT (Assistance to Displaced Older People) programme
coverage should be expanded and better targeted. Since life expectancy is increasing, the formal
age for retirement should be revised and extended. Any interventions for improving the economic
security of older persons should take into account those likely to be in greatest need of support.
This includes include older people with little or no income of their own due to disability, illness
and old age, widowed women, and especially older men and women who live alone. Adequate
support should also be provided for the many less-well-off elderly people who live in rural areas.
Given that a high proportion of older persons, particularly women, have little or no education,
governments and communities should develop appropriate education and training programmes
for older persons. With better knowledge, older persons would have the opportunity to access
helpful information such as information on the availability of employment opportunities suitable
to their circumstances, or on the availability of services that have been designed to meet their
special needs.
2. On strengthening health care: intervention must be prioritized for the oldest-old women, with a
special focus on those who live alone and in rural areas. Home care or day care must be expanded,
strengthening the role of community participation. Older persons who are poor, neglected or
having difficulties in self-care should be treated with long-term care. All older persons should
have free access to certain types of surgery, for example, to treat cataracts, which cause loss of
xii INDONESIA ON THE THRESHOLD OF POPULATION AGEINGvision but can be easily surgically removed.It is also suggested to provide poor and vulnerable
older persons with free hearing aids, to alleviate the loss of hearing. Rehabilitation services
should be made accessible to older persons who have difficulties moving or climbing stairs. The
existing Jaminan Kesehatan Nasional (Universal Health Care) should be widely disseminated to
older persons, and for those who cannot afford to pay insurance, the premium should be paid
by the government, through the PBI (Premium Payment Assistance ) beneficiaries on behalf of
them.
3. On improving social support: intergenerational relationships can be strengthened by maintaining
three generations living under the same roof. The decrease in potential support for older people
in rural areas is due to outmigration of caregivers. General decline in the number of children per
family may also reduce the availability of informal care available for older persons in the future,
which could possibly be addressed by strengthening the motivations of other relatives, such as
those from nearby households, and members of local community groups to provide home care
services for those with support needs. The availability of training in home care and rehabilitation
services is important to anticipate the increasing number of older persons. Better-off and more
educated older persons should be encouraged and enabled to use mobile phones and the
Internet. This can help them to avoid social isolation and dysfunction. Mobile phones and the
Internet can help older people to expand their social networks and to usefully share experiences
and information on services for older persons. With IT, intergenerational relationships can be
maintained even when living long distances apart. Transfer of funds for older persons can also be
facilitated through Internet banking.
4. On avoiding ageing-related problems: ageing preparedness of young people toward active ageing
should be widely publicized and strengthened. To maintain independence of today’s workers as
they grow old, it is important that they have productive employment with decent pay, so that
they can afford to enrol in private health insurance and save to maintain their quality of life for
their years of retirement.
5. On advocacy for Provincial Executives: the ageing process should be anticipated with appropriate
intervention in provinces with declining fertility.
6. On the need for further research: appropriate policy interventions on the availability of accurate
data disaggregated by age and sex is highly important and should be developed. Further research
needs to be carried out to provide more detailed analysis for evidence-based policy making.
7. On Regional Cooperation: as all ten member countries of the Association of Southeast Asian
Nations (ASEAN) are faced with a situation of unprecedented increase in population ageing, they
could gain from exchanging experiences in addressing ageing-related issues. Indonesia, as the
most populous ASEAN country, could take the lead in lobbying ASEAN to take up the issue of
population ageing at the regional level. ASEAN could play a pivotal role in promoting regional
cooperation to facilitate inter-country dialogue and policy research at the regional level.
xiiiIntroduction
In the early 1970s, Indonesian women had an average of 5 to 6 children. Recognizing high fertility
as major factor contributing to widespread poverty, the government launched a comprehensive
family planning programme to bring it down. The programme came to be rated as one of the most
successful in the World.1 Indonesia being a predominantly Muslim country made the success of the
family planning all the more spectacular. The Indonesian experience was used as an example of how
proponents of family planning could engage and work with orthodox religious groups.2
The total fertility rate started declining and, by the turn of the century, had dropped to less than half.
At the same time, measures were introduced to improve access to quality health care that resulted
in significant declines in mortality: life expectancy increased from 45 years in 1971 to over 65 years
by the turn of the century. Indonesians were, on average, enjoying a longer life span. As a result of
declining fertility and mortality rates, the age structure began to shift towards the higher age groups
and the latest 2010 Census has shown that Indonesian policy makers need to prepare for a rapid
increase in the country’s older population during the coming years.
According to Census findings, Indonesia’s
T 1
future demographic scenario will be
able
otal and older population in Indonesia, 1971-2035
strikingly different than the past. Table
T
Population (000) % of older 1 shows how the 2010 Census has
Year Older persons in highlighted the start of a rapid increase
Total (60+) population
in older persons in the country. The
1971 118,368 5,307 4.5 2010 Census enumerated 18 million
1990 179,243 11,278 6.3 older persons (aged 60 years and over)3,
accounting for 7.6 percent of Indonesia’s
2010 237,641 18,044 7.6
total population. This represented an
2015 255,462 21,685 8.5
increase of 3.1 percentage points over
2020 271,066 27,088 10.0 the corresponding figure of 4.5 percent
2025 284,829 33,696 11.8 in 1971, four decades ago. According
2030 296,405 40,956 13.8 to projections based on the Census,
the proportion of older population will
2035 305,652 48,199 15.8
increase continuously and reach 15.8
Source: Population Census 1971, 1990 and 2010 [data file], and; percent, an increase of 8.2 percentage
Indonesia Population Projection 2010-2035
points by 2035.
1 During the period 1970-2010, the programme prevented an estimated 100 million births. “Family planning prevents 100M
births: BKKBN”, The Jakarta Post, (Bantul, 16th July 2013): http:// www. the jakartapost.com /news /2013/07/16/family-planning-
prevents-100m-births-bkkbn.html
2 Shiffman, J (2004) – “Political management in the Indonesian family planning programme”, International Family Planning
Perspectives, (Vol.3, No.1)
3 “Older persons” are defined chronologically as those aged 60 years and over. This definition was endorsed by the Second
World Assembly on Ageing (Madrid, 2002) as a standard. However, the Assembly did not bind individual countries to this
definition, allowing each country to choose whatever cut off age it thought best for purposes of national policies given its
demographic and socio-cultural circumstances. In this Monograph, older persons are defined as those 60 years and over, and
the terms “older person”, “old” and “elderly” are used interchangeably.
xvIn absolute numbers, this means that while the population of older persons increased on average by
0.33 million per year during the four decades preceding the 2010 Census, it is projected to increase
by 1.2 million per year during the next 25 years. “Population ageing”, defined as an increasing
proportion of older persons in total population, is therefore going to occupy a predominant position
in Indonesia’s demographic scenario during the next few decades. In global initiatives on ageing
too, Indonesia will occupy a prominent position as the 18 million Indonesian elderly represent the
World’s 8th largest conglomeration of older persons.
Indonesia’s situation typifies the experience of most developing countries as portrayed in a report
jointly prepared by UNFPA and HelpAge International to commemorate the Madrid+10 Convention
(2012) and appropriately entitled ‘Ageing in the 21st Century, a Celebration and a Challenge’.4 In
Indonesia too, population ageing merits a celebration of the achievements of its family planning and
reproductive health programme. At the same time it presents a challenge that policy makers need to
address during the current 21st century. Until the close of the 20th century, population ageing figured
as an issue largely in the developed countries. In most developing countries it began to emerge
at the turn of the century. Moreover, for the developing countries, the challenge of population
ageing, in addition to being unprecedented, is also more complex than it was for the developed
countries because of two main reasons. First, population in the developing countries is projected to
progress far more rapidly than it did in the developed countries.5 Secondly, and more importantly,
the developing countries are faced with the issue of population ageing at much lower levels of
economic development than were the developed countries.
The developed countries experienced a slower pace of population ageing and after they had attained
a reasonably high level of economic development. As such, they had more time and resources to
gradually adjust their social and economic policies and introduce measures to meet the increasing
demands of older persons and to guarantee their quality of live. The situation in the developing
countries is very different. Developing countries are at low levels of economic development and lack
resources needed to ensure the quality of life of a rapidly increasing older population. This point was
effectively highlighted at the Second World Assembly on Population Ageing (Madrid, 2002) by Gro
Harlem Brundtland when she emphasised the need to recognize the stark difference between what
developing countries are now faced with compared to what developed countries faced in coping
with population ageing: “We must be fully aware that while the developed countries became rich
before they became old, the developing countries will become old before they become rich”.6 For
Indonesia too, population ageing has emerged before the country has reached a stage where it can
afford to allocate sufficient resources needed to take care of the projected rapid increase in its older
population.
This Monograph discusses population ageing in Indonesia using information provided by the 2010
Census enumeration, supplemented by information from other sources wherever needed and
available. It explains factors leading to population ageing and provides a profile of Indonesia’s older
population, including its demographic and socio-economic characteristics. It also reviews differences
in the extent of ageing across Indonesia’s 33 provinces. The Monograph brings out the various issues
4 UNFPA & HelpAge International (2012) Population Ageing in the 21st Century: A Celebration and a Challenge
5 See Kinsella, K & Phillips, D.R. (2005) “Global challenge of ageing: the challenge of success” Population Bulletin (Vol.60, No., 1
Population Reference Bureau)
6 Brundtland, G.H. (2002) Statement in Building a Society for All Ages (press kit of the Second World Assembly on Ageing),
xvi INDONESIA ON THE THRESHOLD OF POPULATION AGEINGemanating from the increasing proportion of older persons in the population and provides policy
recommendations for addressing these.
The Monograph is divided into six chapters. Chapter 1 describes the demographics of ageing in
Indonesia and its demographic impact. This includes a discussion of the fertility decline, improvements
in life expectancy and the various indicators of ageing. Chapter 2 highlights the characteristic features
of population ageing: the gradual shift towards older ages within the older population; the high
female:male ratio among the elderly; and the rural-urban differences in population ageing. Chapter
3 reviews how the extent of population ageing varies across the country’s 33 provinces. Chapter 4
discusses the wide-range of issues emanating from population ageing which policy makers would
need to address. A brief review of population ageing trends in the ASEAN7 countries is presented
in Chapter 5 to see how relevant the issue is at the regional level. Chapter 6 summarizes the main
findings of the analysis and provides relevant policy recommendations.
7 Association of Southeast Asian Nations
xviiChapter 1: The Demographics of Ageing in Indonesia
At the beginning of the 1970s, both fertility and mortality were high in Indonesia. The total fertility
    rate was 5.6 children per woman while life expectancy stood at 46 years. Following the introduction
    of a vigorous family programme and measures undertaken to reduce the incidence of serious
    illnesses and to improve access to quality health care, Indonesia began its demographic transition
    towards low fertility and mortality. This generated a gradual shift in the age structure towards higher
    age groups. The Census has shown that, as Indonesia continues to move towards completing its
    demographic transition to the low fertility-low mortality stage, it faces the prospects of rapid ageing
    in the next few decades. This chapter explains the process of population ageing in Indonesia.

    1.1 Decline in fertility
    Until the early 1970s, large family sizes were the norm with an average of 5 to 6 children. The pro-
    natalist culture, supported by Ahmad Sukarno, the First President of Indonesia, was based on the
    premise that Indonesia was capable of supporting a much larger population.8 It was the realization
    that large family size was an obstacle to development that led the New Order government of
    President Suharto (1965-1988) to initiate the national family planning programme in the early 1970s.
    The programme succeeded in changing parents’ perception to a smaller family size. A massive
    campaign to promote contraception enabled couples to achieve the lower family size they desired.

    The usage of modern methods of contraception among married women increased from virtually
    zero during the 1960s to 47 percent in 1991 and then gradually to 57 percent in 2002/2003.9 The
    implementation of the family planning programme was heavily centralized and was accompanied by
    a mass campaign to change the society’s perception from large family to small and prosperous family

    Figure 1
    Past and future trends in Total Fertility Rate (TFR) and Net Reproduction Rate (NRR):
    Indonesia, 1971-2035

    Source: Population Census 1971, 1990 and 2010 [data file], and; Indonesia Population Projection 2010-2035

    8 Hull, Terence (ed.) (2005) People, Population and Policy in Indonesia,.Ford Foundation, Jakarta and Singapore: Equinox
      Publishing and ISEAS
    9 Measure DHS (1992-2004) Indonesia Demographic and Health Surveys, 1991, 1994, 1997, 2002/3.

2    INDONESIA ON THE THRESHOLD OF POPULATION AGEING
size, the NKKBS – the Happy and Prosperous Small Family Values.10 As a result, the Total Fertility Rate
(TFR), that is, the average number of children born to a woman during her reproductive period (15-
49 years), declined from 5.6 children per woman during 1967-1970 to 4.7 for the period 1976-1979.
As shown in Figure 1, it declined further to 3.3 in 1986-1989 and to 2.3 in 1996-1999.
The 2010 Population Census showed an upturn with TFR increasing to 2.4 for the period 2006-2009.
The Indonesian Demographic and Health Survey (IDHS) showed a stagnant level of TFR at 2.6 per
woman since 2002/3, the year when the decentralisation of family planning was intriduced.11 The
upward trend in fertility shown by the Census is expected to be short-lived and as such have at most
a marginal, if at all any, effect on population ageing. It is projected that fertility will decline during
2010-2035, falling to below replacement level by 2035.
The persistent decline in fertility up to the early 2000s contributed significantly to furthering
Indonesia’s demographic transition. According to results of the official 2010-2035 Population
Projection, published by BPS-Statistics Indonesia fertility will by 2035 drop to below the replacement
level of 2.1. The Net Reproduction Rate, that is, the average number of daughters a woman is
expected to have during her reproductive life, will go down to 0.9.
1.2 Decline in mortality
Studies available on mortality have focussed on trends in the infant mortality rate (IMR) and life
expectancy at birth (eo). The IMR is defined as the number of infant deaths, that is, those occurring
within the first year of birth per 1,000 live births. Life expectancy at birth is the average number of
years a new born baby can be expected to survive given the prevalent mortality conditions. Mortality
and life expectancy are inversely correlated as shown in Figure 2 which shows the past and projected
trends for Indonesia.
Figure 2
Past and future trends in Infant Mortality Rate and life expectancy:
Indonesia, 1971-2035
Source: Population Census 1971, 1980, 1990 and 2010 [data file]; and Indonesia Population Projection 2010-2035
10 Adioetomo, S M, Lalu B & Nizam Y (2010) 100 tahun Demografi Indonesia. Mengubah Nasib Menjadi Harapan. (100 years of
Indonesian Demography. From Destiny to Hope). Jakarta: BKKBN and Demographic Institute FEUI
11 BPS Statistics Indonesia, National Population and Family Planning Board, Ministry of Health and Measure DHS, 2012).
Chapter 1 : 3
The Demographics of Ageing in IndonesiaFigure 3
Population Pyramid of Indonesia, 1971-2010-2035
Source: Population Census 1971, 1990 and 2010 [data file], and; Indonesia Population Projection 2010-2035
4 INDONESIA ON THE THRESHOLD OF POPULATION AGEINGWith the widening of access to quality health care services, the Infant Mortality Rate dropped from
145 in 1971, to 109 in 1985 and further to 71 per 1000 in 1995. On the basis of data collected under
the 2010 census, IMR is estimated at 26 infant deaths per 1000 births.12 This decline is consistent
with findings from the IDHS, but with higher levels of IMR. The 1991 IDHS reported 68 infant deaths
per 1,000 live births, 57 in 1994 and 46 in 1997, further declining to 35 in 2002/3. Since then, the
IDHS have shown IMR to have declined slowly to 34 in 2007 and to 32 infant deaths per 1000 births
in 2007.
With declining mortality, life expectancy increased. From 46 years in 1971, life expectancy at birth
increased to 56 years in 1986. Estimates based on the 2010 Population Census data show a life
expectancy of 70 years: 72.2 years for females and 68.3 for males. It is projected that by 2035, a
newly born Indonesian baby would be expected to live on average to the age 72 years.
1.3 Changes in Age Structure
As a result of declining fertility and improving life expectancy, Indonesia’s age structure has been
gradually shifting towards higher age groups. The process of change in the age structure is illustrated
in Figure 3 through the presentation of population pyramids at various stages of the demographic
transition. The changing shape of the population pyramid through time provides a visual depiction
of the changes in the age structure.
Comparing the pyramids, it can be seen that over time the base of the pyramid becomes narrower.
There is a gradual narrowing of the bottom three layers (depicting ages 0-14 years) which reflects
the declining fertility as a result of Indonesia’s successful family planning programme. At the same
time there is a broadening of the top four layers (depicting ages 60 and over) which results from
improving life expectancy. Figure 4 summarizes the changes in the age structure of the population
focussing on three broad age groups: 0-14; 15-59; and 60 & over.
Figure 4
Distribution of population by major agegroups: Indonesia, 1971-2035
Source: Population Census 1971, 1990 and 2010 [data file], and; Indonesia Population Projection 2010-2035
12 Statistics Indonesia (2011) Population Census 2010: Average Number of Children Have Died per Ever Married Women by
Province and Age Group
Chapter 1 : 5
The Demographics of Ageing in IndonesiaThe proportion of the child population (0-14 years) has been declining since 1971. The share of child
population dropped gradually from 44 percent in 1971 to 29 percent in 2010. The decline is projected
to continue and by 2035 the share of the child population will have fallen to 22 percent. The share
of the adult population13 is projected to increase until 2015 after which it will begin to decline. As
fertility changes impact on the working age population with a time lag, the sustained decline in
fertility will begin to result in lowering the number of entrants to the adult age cohorts after 2015.
The Census has shown that the proportion of older persons increased to 7.6 percent in 2010 from 4.5
percent in 1971. According to projections, the share of the older population will continue to increase
and is projected to reach 15.8 percent by 2035.
Census results have thus shown that the demographic scenario Indonesia faces is characterized by a
consistent increase in the older population. Within the next 25 years, the share of older population
will have more than doubled. Table 2 summarizes the rapidly increasing dominance of the older
person in Indonesia’s population in coming years compared to the past. While increments in the
child and adult population will be much smaller during the next 25 years than during the last 40
years, the projected increase in the older population will be more than twice that in the past. As
such, while the older population accounted for 10.7 percent of the increase in total population during
1971-2010, its share in the increase during 2010-2035 will be 44.9 percent.
T 2
able
he past and future of population ageing in Indonesia, 1971-2010-2035
T
Increment as % of increase in total
ncrements in population (000) population
Period
I
Total 0-14 15-59 60 & > 0-14 15-59 60 & >
1971-2010 119,273 16,563 89,973 12,737 13.9 75.4 10.7
2010-2035 67,1341 -2,432 39404 30,162 -3.6 58.7 44.9
Source: Population Census 2010 [data file], and; Indonesia Population Projection 2010-2035
1.4 Demographic impact of changes in age structure
Changes in the age structure have far reaching socio-economic implications which policy makers
need to be aware of. To effectively address issues emanating from changes in the age structure it
is important to know the magnitude of these changes as well as the speed with which they occur.
There are several demographic indicators that reflect the direction of change in the age structure of
a country. The following four most commonly used indicators are discussed below: (a) dependency
ratio; (b) median age; (c) ageing index; and (d) potential support ratio.
1.4.1 Dependency ratio`
The dependency ratio is commonly used to measure the burden of dependents the working
population has to support. It is estimated as the ratio of the number of persons under the age
13 The term “adult population” is used for the age cohort 15-59 years to distinguish it from the working age population
conventionally defined as aged 15-64 years.
6 D T T D T
IN
ONESIA
ON
HE
HRESHOL
OF
POPULA
ION
AGEINGof 15 years and those aged 65 years and over per 100 persons aged 15-64 years. The underlying
assumption is that those aged 65 years and over and those under 15 years of age are “non-
working” and need to be supported by those aged 15-64 years assumed to be working. The
total dependency ratio can be split into two components: the child-dependency and the old-age
dependency ratios. Figure 5 shows the past and projected trends in the dependency ratios.
Figure 5
Past and projected trends in Dependency Ratio: Indonesia, 1971-2035
Source: Population Census 1971, 1980, 1990, 2010 [data file], and; Indonesia Population Projection 2010-2035
Both the total dependency ratio and the child dependency ratio declined over the period
1971-2010. It is projected that the child-dependency ratio will continue to decline until 2035.
The total dependency ratio will decline until 2030 and then start increasing. This is explained
by the continuing increase in the old-age dependency ratio. While the old-age dependency
ratio increased during 1971-2010, the increase fell short of offsetting the decline in the child-
dependency ratio. The old-age dependency ratio is projected to continue increasing and after
2030 the increase will more than offset the decline in the child dependency ratio, resulting in an
increase in the total dependency ratio. The larger projected increase in the old-age dependency
ratio from 7.6 to 15.6 during the 25 years to 2035 compared to the much smaller increase from
4.7 to 7.6 during the preceding 40 years shows the increasing pace of shift in the age structure of
Indonesia’s population towards older cohorts.
1.4.2 Median Age
A shift in the age structure towards older cohorts is usually reflected in a change in the median
age of the population. The median age is the age that divides the population into two equal
parts, one with ages below the median age and the other with ages above the median age. With
population ageing, the median age tends to rise. The past and projected changes in the median
age of the Indonesian population over the period 1971-2035 are shown in Figure 6.
Chapter 1 : 7
The Demographics of Ageing in IndonesiaFigure 6
Median Age: Indonesia, 1971-2035
Source: Population Census 1971, 1980, 1990 and 2010 [data file], and; Indonesia Population Projection
2010-2035
In 1971, the median age of the Indonesian population was 17.7 years. The Census has shown that
the median age had increased to 27.2 in 2010. It is projected that by 2035, the median age will
be 33.7 years. The upward changes in the median age are a reflection of the shifting of the age
structure towards older cohorts.14
1.4.3 Ageing Index
Figure 7
Past and projected trends in the Ageing Index: Indonesia, 1971-2035
Source: Population Census 1971, 1980, 1990 and 2010 [data file], and; Indonesia Population Projection 2010-2035
14 Mujahid (2006) Population Ageing in East and South-East Asia: Current Situation and Emerging Challanges, Bangkok: UNFPA
8 INDONESIA ON THE THRESHOLD OF POPULATION AGEINGThe ageing index, calculated as the number of older persons (aged 60+) per 100 children aged
0-14 years, shows the balance between the child and older population. The past and projected
trends in Indonesia’s ageing index are shown in Figure 7.
In 1971, there were 10 older persons per 100 children in Indonesia. The Index increased gradually
and stood at 26 in 2010. It is projected to increase to 73 in 2035. The increase projected during
2010-2035 will be much greater than during the preceding 40 years. Policy makers would need
to take into account the changing balance between the population of children and that of older
persons in the formulation of policies targeting these population groups.
1.4.4 Potential Support Ratio
Given the importance of ensuring adequate support for the increasing number of older persons,
it is crucial to assess the impact changes in the age structure on the support base available to
carry the burden of the older population. Potential support ratio, defined as the population aged
15-64 years divided by the population of those aged 65 years and over, is used to indicate the
available support base. The ratio is the inverse of the old-age dependency ratio and is more
commonly used in the context of population ageing as it provides a direct indication of the trend
in the support base available for older persons as their proportion in total population continues
to change. Figure 8 shows changes in the potential support over the period 1971-2010 and the
trend projected during 2010-2035.
Figure 8
Past and projected trends in the Potential Support Ratio, 1971-2035
Source: Population Census 1971, 1980, 1990 and 2010 [data file], and; Indonesia Population Projection 2010-2035.
In 1971 there were on average 21 persons of working age available to support an older Indonesian.
Census results have shown that this figure had fallen to 13 in 2010. The potential support ratio
is projected to continue declining and by 2035 will have fallen to 6.4, that is, to less than half
its current level. Policy makers will have to address issues emerging as a result of the shrinking
support base available for the older persons.
Chapter 1 : 9
The Demographics of Ageing in IndonesiaChapter 2: Characteristic Features of Population Ageing
Evidence presented in Chapter 2 has shown that Indonesia stands on the threshold of population
     ageing. Policy makers will have to take into account the need to address issues emerging from the
     unprecedented increase in the pace of population ageing in the years ahead. It is important to
     note that, in addition to the increase in the proportion and size of the older population, evidence
     from countries around the world has shown that three distinct features typify population ageing: (a)
     ageing of the older population; (b) feminization of aging; and (c) the higher incidence of ageing in
     rural areas. These characteristics have a significant impact on the intensity of ageing-related issues
     and therefore need to be taken into account by policy makers. It is therefore important to review
     the relevance of these three features in the process of population ageing in Indonesia. This Chapter
     summarizes relevant results of the 2010 Census and describes changes expected on the basis of
     projections for the next two decades.

     2.1 Ageing of the older population
     As population ageing progresses, there is usually a gradual shift in the age distribution of the older
     population towards older cohorts.15 This process, termed “ageing of the older population”, has been
     experienced by countries across the World.16 Indonesia too will be faced with the ageing of its older
     population during the next two decades. Figure 9 shows the age distribution of Indonesia’s older
     population as shown by the 2010 Census and the projected trends to 2035.

     As shown in Figure 9, there will be a gradual, albeit slow, shift in the age distribution of the older
     population. As a country’s population begins to age, the population in the “younger” cohorts of

     Figure 9
     Ageing of the older population in Indonesia, 2010-2035

     Source: Population Census 2010 [data file], and; Indonesia Population Projection 2010-2035

     15 Conventionally “ageing of the older population” is defined as the increasing proportion in the older population of the “oldest
        old”, that is, those aged 80 years and over. However, previous to the 2010 Census statistics on the age distribution in Indonesia
        do not give a breakdown of population “75 years and above”.
     16 For a review of ageing of the aged in Asia see Mujahid, Ghazy – Population Ageing in East and South-East Asia: Current Situation
        and Emerging Challenges, (Papers in Population Ageing No.1, UNFPA Country Technical Services Team for East and South-East
        Asia, Bangkok, Thailand, 2006); and Mujahid, Ghazy & Siddhisena, K.A.P. – Demographic Prognosis for South Asia: a Future of
        Rapid Ageing, (Population Ageing No.6, UNFPA Asia and the Pacific Regional Office, Bangkok, Thailand, 2009)

12     INDONESIA ON THE THRESHOLD OF POPULATION AGEING
You can also read