BIOGAS AND HOUSEHOLD AIR QUALITY - versus Wood-fired Stoves in Rural Cambodia Health Improvement of users of Biogas Stoves - Hivos Carbon Credits
←
→
Page content transcription
If your browser does not render page correctly, please read the page content below
BIOGAS AND HOUSEHOLD
AIR QUALITY
Study on Household Air Quality and Estimated
Health Improvement of users of Biogas Stoves
versus Wood-fired Stoves in Rural Cambodia

By Eric Buysman
Household Air Quality Impact of biogas stoves versus wood-fired stoves in Rural Cambodia

      Biogas and Household Air Quality
  Study on Household Air Quality and Estimated
  Health Improvement of users of Biogas Stoves
  versus Wood-fired Stoves in Rural Cambodia

30 October 2015

By Eric Buysman

Renewable Energy and GHG mitigation specialist

ericishier@gmail.com / eric.buysman@gmail.com

Acknowledgements

This study is indebted to two individuals who brought over the CO data loggers from the USA to Cambodia. Despite
being worried that it would set-off the x-ray and that customs would single them out at the airport, ;-), they did this
after having understood the relevance of this study for Cambodia’s burden of disease that can be attributed to
household air pollution. Therefore, thanks a lot Daneth Prum and Somaly Nim!

Thanks goes also out to Jason Steele, SNV Cambodia Renewable Energy Sector Leader, who borrowed a couple
of CO and PM2.5 data loggers and SUMS, to Berkeley Air for their input, review and calibration values, thanks
Charity Gayland and Dr. Kirk Smith and Ajay Pillarisetti!

To HIVOS, to make this study possible and to the five surveyors who cooperated in this study, it was a pleasure to
work with Sokhim Pich, Seth Soppunnaleap, Cheat Meardey, Soeum Hoeung and Khiev Touch.

    Climate Neutral Report: All emissions associated with this study, around 4 tCO2 due to airplane travel, electricity and
gasoline have been offset thought the HIVOS Klimaat Fonds by voluntary decision of the author

 By Eric Buysman                                                                                              Page 1 of 54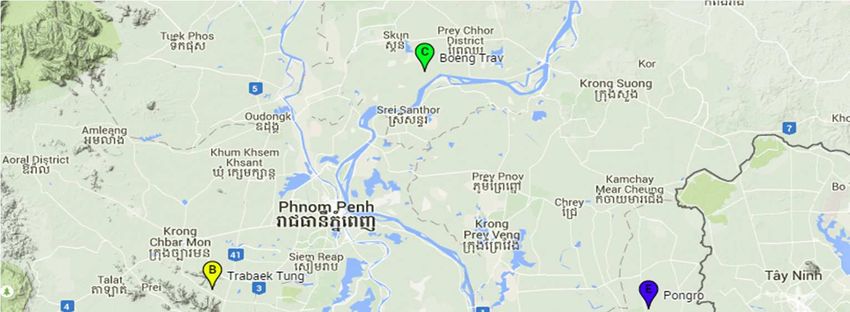
Household Air Quality Impact of biogas stoves versus wood-fired stoves in Rural Cambodia

                               Executive Summary
Household air pollution is a silent killer according to the WHO. It affects the health of 40% of the people worldwide
due to the reliance on solid fuels for cooking. The WHO estimates that it results in 4.3 million premature deaths
annually, of which 500,000 occur in children below 5 years of age. In Cambodia, where over 98% of the rural
households rely on solid biomass, mostly wood for cooking, a similar picture emerges, around 14,729 premature
deaths and 391,597 disability-adjusted life years (DALY). It is in Cambodia the second cause of DALY after dietary
risks and the third cause of premature death. This health and energy conundrum has a much greater impact on
human health compared to other common diseases in Cambodia, such as HIV/AIDs, malaria or even traffic
casualties.

Addressing HAP requires a paradigm shift from focussing on improved cookstove (ICS) with incremental thermal
efficiency gains towards advanced stoves with a much higher thermal efficiency or preferably towards clean fuels.
Biogas is considered a clean fuel by the WHO and has therefore the potential to address HAP. The relationship
between reduced HAP and health however has mostly focussed on improved cookstoves and few scientific studies
have looked at domestic biogas as an intervention. The few studies available that did so, all reported a positive
health impact, such a decreased prevalence of COPD, improved cardiovascular health and respiratory system.

The potential for domestic biogas is enormous in Cambodia with 1 million households that have sufficient livestock
to feed for the smallest NBP digester. Biogas could therefore help to address HAP in Cambodia to millions of rural
inhabitants. The National Biodigester Programme (NBP) of Cambodia, a partnership between SNV and the Ministry
of Agriculture Forestry and Fisheries, is implementing a market-based programme and has so far reached over
100,000 Cambodians with 23,000 biodigesters installed.

This study is set-up with the aim to quantify the health impact of NBP by measuring the reduction of hazardous
pollutants, CO and PM2.5 of households that use biogas and matching households in terms of family size, socio-
economic conditions and cooking conditions without a biodigester. The study took place in 5 randomly selected
villages in which 5 households of both groups the kitchen concentration, exposure to the pollutants by the main
cook and the ambient air was measured for 48 hours.

The study showed that biogas reduces PM2.5 levels, with a reduction of around 36% reduction in exposure and
88% reduction in kitchen concentrations. CO levels are also much lower, but in most cases, including the baseline
households lower than the 24-hour WHO guidelines. Short-term exposure to CO (≤ 1 hour) however remained too
high for almost a quarter of the baseline households.

The study was also able to provide evidence that biogas stoves results in decreased PM2.5 and CO emissions;
and that the high levels of HAP in biogas households may be attributable to the ambient air pollution. The study
therefore concludes that biogas is a part of the solution to address HAP, but that the current scale and the focus
on clean energy for cooking alone is not sufficient to bring the overall levels of PM2.5 near the WHO guidelines.
Tackling this requires a community based approach that focusses on clean energy, addresses the ubiquitous
problem with the inefficient burning of households and garden waste, the clearing of agricultural land by burning
the crop waste and artisanal rice and palm sugar production.

The HAPIT tool was used to convert the improvement in household air quality (HAQ) to aDALYs and averted
deaths. The cumulative benefits accrued by 2014 stand at 29.5 averted deaths and 1,442 aDALYs. With the
continued implementation of NBP, this is projected to increase to a total of 51 averted deaths and 2,519 aDALYs
in 2020.

NBP’s implementation costs expressed as costs per averted deaths and aDALYs can be compared to a statistical
value of life and the value of an aDALY. This comparison however is challenging as the value of life depends on
many aspects, such as age of the people involved, the country context and is basically an ethical discussion. Based
on the estimates available however, NBP, purely as a health intervention, is not cost-effective. However, given that
most pollution is not related to biogas, the benefits could be much greater when more households switch to biogas
or another clean fuel. In addition, the calculation ignores the range of other benefits that domestic biogas has and
brings. More study on the valuation of NBP’s benefits in a wider context is therefore necessary.

 By Eric Buysman                                                                                       Page 2 of 54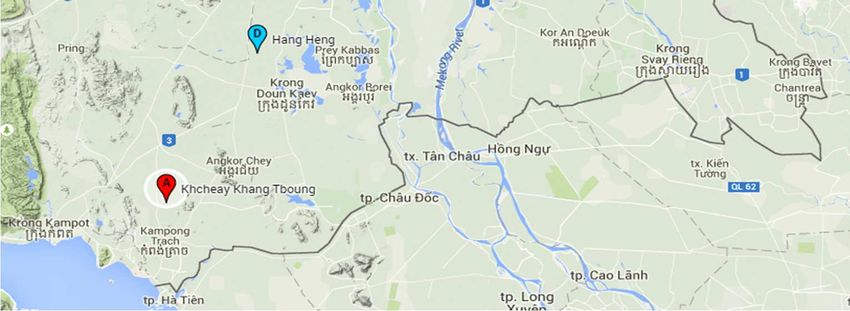
Household Air Quality Impact of biogas stoves versus wood-fired stoves in Rural Cambodia

                            List of Abbreviations
 µ                   =      Greek letter Mu, the SI unit for micro representing one millionth
 aDALY               =      Averted Disability-Adjusted Life Year
 ALRI                =      Acute Lower Respiratory Infection
 AQG                 =      Air Quality Guidelines
 BC                  =      Black Carbon
 CO                  =      Carbon Monoxide
 COPD                =      Chronic Obstructive Pulmonary Disease
 DALY                =      Disability-Adjusted Life Year
 EL-CO               =      Carbon monoxide monitor sold by Lascar
 EPA                 =      Environmental Protection Agency ( of the USA government)
 GACC                =      Global Alliance for Clean Cookstoves
 GBD                 =      Global Burden of Disease
 GDP                 =      Gross Domestic Product
 GHG                 =      Greenhouse gas
 GWP                 =      Global Warming Potential
 HAP                 =      Household Air Pollution
 HAPIT               =      Household Air Pollution Intervention Tool
 HAQ                 =      Household Air Quality
 hh                  =      Household
 HIVOS               =      Humanistic Development Organisation
 ICS                 =      Improved Cookstove
 IHD                 =      Ischemic Heart Disease
 LPG                 =      Liquefied Petroleum Gas
 mmHg                =      Pressure unit: Millimetre of mercury (133.32 Pascal)
 NBP                 =      National Biodigester Programme of Cambodia
 NBP                 =      National Biodigester Programme
 PM2.5               =      Particulate matter sized 2.5 µm or smaller
 SUMs                =      Stove Use Monitors
 SVOLY               =      Statistical Value of Life Year
 TSP                 =      Total Suspended Particles
 UCB-PATS            =      Particle and temperature monitor developed by the University of California Berkeley
 WHO                 =      World Health Organization

 By Eric Buysman                                                                                   Page 3 of 54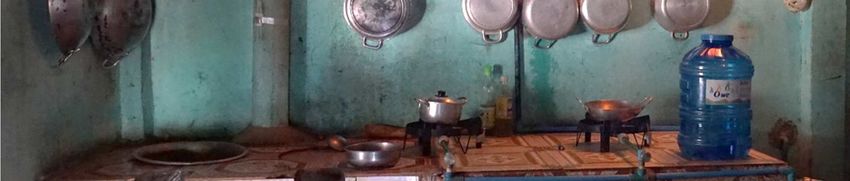
Household Air Quality Impact of biogas stoves versus wood-fired stoves in Rural Cambodia

                                                  Table of contents
1.         Introduction ................................................................................................................................................ 6
     1.1   The global health burden of Household Air Pollution ................................................................................. 6
     1.2   Cambodia’s health burden attributed to HAP ............................................................................................. 6
     1.3   Addressing HAP – Improved Cookstoves .................................................................................................. 6
     1.4   Addressing HAP – Domestic Biogas .......................................................................................................... 6
     1.5   Domestic Biogas in Cambodia ................................................................................................................... 7
     1.6   Study objectives and hypothesis ................................................................................................................ 7
     1.7   Reader ....................................................................................................................................................... 8
2.         Material and Methods................................................................................................................................. 9
     2.1   Study site and household selection ............................................................................................................ 9
     2.2   Sampling and sample size ....................................................................................................................... 10
     2.3   Characteristics of the pollutants measured .............................................................................................. 10
     2.4   Monitoring equipment and installation ..................................................................................................... 11
     2.5   Questionnaire........................................................................................................................................... 13
     2.6   Statistical analysis .................................................................................................................................... 13
3.         Results ..................................................................................................................................................... 14
     3.1   Household characteristics and kitchen ..................................................................................................... 14
     3.2   Stoves and fuels ...................................................................................................................................... 16
       3.2.1       Stoves in use ................................................................................................................................... 16
       3.2.2       Fuel use and fuel use reduction ...................................................................................................... 18
     3.3   Animal ownership ..................................................................................................................................... 18
     3.4   Other sources of air pollution origination from the households ................................................................ 18
       3.4.1       Cigarette smoking ........................................................................................................................... 18
       3.4.2       Burning waste.................................................................................................................................. 19
       3.4.3       Other sources of air pollution in the villages .................................................................................... 20
     3.5   Main cook’s perception of air pollution ..................................................................................................... 21
4.         Household Air Pollution ............................................................................................................................ 22
     4.1   Selected Air Quality Guidelines ................................................................................................................ 22
     4.2   Ambient air PM2.5 and CO concentration ................................................................................................ 22
       4.2.1       CO concentration in the ambient air ................................................................................................ 22
       4.2.2       PM 2.5 Concentration in the ambient air ......................................................................................... 23
     4.3   Kitchen concentration of PM2.5 and CO .................................................................................................. 23
       4.3.1       Kitchen concentration of CO ........................................................................................................... 23
       4.3.2       Kitchen PM2.5 concentration .......................................................................................................... 24
     4.4   Exposure to PM2.5 and CO ..................................................................................................................... 25
       4.4.1       Personal exposure to CO ................................................................................................................ 25
       4.4.2       Personal exposure to PM2.5 ........................................................................................................... 26
5.         Analysis of results .................................................................................................................................... 28
     5.1   PM2.5-CO relationship ............................................................................................................................. 28

 By Eric Buysman                                                                                                                                       Page 4 of 54
Household Air Quality Impact of biogas stoves versus wood-fired stoves in Rural Cambodia
5.1.1 Kitchen CO-PM2.5 relationship ....................................................................................................... 28
5.1.2 Personal CO-PM2.5 exposure relationship ..................................................................................... 29
5.2 Attribution of Ambient Air Pollution to HAP .............................................................................................. 29
5.2.1 Attribution of ambient CO to HAP .................................................................................................... 29
5.2.2 Attribution of ambient PM2.5 to HAP ............................................................................................... 30
6. Health impact ........................................................................................................................................... 32
6.1 Disability-Adjusted Life Year (DALY) ....................................................................................................... 32
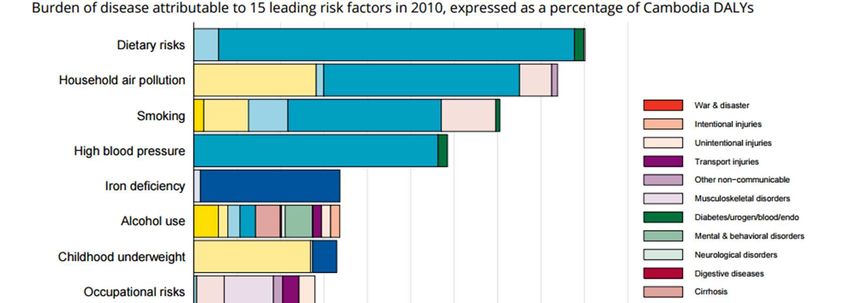
6.2 Burden of disease in Cambodia ............................................................................................................... 32
6.3 Averted HAP DALYs and Deaths ............................................................................................................. 34
6.3.1 Calculation HAPIT background ....................................................................................................... 35
6.3.2 NBP aDALYs accrued in 2006 to 2014 ........................................................................................... 37
6.3.3 Additional health benefits of the 2006-2014 population in 2020 ...................................................... 38
6.3.4 NBP 2006-2020 health impact attributable to HAP improvement .................................................... 40
6.4 Self-reported health improvements .......................................................................................................... 42
6.5 Valuing health outcomes .......................................................................................................................... 43
6.5.1 The statistical value of life and aDALY ............................................................................................ 43
6.5.2 Value of Life saved and DALY - NBP .............................................................................................. 43
7. Conclusion ............................................................................................................................................... 45
8. Recommendations ................................................................................................................................... 48
8.1 Recommendations to policy makers and researchers ............................................................................. 48
8.2 Recommendations to NBP ....................................................................................................................... 49
8.3 Follow-up Study ....................................................................................................................................... 49
9. References............................................................................................................................................... 50
10. Appendix .................................................................................................................................................. 52
Annex I: Share of benefits accrued of the digester population 2006- 2014 at the end of 2014 .......................... 52
Annex II: Share of benefits accrued in 2020 of the digester population at the end of 2014 ............................... 53
Annex III: Benefits accrued of the 2015-2020 digesters in 2020........................................................................ 53
By Eric Buysman Page 5 of 54
Household Air Quality Impact of biogas stoves versus wood-fired stoves in Rural Cambodia
1. Introduction
1.1 The global health burden of Household Air Pollution
Globally 3 billion people, or two-fifths of the world’s population, continue to rely on solid fuels to meet their thermal
energy needs (Neupane, et al., 2015). The reliance on these fuels, often burned in inefficient primitive stoves
situated in kitchens with poor ventilation, produces hazardous concentrations of several health-damaging
pollutions, including particles with a diameter up to 2.5 µm (PM2.5) and carbon monoxide (CO) (Neupane, et al.,
2015). There is a considerable health burden associated with this; annually an estimated 4.3 million deaths are
attributed to household air pollution (HAP) of which 1.69 million in South-East Asia alone (WHO, 2014). Most of
the premature deaths are related to cardiovascular complications such as ischemic heart disease (IHD) (26%) and
strokes (32%) and the remaining 40% due to adverse effects on the respiratory system; chronic obstructive
pulmonary disease (COPD) (22%), acute lower respiratory infections (ALRI) (12%) and lung cancer (6%) (WHO,
2014). Women, due to their household domestic roles and children which are often in their vicinity, are to a much
greater degree affected by HAP compared to other family members (Neupane, et al., 2015). It is estimated that
500,000 children’s deaths are attributed to HAP from ALRI. Furthermore, prenatal exposure to HAP is linked with
still-birth, impaired cognitive development and low birthweight (Martin, et al., 2013).
1.2 Cambodia’s health burden attributed to HAP
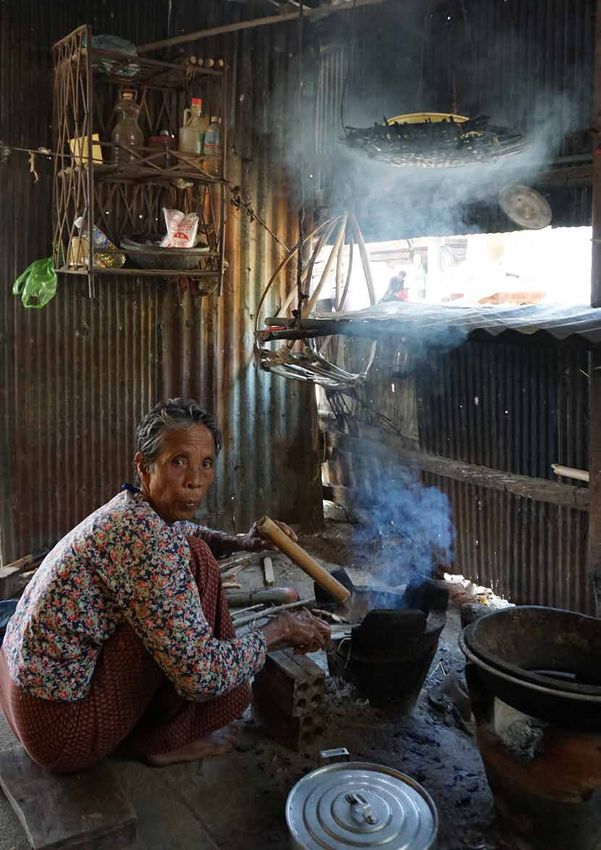
Women in Cambodia typically cook on simple inefficient ceramic stoves without a chimney in open kitchens. The
main fuel used is wood while richer households may also use charcoal or incidentally LPG. Over 98% of rural
Cambodian households rely on solid biomass for cooking (San, Ly, & Check, 2013) and consequently women and
children are exposed to high levels of pollutants that can cause a range of diseases (Pokhrel, et al., 2015) and
burns and scalds from tending the fire (Martin, et al., 2013). The cumulative effect of cooking on solid biomass also
leads to significant outdoor air pollution (GACC, 2015). HAP is second disease risk factor in Cambodia after dietary
risks and in 2013 stood at 391,597 Disability-Adjusted Life Years (DALYs) (IHME, 2015). Furthermore, the burden
of disease estimates provided by the Global Burden of Disease 2013 project and the WHO attributes 14,729
premature deaths including 856 children to HAP in Cambodia (IHME, 2015). The death toll is much higher
compared to malaria (1,043), outdoor air pollution (6,685), tuberculosis (3,758), HIV/AIDS (1,403) or traffic
casualties (3,657). Yet, little attention is given to this apparent health crisis
compared to the other risks and diseases world-wide, including Cambodia; HAP
is a silent killer.
1.3 Addressing HAP – Improved Cookstoves
There is limited evidence that switching to improved cookstoves (ICS) reduces
HAP (Neupane, et al., 2015). Martin et al (2013) suggests that an HAP
improvement of at least 50% is required to substantially improve health. For that
reason, Neupane (2015) concludes that clean fuels higher up the energy ladder,
such as LPG and biogas, are a prerequisite to meeting the WHO Air Quality
Guidelines (AQG). Moving towards fuels higher on the energy ladders or
biomass stoves that have significant cleaner combustion entails a paradigm
shift from current approaches that tend to focus on incremental thermal
efficiency improvement. An example of this is the recent focus on advanced
clean cooking stoves which have a significant higher thermal efficiency and less
emission of health damaging particles, such as the Advanced Clean Cooking
Solutions (ACCS) project in Cambodia (SNV, 2015). Preliminary results from
studies in other countries show that there is a positive health impact associated
with those stoves compared to open fire stoves (GACC, 2015).
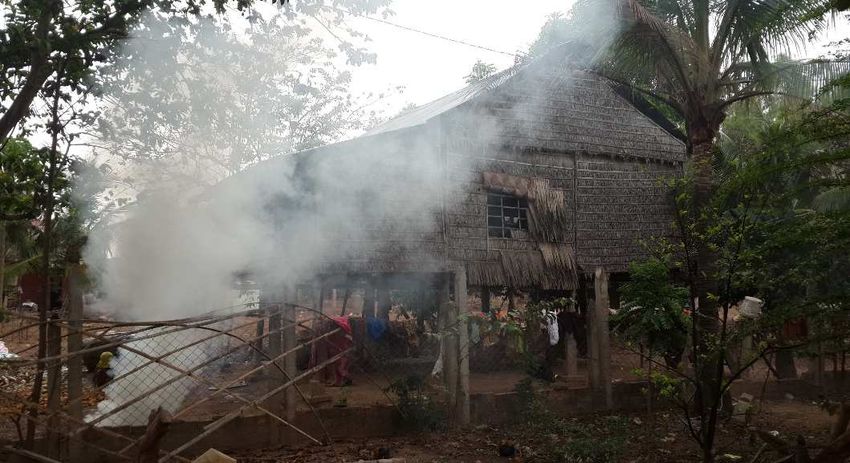
Figure 1: Typical rural kitchen.
1.4 Addressing HAP – Domestic Biogas1 The smoke and the soot on the
walls evidences HAP
Biogas is a clean and renewable fuel high up the energy ladder (WHO, 2014).
However, limited scientific documentation is available on the potential of biogas to address HAP while millions of
1
In this report domestic refers to household. Thus a synonym of domestic biogas is household biogas. This is in line with the
Cambodian draft biogas standard and the SNV/HIVOS definition.
By Eric Buysman Page 6 of 54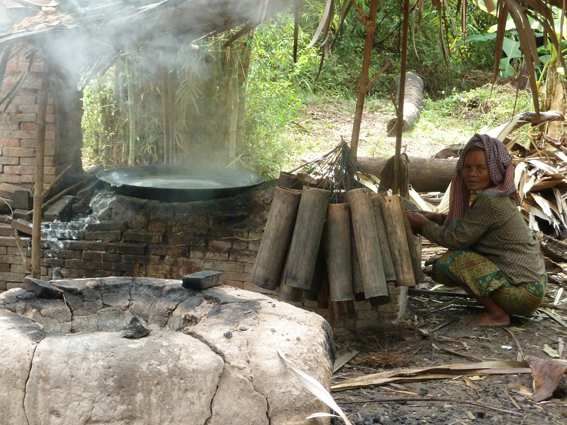
Household Air Quality Impact of biogas stoves versus wood-fired stoves in Rural Cambodia

rural inhabitants are using biogas worldwide; an estimated 46 million in China and India and another 600,000
through SNV/HIVOS initiated programs in Asia, Africa and Latin America (SNV, 2015).

One of the first scientific study on biogas and health was conducted in Kenya. That study confirmed the positive
health impact of biogas; household report improved respiratory health, better (but not significant) spirometry results
and improved children’s health amongst 31 age-matching non-smoking women with and without biogas (Dohoo,
Guernsey, Critchley, & Leeuwen, 2012). The long term impact of biogas however is not clear as households were
only using biogas ranging from 3 to 24 months in the study. Longitudinal effects were studied in China with a 9-
year cohort study amongst 996 participants aged 40 which looked into the impact on COPD and lung function of
households that had been offered a cooking intervention: ICS, biogas or improved ventilation. The study concluded
that using biogas and improved ventilation were associated with a reduced decline in forced expiratory volume and
that the effect and the reduction of COPD incidence was greater with longer duration of the intervention and the
greatest with the combination of biogas and improved ventilation (Zhou, et al., 2014). Another study looked at the
impact on cardiovascular health of cooks that previously used solid fuels for cooking in Nepal amongst 219 biogas
households and 300 that use firewood (Neupane, et al., 2015). The use of biogas was associated with a 9.8 mmHg
lower systolic blood pressure and a 68% reduced odd of reducing hypertension amongst women over 50 years
old. The latter was not found amongst women aged 30 to 50. In conclusion, the studies that have studied biogas,
have all found a positive health impact that was attributed to a reduction in HAP.

1.5 Domestic Biogas in Cambodia
In Cambodia, the National Biodigester Programme (NBP), a partnership between the Ministry of Agriculture,
Fisheries and Forestry (MAFF) and SNV, the Netherlands Development Organization, aims to establish a
permanent market-oriented and self-financed biogas sector (Buysman & Mol, 2013). Around 80% of the inhabitants
live in rural areas with agriculture as their primary livelihood. The dominant farming system is an integrated
livestock-rice cultivation system, where rice production relies on draught power and manure from cattle or buffaloes.
The sector is dominated by smallholders, families with typically a few chickens and pigs, while less poor families
usually have a pair of draught animals in addition (Buysman & Mol, 2013). As such, there is tremendous potential
for biogas which is estimated to be around 1 million domestic biodigesters (Kooijman, 2014). A biodigester relies
on anaerobic digestion of animal manure or other biomass in a closed underground fixed dome digester resulting
in biogas, a clean methane rich fuel that is mostly utilized for cooking purposes and the effluent, so-called bio-slurry
is a potent organic fertilizer. As of date, around 23,000 biodigesters have been constructed benefitting over 100,000
rural inhabitants. Given the enormous potential for domestic biogas in Cambodia, biogas could help to address the
health burden attributed to HAP for millions of rural inhabitants in Cambodia.

1.6 Study objectives and hypothesis
A cross-sectional study was set-up to determine the concentration of the main HAP pollutants: PM2.5 and CO, of
both kitchens and exposure to these pollutants in households with a biodigesters and matching households without
a biodigester. In addition, the ambient air PM2.5 and CO concentration was measured and related to the kitchen
and exposure levels. Although PM2.5 is thought to be the single best indicator to measure the health impact of
HAP (Pokhrel, et al., 2015), this relationship may not exist with biogas stoves and for that reason both pollutants
were measured.

The specific objectives of this study are:

    1.   Compare the kitchen and exposure PM2.5 and CO levels of randomly selected biogas and matching
         baseline households. (Chapter 4)

    2.   Determine the share of PM2.5 and CO that can be attributed to ambient air pollution (Chapter 5.1)

    3.   Assess whether or not a PM2.5-CO relationship exists for exposure and kitchen concentrations (Chapter
         5.2)

    4.   Assess the health implication of cooking on biogas by estimating the averted deaths and disability
         adjusted life years (DALYs) for NBP; (Chapter 6)

 By Eric Buysman                                                                                          Page 7 of 54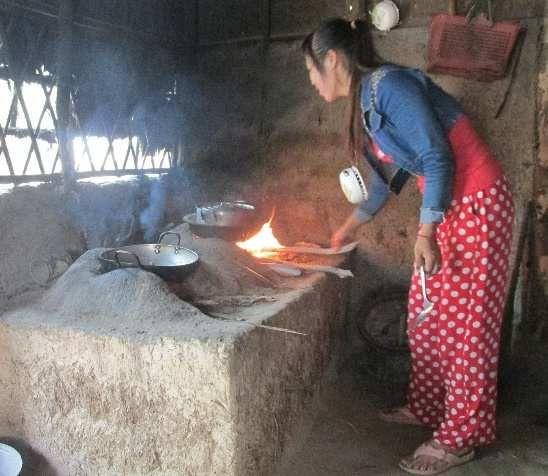
Household Air Quality Impact of biogas stoves versus wood-fired stoves in Rural Cambodia

1.7 Reader
Chapter 2 starts with the Materials and Methods in which the research methodology and tools used are described.

Chapter 3 will focus on the characteristics of the baseline and project households and will determine whether or
not the selected baseline households can be assumed to be matching and representative for the NBP target
population. Chapter 3 will also focus on other sources of air pollution, sources that could be compounding variables
that have to be taken into account when comparing HAP between the two study groups.

Chapter 4 will focus on the HAP results and compare them with the air quality guidelines (AQG).

Chapter 5 will assess the extent to which extent ambient air pollution contributes to HAP and will relate the CO
results with PM2.5.

Chapter 6 will determine, based on the result in chapter 4, the health impact of the intervention (biogas).

Chapter 7 is the conclusion and chapter 8 contain a number of recommendations to NBP but also to other actors
that focus on human health and the environment.

 By Eric Buysman                                                                                       Page 8 of 54
Household Air Quality Impact of biogas stoves versus wood-fired stoves in Rural Cambodia

2.       Material and Methods
The study protocol was reviewed by HIVOS and NBP before the commencement of this study. Prior to visiting the
households, first the village chief was informed on the purpose of this study and only after his/her permission the
households were visited. The household visit started with an explanation of the purpose of this study, the length
and the data loggers that will be installed and to be worn by the main cooker. In case the household would consent
and if the main cooker was available for at least 48 hours, then household would be selected for participation.
Households were allowed to withdraw from the research at any time. The consent procedure was verbal; no written
documentation exists of this. All village chiefs and households received as a token of appreciation a NBP designed
t-shirt.

2.1        Study site and household selection
The study took place in 5 randomly selected villages spread out over 5 provinces (Table 1 and Figure 3). The
villages are all located in the lowlands of South-East Cambodia. In all cases the villages were at least 10 kilometers
away from the main road and factories. Outdoor pollution therefore originates mostly from local activities, such as
from home-based artisanal production of rice wine by distillation, palm sugar production using wood fired stoves,
burning of household and garden waste, forest and agricultural land clearing and cooking on wood-fired stoves.
The biodigester population in each village is compared to the total population of households relatively small, with
the exception of Trabaek Tung village (Table 1).

Table 1: Study sites, village and biodigester population
 #    Province     District      Commune       Village       Village      Household     Biodigester     Share of hh
                                                            populatio     population    population         with a
                                                                n                                       biodigester
 A Kampot          Dang          Dang          Khcheay          812           187            15             8%
                   Tong          Tong          Khang
                                               Tboung
 B Kampong         Kong          Srang         Trabaek          655           125            26             21%
   Speu            Pisei                       Tung
 C Kampong         Kang          Sour          Boeng           2000           400            13             3%
   Cham            Meas          Kong          Trav
 D Takeo           Samraong      Boeng         Hang            1597           354            43             12%
                                 Tranh         Heng
                                 Khang
                                 Tboung
 E Svay            Rumduol       Thmea         Pongro           403           103            12             12%
   Rieng

                                                                Figure 3: Study locations

 By Eric Buysman                                                                                        Page 9 of 54
Household Air Quality Impact of biogas stoves versus wood-fired stoves in Rural Cambodia
2.2 Sampling and sample size
Villages were selected through a three-stage random cluster sampling. In the first stage 5 districts, out of a total
population of 123 districts in which NBP is active, were selected using a probability proportional to size (PPS)
random sampling method. Subsequently, in each district 1 village with at least 8 digesters was randomly selected.
Finally, up to 10 households were randomly selected in the previously selected chosen villages, of which, in
principle, the first 5 were surveyed and the remainder served as back-up.
Matching baseline households without biogas were selected using the sampling frame of the project households
and the ‘match’ was based on their similarity with project households on: animal population, socio-economic status,
type of stove used and family size. This study design ensures that the only difference between the baseline and
the project households is the biodigester and that the baseline households belong to the group which NBP identifies
as households that have the technical potential2 to install a biodigester. The total sample population consisted for
5 baseline and 5 project households in each village making a total sample of 50 households.
With this sampling method it was attempted to annul the selection bias and thereby safe-guarding
representativeness. In addition, it is aligned with Gold Standard’s TPDDTEC methodology with which NBP is
registered with their Voluntary Gold Standard project GS751.
2.3 Characteristics of the pollutants measured
PM2.5 stands for Particulate Matter (PM) with a size of 2.5 µm or smaller, or 2.5 x 10⁻⁶ meter, and is in general
referred to as ‘fine particles’. These particles are, in the case of cooking, emitted due to incomplete fuel combustion.
Due to their small size, inhaled particles can lodge deep in the lungs.
PM2.5 and Global warming: Black carbon is the solid fraction of PM2.5 that strongly absorbs light and converts
that energy to heat. Black carbon, also known as soot, is therefore a strong contributor to global warming, the
strongest after CO2 (Bond, et al., 2013). Roughly half of atmospheric BC comes from fossil fuel combustion and
the other half from biomass and biofuel burning. While BC is short-lived in the atmosphere (1-4 weeks), it is linked
to strong regional climate effects and a large share (~30%) of recently observed warming in the Arctic (UNEP,
2015). BC has a global warming potential (GWP) of 2,421 relative to CO2 over a 20 year period (IPCC, 2013),
much higher compared to, for example, methane’s GWP20 of 86 (IPCC, 2014).
CO: Carbon monoxide is a gas molecule composed of oxygen and carbon atoms with a diameter of 112.8 pm or
10-12 meter. CO has an impact on global warming with a GWP20 of 5.9, albeit much lower than BC (IPCC, 2013).
Carbon monoxide is colorless, odorless, and tasteless, but highly toxic. It combines with hemoglobin to produce
carboxyhemoglobin, which usurps the space in hemoglobin that normally carries oxygen, rendering it ineffective
for delivering oxygen to bodily tissues. At high levels, this could lead to carbon monoxide poisoning with the
following symptoms such as headache, nausea, vomiting, dizziness, fatigue, and a feeling of weakness and, in
some cases, coma and death.
Diffusion of PM2.5 and CO in the air is governed by different forces. In the case of CO by the Fick’s law of diffusion
where diffusion is directed by concentration gradients in the air, as anticipated by the second law of
thermodynamics which states that any system moves towards maximum entropy.
PM2.5 on the other hand is governed by the gravity induced drag and the movement in the air and will therefore
diffuse much slower. PM2.5 will eventually precipitate (settle) but can remain suspended in the air for weeks, while
CO will slowly diffuse and disappear in the background concentration of CO in the atmosphere.
2
Having enough manure to feed smallest biodigester of 4 m3
By Eric Buysman Page 10 of 54Household Air Quality Impact of biogas stoves versus wood-fired stoves in Rural Cambodia
Relative size of PM to a human hair CO molecule size and its triple atomic bond
Figure 4: PM2.5 particle and CO molecule size
2.4 Monitoring equipment and installation
Monitors
PM2.5: The UCB PATS (University of California, Berkeley – Particle and Temperature Monitoring System) was
used to measure PM2.5. The UCB-PATS is a low cost, passive, portable, data
logging optical particle monitor that has been validated in various studies3.
The UCB-PATS was used for the kitchen, ambient and the exposure
measurement. The UCB-PATS has a lower and upper detection limit of about
25 to ~25,000 µg/m3. The monitors were calibrated the values from an SNV-
Berkeley Air Household Air Pollution study that was conducted in June –
August 2015. They used a SKC Universal PCXR8 Air Sampling Pump to
calibrate the UCB- Monitors. The Air Sampling pump uses gravimetric
methods to analyse the air that is actively collected at the breathing zone using
a flexible tube (Figure 5)4.
Due to budget and equipment constraints the UCB-PATS was used for the
exposure measurement. Surveyors were instructed to hang the UCB-PATS
as close as possible to the head of the main cooker, and thus the breathing
zone (Figure 7 on the next page). However, due to the size and weight of the
UCB-PATS, the monitor was always hung at least 30 centimeters lower than
the breathing zone when used as a personal monitor. Surveyors were
instructed to keep a close eye on this and re-position the UCB-PATS
whenever required. Figure 5: SKC Air Sampling
Pump
CO: The Easylog Carbon Monoxide (EL-CO) data logger of Lascar5 was used
to measure CO on a 30 second interval. This logger has a range of 0 to 300 PPM with a resolution and accuracy
of 0.5 and ±6% respectively. The loggers were calibrated at the factory and valid for 3 years.
SUMs: The Stove Use Monitors (SUMs) in the form of Thermochron iButtons
1921G (Maxim Integrated Products) were used to record when a stove was
being used. These devices enclose a silicon temperature sensor, a memory,
a signal processing circuitry and a battery in a stainless steel can that has the
size and appearance of a coin cell battery. This model operates between −40
°C and 85 °C, and can record up to 2048 temperature and date-time readings
with ±1 °C accuracy. The SUMS were placed at location on the stove that is
does not exceed the temperature at which they fail (Household Air Quality Impact of biogas stoves versus wood-fired stoves in Rural Cambodia
Installation
In total 13 CO and PM2.5 loggers were used, in each household one for the kitchen- and one for the exposure
measurement. For every 5 households, 3 loggers were used to measure the concentration of the pollutants in the
ambient air in the village. These were placed at least 15 meter from a possible source of pollution and at a height
of 3 meter. Ideally, this number would be higher but this was not possible due to budget and equipment constraints.
There were around 15 SUMS available, where possible in each household one was used to measure the ambient
air temperature in the kitchen, one on the main stove and one on the secondary stove.
In the kitchen the EL-CO and the UCB-PATS where placed at 1.45-meter height, 1 meter from the edge of the main
stove and at least 1.5 meter from windows, doors or other openings (as per international norms). The main cooks
of the households were selected for the exposure measurement and instructed to hang the EL-CO and the UCB-
PATS at all time around their neck. At night however, they were allowed to place the instruments next to their bed.
The ambient sensors were placed at a location of east 15 meters away from any potential source of air pollution at
a height of approximately 3 meters.
Monitoring protocols
Monitors were generally deployed over 48 hours in both the baseline and the project households. This period
included 2-full days of cooking; entailing in most cases 6 cooking events (two times breakfast, lunch and dinner).
In practice the monitors collected data for at least 52 hours to ensure that they were running at time of installation
and removal, but the data were truncated to 48 hours for analysis.
UCB-PATS: Monitors recorded for at least 52 hours with a 1-minute interval and truncated to 48 hours for analysis.
Each UCB-PATS was zeroed by placing it inside a particle free plastic bag for 20 minutes to 2 hours before the
start of the monitoring and 20 minutes after the end of the monitoring. The UCB PATS light-scattering sensing
chamber of each UCB-PATS was cleaned every week with a wipe and cleansing alcohol. Batteries were replaced
when the voltage dropped below 7.5 volt.
EL-CO: Monitors recorded for at least 52 hours each time data logging at 1-minute intervals and truncated to 48
hours for analysis. The sensors did not require any cleaning except for the removal of dust or other small particles
that may attach itself to the sensor hood. The batteries of the EL-CO were removed when the software supplied by
the manufacturer (EasyLog) gave a low battery warning or when the sensor indicator light turned red during the
monitoring.
Ambient air
EL-CO UCB-PATS Exposure measurement Kitchen measurement
measurement
Figure 7: CO and PM2.5 data loggers and the measurement situations (main cook, kitchen and ambient)
SUMS: The SUMS logged the instantaneous temperature at 30 second intervals. It
turned out that baseline stoves are often too hot for the SUMS even when a piece of
wood is placed between the SUM and the stove as insulation. As a result, 5 SUMS
failed; all in the cases of baseline households with traditional stoves.
Figure 8: SUMS
By Eric Buysman Page 12 of 54Household Air Quality Impact of biogas stoves versus wood-fired stoves in Rural Cambodia 2.5 Questionnaire A household questionnaire was developed covering socio-economic conditions, stove and fuel use, health assessment and kitchen characteristics. The questionnaire also included a twice daily equipment check. In case something was wrong with the equipment, i.e. dislocation or a weak battery, the issues were solved directly onsite. This is also included ensuring that the main cooker was wearing the equipment during the whole day, from the moment awakening until the moment of going to the bed, with the exception of taking a bath. A separate questionnaire was developed for the ambient air sensors. This questionnaire consisted mainly of the twice daily data logger checks and a couple of questions targeted at the village chief on village population, biodigesters etc. 2.6 Statistical analysis Arithmetic mean, SD and confidence intervals were calculated of the most important data using Microsoft Excel 2015. Statistical significance was obtained using the T- test, ANOVA and the Pearson product-moment correlation coefficient (PMMC) in the case of regression analysis. By Eric Buysman Page 13 of 54
Household Air Quality Impact of biogas stoves versus wood-fired stoves in Rural Cambodia

3.       Results
In the following sections the descriptive statistics are presented of the sampled population. Where the
characteristics deviate substantially between the baseline and project, the project’s household characteristic is
colored red.

3.1 Household characteristics and kitchen
The next table details the basic characteristics of the selected households and in parenthesis the SD.

Table 2: Socio-demographics of the target groups (N=50)
 Variable                  Value                                     Baseline              Project
 Average age               Years                                     44 (15)               43 (14)
 Gender of main cook       Male                                      1                     2
                           Female                                    24                    23
 Household size            Members                                   4.48 (1.7)            4.64 (1.7)
 Education level           University                                1                     0
                           High school                               2                     6
                           Primary school                            15                    10
                           Little education                          4                     5
                           No formal education                       3                     4
 Literacy                  Fully literate                            36%                   40%
                           Can read, but difficulty with writing     28%                   32%
                           Illiterate                                36%                   28%
 Occupation                Farmer                                    96%                   92%
                           Construction worker                       12%                   4%
                           Other                                     4%                    28%

Both populations, baseline and project, are very similar on most items. Project households appear to be better
educated which could explain the higher literacy levels.

The next table shows who is cooking in the households, average age that the person started to cook, the time
spent on cooking, meals per day and the cooking position of both the baseline and project households.

Table 3: Basic cooking characteristics
 Variable                              Value                         Baseline              Project
 Main cook6                            Husband                       1                     2
                                       Wife                          19                    20
                                       Other                         5                     1
 Average age of starting to cook       Year                          14.8                  14.8
 Daily cooking time (self-reported)    Minutes                       123                   130
 Meals cooked per day                  Meal/day                      3                     3
 Cooking position                      Sitting                       44%                   8%
                                       Standing                      36%                   76%
                                       Both standing and sitting     20%                   4%

The baseline and project households are very similar in terms of the length of cooking and the meals per day and
the age when the main cook started to cook. However, there are significant differences in the cooking position.
Most baseline cooks take a sitting position while the vast majority of project cooks stand. This difference is the
result of NBP promoting the installation of kitchen counters for cooking. This may have some ramifications for the
interpretation of the results.

Baseline and project household’s kitchens characteristic are shown in the next table:

6 Husband and wife is defined in this report as middle-aged person of the second generation. Grandmother and

father belong to the third generation while the first consists of the children of the second generation.

By Eric Buysman                                                                                     Page 14 of 54
Household Air Quality Impact of biogas stoves versus wood-fired stoves in Rural Cambodia
Table 4: Kitchen characteristics of baseline and project households (N=25 of each group)
Variable Value Baseline Project
Kitchen type Enclosed 32% 76%
Semi-open 36% 12%
Closed with gaps 32% 12%
Kitchen location Separate building 44% 16%
Separate room attached to the house 44% 72%
Outside under a porch or under the house 12% 4%
Other 0% 8%
Number of walls 2 12% 4%
3 24% 8%
4 64% 84%
Wall type Closed 64% 84%
With gaps 36% 16%
Floor type Closed 80% 100%
With gaps 20% 0%
Volume m3 13.7 42
Ventilation coefficient7 m-1 (m2 /m3) 0.72 0.19
Few baseline household’s kitchens are closed and around a third of them have 3 walls or less. Their kitchens tend
to be outside the house. Kitchens of project households on the other hand, tend to be closed with four walls without
gaps and in a separate room attached to the house. Often when households invest in a biodigester they also
change their kitchen location or even built a new room for the kitchen. Perhaps this is because biogas stoves burn
smokeless and can even be used in houses with closed walls. More study is required on the actual reasons behind
this.
The ventilation coefficient is defined in this report as the sum of the open area divided by kitchen volume. This
coefficient indicates the ventilation area available for each cubic meter of kitchen volume. As witnessed from the
table above, the kitchens of the baseline households are much better ventilated. This is likely intentional due to the
smoke emissions from their wood stoves.
The kitchens of both groups are quite different. Baseline kitchens are often outside the house and are made from
different materials compared to their house and also compared to the project households whose kitchen is often
attached to the house or in the house, see the table below.
Table 5: Kitchen roofing and wall materials of the baseline and project households
Variable Baseline households Project households
Kitchen wall material Main material Secondary Main material Secondary
material material
Thatch 12 1 3 1
Corrugated iron 5 1 3 1
Wood 3 0 3 0
Bamboo 2 5 1 5
Bricks 2 0 15 0
Other 1 0 1 0
Kitchen roofing material Main material Secondary Main material Secondary
material material
Thatch 11 0 1 0
Corrugated iron 11 0 14 0
Fiber cement 1 2 5 0
Other 1 0 5 0
Baseline kitchens are most often made from thatch, corrugated iron and to a lesser degree from wood, bamboo or
bricks, while most project households’ kitchens are made of bricks. The roof of the baseline kitchen is either thatch
or corrugated iron; the kitchens of project households are also often made from corrugated iron but not from thatch.
7 Calculated as ∑ (ventilation area / kitchen volume)
By Eric Buysman Page 15 of 54Household Air Quality Impact of biogas stoves versus wood-fired stoves in Rural Cambodia
This indicates that the kitchens of project households are a structure that belongs to the house and is a much more
permanent structure.
In conclusion, baseline and project households have very different kitchens made with different materials, where
baseline kitchens are much better ventilated compared to project households’ kitchens (the ventilation coefficient
is 3.79 times larger).
3.2 Stoves and fuels
3.2.1 Stoves in use
Baseline households
The survey found that all baseline households use wood for cooking; the use of other fuels is negligible. The most
popular baseline stove is the Traditional Lao Stove (TLS) followed by the Thai Stove. A significant share of the
households, 24%, use a primitive stove with a very low thermal efficiency: the double clay homemade stove (16%
of the households) and a three stone stove (8% of the households).
Table 6: Frequency of stoves used by baseline households (survey method only)
Stove Percentage of Average Used daily Used weekly
households number per or less
owning this stove households
Traditional Lao Stove (TLS) 36% 0.56 89% 11%
Thai Stove 20% 0.32 100% 0%
Neang Kong Ray stove (NKS) 16% 0.16 75% 25%
Clay homemade 16% 0.32 100% 0%
Three stone stove 8% 0.08 50% 50%
New Lao Stove (NLS) 8% 0.08 100% 0%
Other 24% 0.24 86% 14%
Sum 1.48
Just one household owns a LPG stove. That stove is only used a few times per month and only during special
events and not for daily cooking. The next figure shows pictures of the best situation encountered, the most
common and the worst.
Figure 9: Left to right: Best situation encountered: Fixed stove with chimney, most common situation (TLS)
and worst situation encountered (Clay homemade stove)8
Project households
All project households use biogas for cooking and almost 50% uses wood in addition to this. All households own a
biogas stove, one household a biogas rice cooker and a range of baseline stoves of which the TLS and the three
stones stove are the most popular, see the next table:
8 Three stone stoves may even have a lower thermal efficiency, but these stoves are generally used less frequently
and in locations with more ventilation (in general outside the house)
By Eric Buysman Page 16 of 54Household Air Quality Impact of biogas stoves versus wood-fired stoves in Rural Cambodia
Table 7: Stoves owned and frequency of usage by the project households
Stove Percentage of Average Used for Once per A few
households with number of every day times per
this stove stoves/hh cooking week or
event less
Biogas stove 100% 1.84 96% 0% 0%
Biogas rice cooker 4% 0.04 100% 0% 0%
Traditional Lao stove (TLS) 16% 0.16 0% 33% 67%
Three stone stove 16% 0.16 0% 75% 25%
Other 40% 0.44 11% 44% 44%
Sum 2.6
Project households own more stoves compared to the baseline households. They continue to own and use around
0.7 baseline stoves.
Around 36% of the biogas households are using a
wood-fired stove on a daily basis and 48% are using a
wood-fired stove on a weekly basis. The most 12% 12% Rice cooking
common use is boiling water followed by animal feed Animal Feed
preparation, see the figure to the right.
35% Boiling water
41%
Cultural traditions, like making certain soups or special
Other
food during religious festivities often also impede
using biogas. This however is not a frequent
occurrence but when it happens it may result in using Figure 10: Purpose of using of the baseline stoves by
the baseline stove for multiple days. project households
The picture below shows a relatively common kitchen of a project household.
Figure 11: A project household’s kitchen with a baseline stove with chimney at the left and 2 biogas stoves
at the right
By Eric Buysman Page 17 of 54Household Air Quality Impact of biogas stoves versus wood-fired stoves in Rural Cambodia
3.2.2 Fuel use and fuel use reduction
The amount of fuel used for cooking, boiling water and animal feed preparation is shown in the next table.
Table 8: Wood fuel used by the baseline and project households
Use* Baseline household Project household Difference
kg/day kg/day kg/day
Cooking food and boiling water 3.34 (25) 0.34 (4) 3.00
Wood for animal feed preparation 0.23 (4) 0.46 (5) -0.23
Sum 3.57 0.80 2.77
* n in parenthesis
The primarily use of biogas is cooking and water boiling. Biogas will therefore displace around 3 kg of wood each
day. Assuming that the thermal efficiency of the baseline stove is 20% and of the biogas stove 55% and the net
calorific value of biogas 21.6 MJ/m3 then this amounts to the use of 0.79 m3 biogas per day. According to NBP,
one kilogram of manure generates 40 litres of gas, thus around 20 kilogram of manure enters the digester on
average each day.
Interestingly, fuel use for animal feed is higher in the project situation. This is the result of owning on average
almost two times more pigs, 0.56 versus 0.20 on average of the baseline households (see chapter 3.3)
3.3 Animal ownership
An important determinant whether or not the baseline households are matching with the project households is the
animal ownership, an important proxy for potential biogas production and fuel displacement potential. The next
table shows that this is indeed the case, the population of the most important animal, cow, is similar between the
groups as determined by a one-way Anova (F(24,25 = 0.948, p =0.55).
Table 9: Animals owned by the baseline and project households
Animal type Baseline households Project households
#/hh % owned #/hh % owned
Cow Adult 2.84 2.88
Youngster 1.24 1.00
Total 4.08 96% 3.88 92%
Buffalo Adult 0.32 0.24
Youngster 0.12 0.20
Total 0.44 8% 0.44 12%
Pig Adult 0.12 0.28
Youngster 0.08 0.56
Total 0.20 12% 0.56 20%
3.4 Other sources of air pollution origination from the households
There are various sources of air pollution other than cooking observed. The main ones are cigarette smoking and
burning waste.
3.4.1 Cigarette smoking
Around a third of the households have one or more members that smoke cigarettes. In almost all cases it is a male
member; either the husband or the grandfather. Smoking mostly occurs outside. Smokers smoke on average 13
to 18 cigarettes (baseline and project households respectively) per day, see the next table.
By Eric Buysman Page 18 of 54Household Air Quality Impact of biogas stoves versus wood-fired stoves in Rural Cambodia
Table 10: Number and gender of smokers, cigarettes smoked and location of smoking (n=25 in each group)
Variable Value Baseline Project
Total smokers Yes 9 10
Never smoked 16 15
Ex-smoker 5 3
Smokers Smokers in smoking hh 1.13 1.25
Average in population 0.36 0.40
Share of family Wife 0% 0%
members that smoke Husband 20% 16%
Grandfather 12% 16%
Other 4% 8%
Gender Male 89% 100%
Female* 11% 0%
Where do you smoke? Kitchen 0% 0%
In the house 40% 29%
Outside/other 60% 71%
Cigarettes per day AVG smokers 12.78 17.4
AVG in population/hh 4.60 6.96
* Only one elderly female smoked in the survey population
The number of smokers is similar amongst the study groups. Project households however, smoke around 36%
more cigarettes. Since the smokers most often smoke outside the house, it is not expected that smoking will affect
the household air quality significantly.
3.4.2 Burning waste
There are no waste collection and disposal facilities in rural Cambodia. Households therefore, burn all their
households and garden waste on a regular interval; around 1.4 times per week. Project households burn waste in
77% of the cases 1.94 times per week and in 23% of the cases 2.2 times per months. 65% of the baseline
households do this 2.27 times per week and 35% does this 1.16 times per month, see the table below.
Table 11: Percentage frequency of households burning their waste
Variable Value Baseline Project
Burning waste Total (%) 88% 88%
Weekly or more frequent (%)* 65% (2.27) 77% (1.94)
Monthly or less frequent* 35% (1.16) 23% (2.20)
Population average Times per week 1.39 1.36
* Frequencies are depicted in brackets
In the sample population this turns out to be around 1.36 to 1.39 times per week on average. This source of pollution
should not be underestimated. Households often burn their waste for a couple of hours each time and since it burns
in the open with materials that are not always dry and may include plastics, the amount of smoke generated is
considerable as the picture below exemplifies.
By Eric Buysman Page 19 of 54Household Air Quality Impact of biogas stoves versus wood-fired stoves in Rural Cambodia
Figure 12: A relatively common example the smoke from burning household and garden waste
3.4.3 Other sources of air pollution in the villages
A number of other sources are not accounted for in the questionnaire or the measurement campaign. The main
ones are:
• Clearing of agricultural land
Rice stalks and other remaining agricultural residues from the previous harvest are generally removed by
setting it on fire. Depending on the size of the land these fires can run for hours and generate a substantial
amount of smoke and therewith high levels of PM2.5 and CO emission.
• Clearing of forested areas
The only remaining forest in low land Cambodia are on the hills. These hills are also increasingly cleared
by burning the bushes and other vegetation that remain behind when the trees are logged.
• Road dust
The particulate size of road dust is in the order of 70 µg or larger. These coarse particles can aggravate
heart or lung-related conditions such as asthma. Most roads in the village are unpaved while with the
rapid economic development the amount of traffic is rapidly increasing. In the dry season this results in
local dust clouds around the houses which affects health.
• Home-based rice wine production and palm sugar production
Rice wine is produced through distillation of fermented rice and water and is a popular activity in rural
areas. Rice wine stoves often run for the whole day and many days in the week. They are often built
without a proper chimney and most of the times fuelled with rice husk. Local palm sugar production is
made on large specifically designed stoves in a wok shaped pan of a diameter of approximately 80 cm.
The palm sugar stoves are often fuelled with wood and most of the times do not have a chimney. Also
this process takes a long time and these stoves are frequently used during the day during the palm fruit
season.
Both activities have received very little attention on how to improve the fuel efficiency and on how to
reduce the associated air pollution caused by these stoves
By Eric Buysman Page 20 of 54You can also read