U.K. PRODUCT PROFILE 2019 - Access to Nutrition Index
←
→
Page content transcription
If your browser does not render page correctly, please read the page content below

U.K. PRODUCT PROFILE 2019

U.K. Product Profile
An assessment of the nutritional quality of approximately 50% of
packaged foods and beverages sold in the U.K. in 2016 and their
suitability to be marketed to children.

Acknowledgements
FUNDERS

                                 We are grateful for the generous support of the Bill & Melinda Gates
                                 Foundation, UK aid and the Dutch Ministry of Foreign Affairs (DGIS), which
                                 together funded the 2018 Global Access to Nutrition Index, for which the
                                 original nine-country Product Profile was conducted.

                                 This report, which presents the U.K. data from that wider nine-country
                                 study, was funded through a grant from urban health foundation Guy’s and
                                 St Thomas’ Charity awarded to ShareAction.

PARTNERS

                                 The George Institute for Global Health (TGI) in Sydney, Australia, conducted
                                 the Product Profile research. The TGI team comprised Dr. Elizabeth Dunford,
                                 Dr. Bruce Neal, Thout Sudhir Raj and Fraser Taylor. They were advised by
                                 ATNI Expert Group member Professor Mike Rayner of the University of Oxford.

                                 ATNI partnered with ShareAction in the production of this report, for its
                                 Healthy Markets campaign.

REVIEW AND DESIGN
                                 We would also like to thank the following experts who reviewed the draft
                                 report and contributed to improving it: Jessica Attard, Katy Cooper, Katie
                                 Gordon, Ellie Chapman, Ignacio Vasquez, Tim Lobstein and Will Nicholson.

                                 Design by Ontwerpwerk

                                 September 2019

                      ACCESS TO NUTRITION INITIATIVE U.K. PRODUCT PROFILE
Table of contents
Foreword                                                                  3
Executive summary                                                        4
Context                                                                  6
The role of ATNI                                                         17
U.K. Product Profile                                                     18
Overall results                                                          24
Limitations                                                              34
Implications and recommendations                                         36
Conclusions                                                              39
Annex1                                                                   40
Endnotes                                                                 42

                   ACCESS TO NUTRITION INITIATIVE U.K. PRODUCT PROFILE        1
2 ACCESS TO NUTRITION INITIATIVE U.K. PRODUCT PROFILE

Foreword
It is with great pleasure that I introduce our first U.K. Product Profile. This ground-breaking
report provides – for the first time – extensive, comparable data on the nutrition quality of the
portfolios of 18 major food companies. In 2016 they accounted for nearly half of all sales of
packaged food and beverages in the U.K.

The U.K., like many other countries, is facing a health crisis driven in large part by the nation’s
poor diet. A concerted effort is urgently needed to transform the country’s food system so
that everyone is able to afford a healthy diet. Healthier people and communities are key to
vibrant and productive societies.

The Access to Nutrition Initiative (ATNI) aims to encourage the world’s largest food and
beverage companies to do everything they can to address all forms of malnutrition. This
encompasses tackling overweight and obesity as well as stunting, wasting and micronutrient
deficiencies that persist in many of the world’s poorer countries.

We strive to encourage ‘healthy competition’ among food and beverage companies by
tapping into their competitive nature. We have proven in the six years since ATNI was
established as an independent not-for-profit organisation that our model of benchmarking the
world’s largest food and beverage manufacturers’ efforts to address all forms of malnutrition
drives and accelerates meaningful change. We have published three Global Access to
Nutrition Indexes since 2013, and Spotlight Indexes for India and the U.S. These single-
country Indexes, adapted to specific national contexts, are intended to track the contribution
over time of major food and beverage companies to addressing diet-related health challenges
in individual countries. Our Indexes are being used by governments, NGOs and other
stakeholders in those markets to advance their work to improve health through better diets.

Each Index includes a Product Profile, a tool developed by ATNI in partnership with leading
academics and experts. It provides unique, comprehensive, comparable and objective
information about the nutritional quality of packaged products made by the companies in our
Indexes. The 2016 data presented here for the U.K. were included within a nine-country
study carried out in 2017, the results of which were published in the 2018 Global Access to
Nutrition Index report. They provided a picture of the healthiness of global food and beverage
manufacturers’ product ranges in Australia, China, India, Hong Kong, Mexico, New Zealand,
the U.S., South Africa and the U.K.

I would like to thank ShareAction, through a grant from Guy’s and St Thomas’ Charity, for
funding the publication of this report. I hope it will be of value to a wide range of stakeholders,
from investors to advocacy organisations, policymakers to academics. Most crucially, with
nearly two-thirds of U.K. adults being overweight or obese, as well as a third of children and
young people, it is imperative that the food and beverage manufacturers responsible for a
large proportion of what Britons eat accelerate their efforts to improve the nutritional quality of
their products. Moreover, they must do much more to make their healthy products as widely
available and affordable as possible. In so doing, they will help to reduce the high and
growing levels of diet-related diseases that are costing individuals and the country dearly.

This report is also intended to lay the groundwork for further work with ShareAction in
support of its Healthy Markets campaign by developing new tools to monitor the progress
that food companies are making to addressing childhood obesity in the U.K. I look forward
to that collaboration.

                 Inge Kauer
                 Executive Director
                 Access to Nutrition Foundation

                     ACCESS TO NUTRITION INITIATIVE U.K. PRODUCT PROFILE                              3
Executive summary

    Executive summary
               The U.K.'s diet-driven health crisis

               The U.K. is facing a health crisis driven in large part by the nation’s poor diet. Those that eat
               poor diets – high in fat, salt and sugar and/or low in fruit, vegetables and wholegrains – are
               at risk of developing a wide range of serious illnesses as well as dying early. Poor diets
               accounted for 17% of all deaths in the U.K. in 2017. They also accounted for a huge
               proportion of ill health. Cutting the high and climbing levels of overweight and obesity in the
               U.K. is a public health priority, given that the U.K. already has the highest level of adult
               obesity in Europe. 61% of adults were overweight or obese in England in 2016; these
               figures are slightly higher in Scotland and Northern Ireland. However, up to 40% of those
               with a normal body-mass index (BMI) have metabolic abnormalities typically associated with
               obesity, illustrating the importance of improving diets for everyone. Childhood obesity is also
               accorded a high priority because it is a ticking time-bomb: children who are obese are five
               times more likely to be obese adults. Currently, a third of children and young people in the
               U.K. are estimated to be overweight or obese and these levels are predicted to increase. The
               related annual costs by 2050 are expected to be £9.7 billion for the NHS and nearly £50
               billion for society as a whole. The economic case for action therefore seems to be irrefutable.

               This is why concerted effort is urgently needed to transform the country’s food system so
               that everyone, including those on low incomes, is able to eat a healthy diet. Food companies
               can and must play an active part by improving the nutritional quality of the products they sell
               and by putting much greater emphasis on increasing the consumption of healthy foods and
               beverages. In fact, those that do not are at risk losing out to competitors that respond more
               positively and quickly to the emerging consumer trend of healthy eating.

               The role of the Access to Nutrition Initiative

               ATNI intends to play its part in tackling the U.K.'s diet-driven health crisis by rating the
               contribution made by major U.K. food companies to addressing it and tracking their
               improvements over time. ATNI aims to complement and inform the work of Public Health
               England, ShareAction, major institutional investors and others. In the first instance, ATNI will
               work with ShareAction, under the auspices of its newly launched Healthy Markets campaign,
               to develop an index for U.K. retailers, modelled on its manufacturer-focused indexes
               published to date. In time, ATNI hopes to develop a suite of Access to Nutrition Indexes for
               the U.K. that cover all segments of the food and beverage value chain, i.e. manufacturers,
               retailers, café and restaurant chains, and food service companies.

               Scope of the U.K. Product Profile

                                  This U.K. Product Profile
                                  analyses the healthiness of

        3,000                                                      50%
                                  more than 3,000 food and
                                  beverage products sold by                                 These products accounted
                                  18 of the world’s largest food                            for just under 50% of the
                                  and beverage manufacturers                                sales of packaged foods and
                                  operating in the U.K.                                     beverages in 2016.

               The U.K. data presented in this report is extracted from a wider nine-country Product Profile
               undertaken for the 2018 Global Access to Nutrition Index. Two different nutrient profiling
               systems were used to assess the healthiness of products in that study: the Health Star
               Rating (HSR) system and the WHO Europe model, explained in detail in the report.

4                                   ACCESS TO NUTRITION INITIATIVE U.K. PRODUCT PROFILE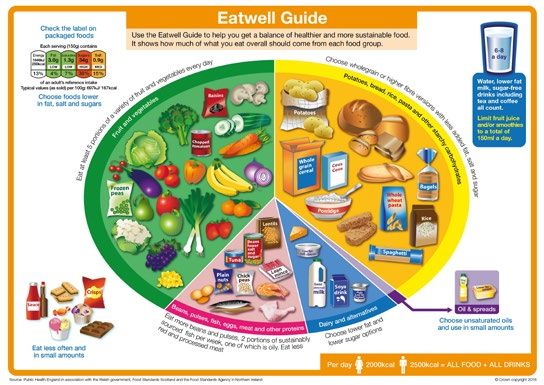
Executive summary

           Key findings

                              of the products analysed
                              using the Health Star Rating
                              system failed to meet the
                              healthy standard, i.e. a
                              of the products
                              Health            analysed
                                      Star Rating   (HSR) of
                              using
                              3.5 outthe
                                       of Health
                                          5.*    Star Rating             Average food HSR = 2.2
                              system failed to meet the
                              healthy
* Corresponding to 78% of these        standard,
                                 companies’   2016i.e. a
                                                   sales
                              Health Star Rating (HSR) of
                              of the products were                       Average food HSR = 2.2
                              3.5 out of 5.*
                              unsuitable to market to
                              children based on analysis
                              using the WHO Euro nutrient
                              of the products
                              profile model.** were                      Average beverage HSR = 2.8
                              unsuitable to market to
                              children based on analysis
                              using the WHO Euro nutrient
                              profile model.**                           Average beverage HSR = 2.8
** Corresponding to 89% of these companies’ 2016 sales

           In total, products in 18 different food and beverage categories were analysed. The nutritional
           quality of products in many categories varied substantially. The companies whose products
           have the lowest HSRs in a category must focus on improving the nutritional quality of those
           products or risk losing market share or sales to those with a healthier offering. The
           manufacturers of beverages covered by the Soft Drinks Industry Levy also face financial
           penalties if they fail to reduce the sugar content sufficiently.

           Recommendations

           We recommend that food and beverage manufacturers:
           • Reformulate their products to improve their nutritional quality, i.e. make them healthier
           • Improve the category and product mix, so that consumers have more healthy options
           • Adopt a stringent nutrient profiling system similar to the HSR system
           • Stop marketing products that are not healthy to children
           • Increase the proportion of marketing dedicated to healthier products
           • Take a structured approach to addressing nutrition, by adopting SMART targets for key
             nutrients
           • Improve their accountability through better annual reporting

           We recommend that institutional investors:
           • Carefully assess the risks and opportunities related to nutrition facing this sector
           • Factor nutrition issues into their valuation models for food and beverage manufacturers,
             and into stock selection
           • Engage actively with food and beverage manufacturers to press them to urgently improve
             the nutritional quality of their products.

           We recommend that U.K. policymakers:
           • Adopt policy measures that create a food policy environment which drives improvement
             in the overall nutritional quality of packaged foods and beverages in the U.K. market
           • Consider what can be done to ensure that healthier products are widely accessible and
             affordable to all.

                                   ACCESS TO NUTRITION INITIATIVE U.K. PRODUCT PROFILE                       5
Context
Context
The scale of the global nutrition challenge
By 2013, poor diets generated more disease worldwide than physical inactivity, alcohol and
smoking combined.1 By 2017, dietary factors were responsible for 11 million deaths.2 Figure
1 illustrates for 2017 the levels of illness (measured as DALYs or disability adjusted life
years) globally attributable to three major diet-related diseases (cardiovascular diseases,
type 2 diabetes and cancers).3
Being overweight or obese increases people's risk of suffering from a wide range of illnesses
including, but not limited to, type 2 diabetes, hypertension, abnormal lipid levels, non-alcoholic
fatty liver disease, many cancers and cardiovascular disease.4,5 In 2016, nearly two billion
people globally were overweight or obese, including 400 million children and young people.6
However, it is also critical to understand that 40% of those with a normal BMI have metabolic
abnormalities typically associated with obesity.7 For example, those that consume high levels
of sodium may not be overweight but are at higher risk of having a stroke and developing
coronary heart disease as a result.8
Good diets are therefore critical to everyone’s health, which is why reducing diet-related
diseases has become a global public health priority, as captured by Sustainable Development
Goal 3 and in the World Health Organization's Global Targets for 2025.9,10
Figure 1 Disability adjusted life years (DALYs) attributable to dietary deficiencies, 2017
Diet low in whole grain
Diet high in sodium
Diet low in fruits
Diet low in nuts and seeds
Diet low in vegetables
Diet low in seafood omega-3 fatty acids
Diet low in fibre
Diet low in polyunsaturated fatty acids
Diet low in legumes
Diet high in trans fatty acids
Diet high in sugar-sweetened beverages
Diet low in calcium
Diet high in processed meat
Diet low in milk
Diet high in red meat
0 200 400 600 800 1000 1200
DALYs
Source: ‘Health effects of dietary risks in 195 countries, 1990–2017: a systematic analysis for the Global Burden of
Disease Study’ (2017), The Lancet 393 (10184): 1911–2008.11
6 ACCESS TO NUTRITION INITIATIVE U.K. PRODUCT PROFILEContext
The U.K. picture
Poor diets accounted for 17% of all deaths in the U.K. in 2017. They also accounted for a
huge proportion of ill health. The risk factors that drive the most death and disability
combined in the U.K., and how they have changed between 2007 and 2017, are shown in
Figure 2. While tobacco use causes the most death and disability, the next three highest risk
factors in the top ten are all diet related.12
Figure 2 Ranking of the top ten risk factors for death and disability in the U.K., 2017, and
the percentage change since 2007
1 Tobacco -9.2%
2 Dietary risks -6.7%
3 High body-mass index 7.6%
4 High blood pressure -12.6%
5 High fasting plasma glucose 21.5%
6 Alcohol use 2.0%
7 High LDL cholesterol -15.8%
8 Occupational risks 4.7%
9 Air pollution -8.4%
10 Drug use 13.0%
Diet-related risks
Source: Global Burden of Disease tool, The Institute for Health Metrics and Evaluation (IHME)
In terms of the numbers or proportions of people that suffer diet-related conditions:
• 12.5 million people in England were estimated to have high blood pressure with a further
5.5. million undiagnosed.13
• Around half of adults in the U.K. are living with raised cholesterol levels (above 5mmol/L)14
• 61% of adults were overweight or obese in England in 2016; the comparable figures for
Scotland are 65% and for Northern Ireland, 63%.15
• A third of children and young people in the U.K. are estimated to be overweight or obese;
these figures are predicted to increase.16,17
• 3.7 million people had been diagnosed with diabetes in the U.K. in 2017 and 90% of
those cases were type 2 diabetes. In addition, 12.3 million people are at increased risk of
developing type 2 diabetes.18
• More than 1 in 20 cancer cases in the U.K. are caused by excess weight. Put another
way, around 22,800 cases of cancer could be prevented every year if people in the U.K.
maintained a healthy weight.19
• A quarter of children starting primary school have tooth decay, and it is the cause of the
most common hospital procedure in primary school children.20
• 84% of adults in England have dental fillings, typically for more than seven teeth.21
Given that the U.K. already has the highest level of adult obesity in Europe, the cumulative
effect over time of high proportions of overweight and obese young people becoming obese
adults is of particular concern.22
ACCESS TO NUTRITION INITIATIVE U.K. PRODUCT PROFILE 7Context
The U.K. diet
The U.K. Government’s recommended healthy diet is set out in the Eatwell Guide, as shown
in Figure 3.
Figure 3 The U.K. Eatwell Guide23
However, as is the case in many countries, the typical U.K. diet is made up of too many foods
high in free sugars and saturated fats, and does not contain enough fruit, vegetables or fibre.
Figure 4 shows the stark difference between the current diet and that encapsulated by the
Eatwell Guide.
Figure 4 Comparison between average current diet and the recommendations of the
Eatwell Guide
3.8%
Eatwell Guide 36.7% 7.9% 12.4% 39.3%
Current diet 27.2% 13.8% 9.9% 20.3% 28. 8%
0% 10% 20% 30% 40% 50% 60% 70% 80% 90% 100%
Potatoes, bread, rice, pasta and other starchy carbohydrates
Dairy and alternatives
Foods high in fat and sugar
Fruit and vegetables
Source: Scarborough P, Kaur A, Cobiac L, et al. ‘Eatwell Guide: modelling the dietary and cost implications of
incorporating new sugar and fibre guidelines’. BMJ Open 2016;6:e013182. doi: 10.1136/bmjopen-2016-013182.24
8 ACCESS TO NUTRITION INITIATIVE U.K. PRODUCT PROFILEContext
The inadequacy of today’s national diet can also be seen by looking at the wide discrepancy
between the current consumption of key nutrients and the official U.K. Dietary Reference
Values (DRVs). The most recent DRVs for energy and key macronutrients, published in 2016,
are shown in Table 125 while actual consumption of each of these nutrients is shown in Box 1.26
Table 1 U.K. Dietary Reference Values
Macronutrient Dietary Reference Value
Energy Between the ages of 19–64, 2,500 kcal/day for men,
and 2,000 kcal/day for women, on average.
Protein Between the ages of 19–64, 55.5g/day for men and 45g/day
for women, or around 9% of food energy intake.
Total fat No more than 35% of food energy for those aged 5 years
and over.
Saturated fatty acids No more than 11% of food energy for those aged 5 years
and over.
Trans fatty acids No more than 2% of food energy.27
Free sugars Not to exceed 5% of total dietary energy for age groups from
2 years upwards.
Salt No more than 6g per day for children over 11 and adults.
Fibre Average intake from 16 years of age: 30g per day.
Average child intake of dietary fibre: 15g/day for children aged
2 to 5 years, 20g/day for children aged 5 to 11 years, 25g/day
for children aged 11 to 16 years.
Note: For all macronutrients, additional guidance is available for infants, children and adults aged 65 and over.
Box 1: U.K. diets fall a long way short of recommended daily intakes
Excess calorie intake: On average, overweight and obese U.K. adults consume an
excess of 320 calories per day. Obese boys and girls consume excess daily calorie
intake of 140–500 and 160–290 calories per day respectively.28
Excess free sugars intake: Free sugars are a major contributor to this excess calorie
intake: 14% of the daily calorie intake of children is from free sugars – nearly three times
the maximum amount of 5% recommended by the U.K.’s Scientific Advisory Committee
on Nutrition (SACN). Free sugar intake for adults is 11%.
Excess salt intake: In 2014, the average salt consumption for adults was 8.0g per day
– a third higher than the recommended level (though intake has fallen from 8.5g in 2011
and 8.8g in 2005/2006). This figure masks significant differences between men and
women, which were 9.1g/day for men and 6.8g/day for women. Both figures remain
above the recommended level for adults and children over 11 of no more than 6g per
day (and less for younger children, depending on their age).29
ACCESS TO NUTRITION INITIATIVE U.K. PRODUCT PROFILE 9Context
Excess saturated fat intake: While the maximum recommended intake of saturated fat
is 11% of total calories, the average intake for adults is 11.9% and for children is 12.4%.
Inadequate fruit and vegetable intake: The recommended level of intake is 5 portions
per day. The percentage of adults achieving that level is 31% and the percentage of
children, 8%. The lowest levels are found among lower-income households.
Inadequate fibre intake: While the recommended level for adults is 30g per day, the
actual intake among this group is 19g per day. For children aged 11 to 16, the
recommended intake is 25g per day increasing to about 30g per day for adolescents
aged 16 to 18 years. For these groups combined, the intake is 15.3g per day.
All statistics are derived from Public Health England, and are for England only, 2014/15–2015/16, unless
otherwise stated. Figures cited are the average for adults aged 19–64 and for children aged 11–18.
https://www.gov.uk/government/statistics/ndns-results-from-years-7-and-8-combined.
The economic impacts of obesity and overweight in the U.K.
In 2014–15, the NHS spent £6.1 billion treating overweight, obesity and related conditions.
To put that figure in perspective, more is spent on treating obesity and diabetes than on the
police, fire service and judicial system combined.30 Beyond the direct costs, it has been
estimated that the total costs likely to be imposed on society and businesses due to lower
productivity and consequent reduced economic growth due to obesity alone (not including
all diet-related conditions) would be £27 billion per year by 2015.31 Morgan Stanley
estimated that the U.K.’s average annual GDP growth would be 2%, 0.6% lower than the
OECD long-term forecast of 2.6% between 2015 and 2035, due to the impact of sugar
consumption. Similarly, the bank predicted that average annual productivity growth out to
2035 would be 0.5% lower than the OECD forecast of 2.1%, at 1.6%.32 The cumulative
losses over 20 years are therefore substantial.33
The predicted increase in overweight and obesity cases has led to suggestions that the
wider annual costs to the NHS and society as a whole could almost double to £9.7 billion
and £49.9 billion respectively by 2050.34`
The case for action therefore seems to be irrefutable to avoid huge increases in costs for the
NHS, massive impacts on individuals over their life course, and further impairment of U.K.
productivity (already among the lowest in the G7 nations)35 and of the country’s economic
growth.
Drivers of poor diets and ill health
While it is well established that people become overweight or obese because they consume
more calories than they expend, the reasons are complex and multi-faceted, and therefore
defy simple solutions.
The WHO cites the major contributory factors as being a growing trend in consumption
globally of energy-dense foods, larger portion sizes and more sedentary lifestyles.36 Critically,
however, in the past 30 years, although obesity has rocketed, there has been little change in
physical activity levels in the Western population.37 This illustrates that the biggest driver is
what people eat and drink, rather than how active they are.
Of particular importance is the mounting, consistent evidence from the field of behavioural
science that the choices people make about what to eat and drink are heavily influenced by
cues in their physical, social and informational environment. This has shown to be
disproportionately true for those living in deprived areas and on low incomes.38 Thus, many of
us do not make active, deliberate choices about what to buy. Rather, we are heavily shaped
10 ACCESS TO NUTRITION INITIATIVE U.K. PRODUCT PROFILEContext
(often subconsciously) by cues, such as advertising and marketing. Tellingly, in 2017, 46% of
food and drink advertising was spent on confectionery, sweet and savoury snacks and soft
drinks while only 2.5% was spent on fruit and vegetables.39
Many people simply are not able to buy healthier options because of where they live and/or
the types of shops and foods they can access.40 Although one study showed that at the
aggregate level a diet that aligned to the Eatwell Guide would cost the same as the average
current diet, i.e. £6 per adult per day,41 many impediments prevent people doing so in
practice, particularly those on low incomes.42
In recent years, there has been a realisation that approaches that focus on encouraging
personal responsibility and initiatives that try to boost personal motivation are unlikely to drive
mass behaviour change in the absence of an environment that supports and privileges
healthier options. This has led the public health community to look beyond the solutions tried
to date to tackle childhood obesity framed simply around the need for better education or for
individuals to be more disciplined – for example, to identifying and implementing systemic
changes that make healthy options the easy options for everyone, rich or poor.43
Responses
International goals and targets
The international community has set a target, within SDG 3 ‘Good Health and Well-being’, to
reduce by one-third premature mortality from non-communicable diseases by 2030, through
both prevention and treatment.44
Prior to the SDGs being adopted, the World Health Organization (WHO) set global targets
for 2025 covering specific diet-related diseases:45
• 25% relative reduction in overall mortality from cardiovascular diseases, cancer, diabetes,
or chronic respiratory diseases.
• 30% relative reduction in mean population intake of salt/sodium.
• 25% relative reduction in the prevalence of raised blood pressure or contain the
prevalence of raised blood pressure, according to national circumstances.
So significant has been the rate of increase in diabetes and obesity in recent years that the
WHO 2025 target in respect of these conditions, set in 2010, was only to halt their rise
among adults and children, not even to reduce them below 2010 levels.
The U.K. Government’s approaches to improving diets
In 2009, Public Health England (PHE), an executive agency of the Department of Health and
Social Care, launched ‘Change4Life’, a public health social marketing campaign for England
and Wales designed to tackle the causes of obesity.46 It aims to encourage families to make
small, sustainable yet significant improvements to their diet and activity levels. Separate
programmes are in place for Scotland and Northern Ireland. Using the slogan ‘eat well, move
more, live longer’ it encourages families to adopt a range of healthy behaviours through
social media campaigns, by providing a range of information and resources. It is not clear
what the public health impact has been.
In 2016, the Government published Childhood Obesity: A Plan for Action, followed by what
is widely referred to as ‘Chapter 2’ in 2018. These policy documents were set against a
‘new national ambition to halve childhood obesity rates by 2030 and significantly reduce the
health inequalities that persist’ and included several measures intended to incentivise and
cajole the food industry to create healthier products.47 The plan announced two voluntary
programmes covering sugar reduction and calorie reduction, as well as the Soft Drinks
Industry Levy (SDIL). The two voluntary programmes cover food categories that account for
over half of children’s calorie intake48. A long-running voluntary salt reduction programme is
ACCESS TO NUTRITION INITIATIVE U.K. PRODUCT PROFILE 11Context
also still in effect, along with a well-known ‘five-a-day’ campaign designed to boost the
intake of fruits and vegetables, and therefore, inherently, fibre. The Government is
considering a separate programme related to saturated fats. These programmes are
described in Box 2.
PHE is also responsible for tracking the sugar, calorie and salt reduction programmes.49
It has established baselines for each programme and publishes regular progress reports.
Further detailed assessments are undertaken every two years to determine and advise
Government on industry’s progress on delivering reductions.50 Food and beverage
manufacturers should note the Government’s warning that ‘we will not shy away from further
action, including mandatory and fiscal levers, if industry is failing to face up to the scale of
the problem through voluntary reduction programmes.’51
Additional proposals were laid out in the Green Paper on Prevention published in July 2019,
which promises to leverage advances in various forms of science and technology and to put
prevention at the centre of decision-making.52 It places substantial emphasis on addressing
the wide health disparities that occur between rich and poor in the U.K. The paper
announced a ban on the sale of energy drinks to children under 16, as well as several other
proposals set out in what is called ‘Chapter 3’ of the 2016 Childhood Obesity Plan. These
include an exploration of how the marketing and labelling of infant food can be improved
given mounting evidence of the poor diets of infants and young children. For example,
three-quarters of children aged 4 to 18 months exceed their daily energy intake requirements
and this figure increases with age following the introduction of solids. Sugar levels in some
commercial baby foods have been found to be very high and around 90% of children aged
1.5 to 3 years old exceed recommended daily sugar intake levels. Other measures outlined
in the Green Paper relate to front-of-pack nutrition labelling, further product reformulation
(with a renewed focus on reducing salt intake) and support for individuals to achieve and
maintain a healthier weight.53
Box 2: The U.K. Government’s programmes to improve diets in the U.K.
This box provides more detail on the various Government programmes outlined above.
Sugar
Acutely aware of the serious challenges that rising rates of obesity pose to their
countries, many governments have introduced measures to try to stem the problem.
To date, taxes on sugary drinks or high sugar foods have been the most popular. Since
2015 they have more than tripled in number – there are now more than 40 around the
world at city, state or federal level in many large markets such as the U.S., Mexico,
Chile, India, France, Spain, Portugal, Ireland, Belgium and South Africa – and the U.K.54
They are reported to be under consideration in Canada and New Zealand.55,56
The U.K. Government has introduced several fiscal and policy measures to try to reduce
the number of unhealthy products sold and discourage their consumption. In 2016, it
published Childhood Obesity: A Plan for Action, which included several measures
intended to encourage the food industry to create healthier products.57 While designed
to address childhood obesity particularly, these measures should generate benefits for
all consumers, young and old.
The headline measure was the Soft Drinks Industry Levy (SDIL), which applies in all U.K.
nations, designed to encourage producers to reduce the amount of sugar in their
products and to move consumers towards healthier alternatives. Having been given
nearly two years to reformulate their products, from April 2018 soft drink manufacturers
were required to pay tax on drinks sold based on their sugar content.58,59 The
Government has estimated it will raise £240 million annually from the levy. PHE’s
12 ACCESS TO NUTRITION INITIATIVE U.K. PRODUCT PROFILEContext
progress report published in May 2018 found that for drinks covered by the SDIL,
including retailers’ own brand and manufacturers’ branded products, an 11% reduction
in sugar levels per 100mL had been achieved. The calorie content of SDIL drinks ‘likely
to be consumed on a single occasion’ also fell by 6%. In addition, a shift in sales volumes
towards products with levels of sugar (below 5g per 100g which are not subject to the
levy) was also recorded.60
The Government’s approach also includes broader sugar reduction targets to be
delivered by voluntary manufacturer and retailer commitments through the Sugar
Reduction Programme. This sets a 20% voluntary sugar reduction target, to be achieved
by 2020 by the whole food industry. It initially covers ten categories of food and drink
products most widely consumed by children up to 18 years of age: breakfast cereals,
yoghurts, biscuits, cakes, chocolate confectionery, sweet confectionery, morning goods
(e.g. pastries), puddings, ice cream and sweet spreads. The Government anticipated
that the reductions can be achieved by lowering sugar levels in products, reducing
portion size or shifting purchasing towards lower sugar alternatives.61 It also includes
work to reduce the sugar content of product ranges explicitly targeted at babies and
young children, excluding breast-milk substitutes.
PHE’s 2018 progress report found that across eight of the ten food categories tracked
(i.e. excluding cakes and morning goods which were not tracked), retailers and
manufacturers had achieved a 2% reduction in total sugar per 100g. Of the top 20
brands, ranked by total sugar sales in year 1, only 33% showed a decrease in the sugar
content; 56% showed no change in the sugar content and 12% showed an increase in
the sugar content.62
Calories
In 2018, the Government expanded the sugar reduction measures to include other
high-calorie foods, in part to deter companies from compensating lower sugar levels
with higher saturated fat levels. The Calorie Reduction Programme challenges the food
industry to achieve a 20% reduction in calories by 2024 in product categories that
contribute significantly to children’s calorie intakes (up to the age of 18 years) and
where there is scope for substantial reformulation and/or portion size reduction.
The products covered by the programme include ready meals, pizzas, meat products,
savoury snack products, sauces and dressings, prepared sandwiches, composite salads
and other ‘on the go’ foods including meal deals. It does not cover foods included in the
Sugar Reduction Programme. Shifting consumer purchasing towards lower calorie
options provides an additional mechanism for action.
PHE’s 2018 progress report found that there have been reductions in the calorie
content of products ‘likely to be consumed in a single occasion’ in four of the six
categories where calorie reduction guidelines were set and where progress has been
measured. For retailers’ own brand and manufacturers’ branded products of this kind,
a 2% reduction in calories was recorded.63
Salt
The government first introduced voluntary salt targets in 2006 to challenge the food
industry to bring salt levels down by 2010 to a level closer to the recommended intake
levels.64 In total, four sets of targets have been published in 2006, 2009, 2011 and
2014. They applied to manufacturers, retailers and the out-of-home sector and
encompassed the 76 food groups that contributed most to the population’s intake. An
evaluation of progress published at the end of 2018 showed that results were mixed,
with just over half (52%) of the average targets being met by manufacturers and
retailers. For the out-of-home sector, 71% of products were at or below maximum per
serving targets. Overall, salt intake fell by just 11% between 2006 and 2014, from 8.8g
a day to 8g a day.
ACCESS TO NUTRITION INITIATIVE U.K. PRODUCT PROFILE 13Context
Saturated fat
The Government does not currently have a similar programme to reduce saturated fat
intake. The Scientific Advisory Committee on Nutrition recommended, following a 2018
consultation, that the Government give consideration to strategies to reduce population
average intake of saturated fats to no more than 10% of dietary energy.65
Fruit and vegetables
Britons have been urged through various government-funded and other campaigns to
eat ‘five-a-day’ since 2003 – i.e. around 400g of fruit and vegetables per day.66
However, there is no formal programme, akin to those to reduce sugar and calorie
consumption, that sets targets and monitors the progress of the food and beverage
industry in increasing fruit and vegetable consumption.
Non-governmental initiatives to address the U.K.’s poor diets
Many non-governmental organisations run initiatives that principally target policymakers
or the public directly. Few have long-term programmes that focus on stimulating the private
sector to encourage healthier diets and lifestyles. The U.K. Food Foundation has one such
initiative, called ‘Peas Please’ (see Box 3).67 The Soil Association has a campaign called
‘Out to Lunch’, based on benchmarks it has conducted of the healthiness of children’s meals
at restaurant chains and visitor attractions.68 The Healthier Catering Commitment (HCC) is a
voluntary scheme that works at the local (borough) level in London to support fast food and
café businesses to make simple and affordable changes to the food they sell.69
ShareAction’s new Healthy Markets campaign (for which this report was produced) aims to
leverage the power of investors to drive action on childhood obesity by major stock-market
listed food and beverage companies.70
14 ACCESS TO NUTRITION INITIATIVE U.K. PRODUCT PROFILEContext
Box 3: Peas Please!
In 2017, U.K. think-tank the Food Foundation launched its five-year initiative ‘Peas
Please’, designed to make it easier for everyone in the U.K. to eat more vegetables.
Retailers, manufacturers, out-of-home chains, as well as towns, cities and broadcasters
are asked to make specific timebound, quantitative pledges. The Food Foundation then
tracks and reports on their delivery against these pledges. The types of pledges the
companies are encouraged to make are, for example:
• retailers can commit to increase sales of veg by adopting new measures that drive
increased consumption while maintaining their existing commitments to reduce
waste
• retailers and manufacturers can commit to increase the volume of veg in ready
meals (whole-meal replacements) and meal ingredients
• quick service, food-on-the-go businesses, casual dining restaurants, workplace
canteens and public sector food settings can commit to increase the volume of veg
they sell, aiming for two portions in every main meal while maintaining commitments
to reduce waste
• quick service and casual dining restaurants can commit to offer two portions of veg
inclusive in every children's meal.
The first audit of progress showed 41 organisations had made pledges, of which 26
were on track to achieve their pledge or had already done so. In total, eight months after
making their commitments, 4.8 million additional portions of vegetables had been sold,
though nearly 100 billion is estimated to be the amount needed in total to achieve the
levels set out in the national dietary recommendations, indicating that there is a huge
veg mountain still to climb.
Source: Peas Please Progress Report 2018. From Pledges to Portions.71
Summary
The U.K., like many other countries, is facing a health crisis driven in large part by the nation’s
poor diet. Those that eat poor diets – be they high in fat, salt and sugar and/or low in fruit,
vegetables and wholegrains – are at risk of developing a wide range of serious illnesses and
early death. While up to 40% of those with a normal BMI have metabolic abnormalities
typically associated with obesity, cutting the high and climbing levels of overweight and
obesity in the U.K. is a public health priority, given that the U.K. already has the highest level
of adult obesity in Europe. Childhood obesity is also accorded a high priority because it is a
ticking time-bomb: children who are obese are five times more likely to be obese adults. A
concerted effort is therefore urgently needed to transform the country’s food system so that
everyone is able to afford to eat a healthy diet. Food and beverage companies need to be
central to this effort.
ACCESS TO NUTRITION INITIATIVE U.K. PRODUCT PROFILE 15The role of the Access to Nutrition Initiative 16 ACCESS TO NUTRITION INITIATIVE U.K. PRODUCT PROFILE
The role of ATNI
   Introduction to the Access to Nutrition Initiative

   The Access to Nutrition Initiative (ATNI) aims to encourage the world’s largest food and
   beverage companies to do everything they can to address all forms of malnutrition. This
   encompasses tackling overweight and obesity as well as stunting, wasting and micronutrient
   deficiencies that persist in many of the world’s poorer countries.

   ATNI believes that the food and beverage industry can and should play a central role in
   addressing the world’s nutrition challenges. The packaged food the industry produces makes
   up an increasing proportion of the food we eat. In the U.K., for example72, families dedicate
   on average two-thirds of their food budget on eating at home. In addition, given how much
   food and beverage companies shape the food consumption environment, principally through
   their advertising, marketing and promotional activities, they have the power to change the
   prevailing food environment that is fuelling unhealthy diets.

   Context for the U.K. Product Profile

   ATNI principally aims to achieve its goals by publishing Global Access to Nutrition Indexes
   and similar single-country Indexes. To date, it has published three Global Indexes (2013,
   2016 and 2018) and two Spotlight Indexes for India and the U.S. In addition, ATNI is
   developing other private sector accountability tools, often in partnership with other
   organisations.

   The Access to Nutrition Indexes assess companies’ contributions to ameliorating all forms of
   malnutrition in two ways: i) The Corporate Profile assesses companies’ policies, practices
   and disclosure in relation to a range of business areas. ATNI undertakes this analysis
   in-house, based on companies’ own data and information, published or provided to ATNI
   under confidentiality agreements; ii) The Product Profile analyses both the nutritional quality
   of the companies’ food and beverage products and the extent to which companies’ products
   are suitable to be marketed to children. This work is undertaken in partnership with an expert,
   independent third-party – The George Institute for Global Health (TGI) – based at the
   University of Sydney.

   ATNI first piloted the Product Profile concept in 2012 in Mexico, South Africa and India,
   working with a team led by Professor Mike Rayner at the University of Oxford (a member of
   the ATNI Expert Group).73 Building on that experience, and feedback from stakeholders, ATNI
   then undertook a Product Profile in India in 2016 for the first India Access to Nutrition Index
   and most recently for the 2018 Global Access to Nutrition Index published in May 2018. This
   Index rates 22 of the world’s largest food and beverage manufacturers. The Product Profile
   analysed 23,000 products made by 21 of these companies in nine markets,74 again working
   with the Food Policy Division of TGI, advised by Professor Mike Rayner. A full description of
   the methods used for the study is available in TGI’s report on the nine-country Product Profile.

   With funding from Guy’s and St Thomas’ Charity, ATNI has teamed up with ShareAction – a
   U.K.-based charity – to provide analysis for its new Healthy Markets campaign designed to
   tackle rising childhood obesity levels in the U.K. As with other ShareAction initiatives, Healthy
   Markets will harness the power of investors to create and support healthier options for U.K.
   consumers. As a first step, ATNI is publishing this U.K. Product Profile, excerpted from
   research initially published within its 2018 Global Index. The U.K. Product Profile paints a
   picture of the overall nutritional quality of the products sold by 18 of the world’s largest food
   and beverage manufacturers that operate in the U.K. market. ATNI’s future work to support
   Healthy Markets will assess major food and beverage companies’ policies, practices and
   disclosure relating to tackling childhood obesity, including analysis of their product portfolios.

                        ACCESS TO NUTRITION INITIATIVE U.K. PRODUCT PROFILE                             17
U.K. Product Profile
U.K. Product Profile
Introduction to the U.K. Product Profile
This first U.K. Product Profile utilises the U.K. data within the wider nine-country Product
Profile undertaken in 2017, using 2016 data, published in the 2018 Global Access to
Nutrition Index. While that Index included 22 of the world’s largest food and beverage
manufacturers, only 18 sell their products in the U.K. Therefore, it is only these companies
that are included in this study. The study analyses products in their five best-selling food and
beverage categories. The combined sales of these categories accounted for 49% of total
2016 sales. Only 5% of their total sales in 2016 were not covered by focusing on their top
five categories. In total, more than 3,000 products were analysed.
This report sets out two analyses:
i) an overview of the ‘healthiness’ of these companies’ products, i.e. the nutritional quality of
the products they sell in the U.K., determined by the levels of saturated fat, salt, sugar, fruit,
vegetables and other ingredients, and;
ii) the extent to which their products are suitable to be marketed to children.
Methodology
This section summarises how the study was undertaken. The methodology is more fully
explained in TGI’s report. It is important to note that the data presented here is derived from
the 2018 Product Profile, which included nine countries rather than being designed for the
U.K. specifically. The same two nutrient profiling systems (NPS) were used for all nine
countries to enable comparison of the results across all countries. A more detailed
explanation of the science of nutrient profiling is provided in Box 4.
How products’ nutritional quality was determined
There is no international consensus about the superiority of any one nutrient profiling system,
in part due to the different purposes and contexts for which such systems are designed. For
the nine-country study, ATNI’s Expert Group developed and used a set of criteria to identify
the most appropriate systems from a catalogue of 67 developed for the World Health
Organization.75 An NPS was suitable for consideration if it:
• was developed with appropriate stakeholder consultation
• covered the majority of categories of processed food and beverage products
• took into account both ‘positive’ and ‘negative’ food components/nutrients
• was well-validated with results of the validation published in the peer-reviewed literature
demonstrating that the model produces internally consistent classifications of ‘healthy’
and ‘unhealthy’ foods, consistent with general nutrition principles
• enabled differentiation of nutritional quality within and between categories
• was available in the public domain and allowed free access to the full algorithm (i.e. not a
proprietary model)
• would generate meaningful results across all countries.
For the model to be suitable for consideration to assess the suitability of foods to be
marketed to be children, it must not have been designed solely to address school foods,
given the intention to assess foods available in the general market.
While the U.K.’s 2004/5 NPS used by Ofcom was among those considered for use, it was
not selected because it did not sufficiently meet the above criteria. The two systems
considered to best meet the criteria were:76
18 ACCESS TO NUTRITION INITIATIVE U.K. PRODUCT PROFILEU.K. Product Profile
1. The Health Star Rating (HSR) nutrient profiling system, developed through an extensive
consultative process by the Australian, state and territory governments in collaboration with
industry, public health and consumer groups. It has been used by manufacturers and
retailers on a voluntary basis in Australia and New Zealand since 2014 and is applicable in
any market. It is designed to compare products within similar food categories. Products are
rated between 0.5 stars (least healthy) to 5 stars (most healthy). Any product that scores 3.5
or above is considered healthy.77 (See Box 5 for further explanation of how Health Star
Ratings are calculated.)
2. The WHO Regional Office for Europe nutrient profile model (WHO Europe), developed
for use by WHO’s European member states to identify which products are suitable to be
marketed to children.
The scoring model and nutrients used by each system are shown in Table 2.
Table 2 Scoring model and nutrients used by the HSR and WHO Europe nutrient profiling
systems
HSR WHO Europe
Scoring method Negative nutrients score is Products must not exceed
combined with positive category-specific thresholds per
nutrients score to arrive at a 100g/mL to be permitted to
final ‘score’, which is then market to children.
converted to a Health Star
Rating from 0.5 to 5.0.
Positive nutrients Protein N/A
Fibre
Fruit, vegetable, nut and
legume content (FVNL)
Calcium
Negative nutrients Energy Total fat
Saturated fat Saturated fat
Total sugars Total sugars
Sodium Added sugars
Artificial sweeteners
Trans fat
Sodium
Food and beverage categories and products included in the study
For each of the 18 companies assessed for the U.K. Product Profile, ATNI first identified all
categories in which the companies sold products (data extracted from Euromonitor
International’s industry publications of: Packaged Food 2018, Soft Drinks 2018 and Hot
Drinks 2018).78 Products eligible for inclusion were defined as ‘all packaged foods and
non-alcoholic beverages manufactured by the included companies available for purchase in
the U.K.’.
The study includes at most the five best-selling categories of each company in the U.K.:
some companies sell in only one category (e.g. Arla, dairy only) and others sell products in
more than five categories in the U.K., but only the largest five are included. For nine
companies, 100% of their portfolios are covered; for another four, more than 90% is
captured by including five categories. The percentage ranges are set out in Table 3.
ACCESS TO NUTRITION INITIATIVE U.K. PRODUCT PROFILE 19U.K. Product Profile
Box 4: What are nutrient profiling systems (NPS) and how do they work?
Nutrient profiling is ‘the science of classifying or ranking foods according to their
nutritional composition for reasons related to preventing disease and promoting health’.79
Nutrient profile models or systems (referred to as NPS in this report) have been
developed by academics, government departments, health-related charities and the
food industry for a variety of applications to, inter alia, underpin food labelling, inform
product development and reformulation, restrict advertising and marketing of products
to children and to regulate health and nutrition claims. Although nutrient profiling is a
tool to quantify aspects of individual foods, not diets, NPS are commonly used to
underpin policies designed to improve the overall nutritional quality of diets. There is
currently no international consensus about the superiority of any particular NPS, in part
due to the different purposes and contexts in which each model has been developed
– but they all work broadly the same way.
Each NPS has a different equation – or algorithm – at its heart, which converts the
levels of nutrients and other food components into classifications or scores. Some then
combine those scores to generate a final score for each product that reflects its
healthiness. Some place foods on a spectrum of healthiness while others use a simple
binary classification, where certain foods are deemed ‘healthy’ and so suitable to be
considered to carry a health claim or be marketed to children, for example.
For further explanation, see M. Rayner ‘Nutrient profiling for regulatory purposes’, Proceedings of the Nutrition
Society (2017), 76, 230-236
Box 5: How Health Star Ratings are calculated
The HSR takes into account the four aspects of a food associated with increasing the
risk factors for chronic diseases (energy, saturated fat, sodium and total sugars content)
along with certain ‘positive’ aspects of a food (such as fruit and vegetable content, and
in some instances, dietary fibre, calcium and protein content). Taking these components
into account, points are allocated based on the nutritional composition of 100g or
100mL, following the units used in the nutrition information panel of a food.
‘HSR baseline points’ are first allocated for the energy, saturated fat, total sugars and
sodium content of the food. ‘HSR modifying points’ can then be obtained for the
percentage of the food that is fruits, vegetables, nuts and legumes – and including
coconut, spices, herbs, fungi, seeds and algae (FVNL). These are known as ‘HSR V’
points. Some foods are able to score further modifying points for the protein and dietary
fibre content in the food. These are known as ‘protein’ or ‘HSR P’ points and ‘fibre’ or
‘HSR F’ points respectively. A final HSR score is calculated by subtracting the HSR
modifying points (V, P and F points) from the HSR baseline points. The HSR score is
then assigned a star rating.
Source: Guide for Industry to the Health Star Rating Calculator (HSRC), Version 6, February 2018 available at:
http://healthstarrating.gov.au/internet/healthstarrating/publishing.nsf/Content/guide-for-industry-document
A food or beverage was considered a unique item based upon the brand name and
description irrespective of serving size and packaging (i.e. a specific brand of cola sold in
330mL cans was considered to be the same food item as the same specific brand of cola
sold in 600mL bottles).
20 ACCESS TO NUTRITION INITIATIVE U.K. PRODUCT PROFILEU.K. Product Profile
The following products were excluded from the HSR and WHO Europe analysis:
• unprocessed meat, poultry, fish and raw agricultural commodities such as plain cereals
(on the basis that such foods are not generally required to carry a nutrient declaration)
• plain tea and coffee (on the basis that these make an inherently low nutritional
contribution and are thereby not required to display a nutrient declaration)
• condiments such as herbs, salt, pepper, vinegars and spices (on the basis that these
make an inherently low nutritional contribution and are thereby not required to display a
nutrient declaration)
• infant formulas, supplements and baby food and baby beverages (excluded because
these products are not consumed by the general population and the selected models are
not appropriate for their evaluation).
Source of nutrient content data
Nutrient content data was extracted from photographs of product packaging and entered
into the U.K. FoodSwitch database developed by TGI, Consensus Action on Salt, Sugar and
Health and the Medical Research Council Elsie Widdowson Laboratory. Products with data
entered or updated from 2013 onwards were used to generate product lists for each
company. In September 2017, the companies were provided with the product lists and
nutrient content of their five best-selling categories (data extracted from Euromonitor
International’s industry publications of: Packaged Food 2018, Soft Drinks 2018 and Hot
Drinks 2018) for review and offered an opportunity to make corrections or additions to
information about their product range.
ATNI was pleased that ten of the companies present in the U.K. accepted the request to
supply their full product list or to check, correct or add to their information (Coca-Cola,
Danone, Ferrero, General Mills, Grupo Bimbo, Kellogg, Mondelez, PepsiCo and Unilever).
Mars checked its data and confirmed it did not want to add any information.80 The other seven
companies did not respond, potentially putting themselves at a disadvantage compared to
their ten competitors whose results are based on full and accurate nutrition content data.
Imputation of essential missing data
For those products where the available nutritional information was insufficient to apply the
selected nutrient profile models, it was necessary to impute missing data. Proxy values for fruit,
vegetables, nuts and legumes content were drawn from a database developed by TGI using
the average value of the products with available data. These proxy values were estimated for
each category and assigned to those products in that category with missing data. Proxy values
were also used for fibre. For free sugars a standard proportion of total sugars was assumed
and was specified at the category level. It is worth noting that some companies provided the
required missing information, so imputation was not necessary in all cases.
Scope of sales represented
The percentage of each company’s 2016 sales covered by this analysis is shown in Table 3.
This illustrates that these datasets provide a good representation of the companies’ total
U.K. sales in that year. For ten companies, the analysis encompasses 100% of their U.K.
sales; for all others, apart from Danone and Nestlé, the coverage is above 80% with the
remainder being made up of their lesser-selling categories in the U.K. For Danone and
Nestlé, between 60% and 70% of their sales respectively are covered; a substantial
proportion for each is due to sales of infant formulas and baby foods, which are excluded
from this analysis. The figures of Nestlé and Unilever exclude plain tea and coffee.
ACCESS TO NUTRITION INITIATIVE U.K. PRODUCT PROFILE 21You can also read