Soil Moisture Active Passive (SMAP) Project Assessment Report for Version 5 of the L4_SM Data Product
←
→
Page content transcription
If your browser does not render page correctly, please read the page content below
NASA/TM-2021-104606/Vol. 58

Technical Report Series on Global Modeling and Data Assimilation,
Volume 58

Randal D. Koster, Editor

Soil Moisture Active Passive (SMAP) Project Assessment
Report for Version 5 of the L4_SM Data Product

Rolf H. Reichle, Qing Liu, Randal D. Koster, Joseph V. Ardizzone, Andreas
Colliander, Wade T. Crow, Gabrielle J. M. De Lannoy and John S. Kimball

August 2021
NASA STI Program ... in Profile

Since its founding, NASA has been dedicated           •   CONFERENCE PUBLICATION.
to the advancement of aeronautics and space               Collected papers from scientific and
science. The NASA scientific and technical                technical conferences, symposia, seminars,
information (STI) program plays a key part in             or other meetings sponsored or
helping NASA maintain this important role.                co-sponsored by NASA.

The NASA STI program operates under the               •   SPECIAL PUBLICATION. Scientific,
auspices of the Agency Chief Information Officer.         technical, or historical information from
It collects, organizes, provides for archiving, and       NASA programs, projects, and missions,
disseminates NASA’s STI. The NASA STI                     often concerned with subjects having
program provides access to the NTRS Registered            substantial public interest.
and its public interface, the NASA Technical
Reports Server, thus providing one of the largest     •   TECHNICAL TRANSLATION.
collections of aeronautical and space science STI         English-language translations of foreign
in the world. Results are published in both non-          scientific and technical material pertinent to
NASA channels and by NASA in the NASA STI                 NASA’s mission.
Report Series, which includes the following report
types:                                                Specialized services also include organizing
                                                      and publishing research results, distributing
•   TECHNICAL PUBLICATION. Reports of                 specialized research announcements and
    completed research or a major significant         feeds, providing information desk and personal
    phase of research that present the results of     search support, and enabling data exchange
    NASA Programs and include extensive data          services.
    or theoretical analysis. Includes compila-
    tions of significant scientific and technical     For more information about the NASA STI
    data and information deemed to be of              program, see the following:
    continuing reference value. NASA counter-
    part of peer-reviewed formal professional         •   Access the NASA STI program home page
    papers but has less stringent limitations on          at http://www.sti.nasa.gov
    manuscript length and extent of graphic
    presentations.                                    •   E-mail your question to help@sti.nasa.gov

•   TECHNICAL MEMORANDUM.                             •   Phone the NASA STI Information Desk at
    Scientific and technical findings that are            757-864-9658
    preliminary or of specialized interest,
    e.g., quick release reports, working              •   Write to:
    papers, and bibliographies that contain               NASA STI Information Desk
    minimal annotation. Does not contain                  Mail Stop 148
    extensive analysis.                                   NASA Langley Research Center
                                                          Hampton, VA 23681-2199
•   CONTRACTOR REPORT. Scientific and
    technical findings by NASA-sponsored
    contractors and grantees.
NASA/TM-2021-104606/Vol. 58

Technical Report Series on Global Modeling and Data Assimilation,
Volume 58

Randal D. Koster, Editor

Soil Moisture Active Passive (SMAP) Project Assessment
Report for Version 5 of the L4_SM Data Product
Rolf H. Reichle
Global Modeling and Assimilation Office, NASA Goddard Space Flight Center, Greenbelt, MD

Qing Liu
Science Systems and Applications Inc., Lanham, MD

Randal D. Koster
Global Modeling and Assimilation Office, NASA Goddard Space Flight Center, Greenbelt, MD

Joseph V. Ardizzone
Science Systems and Applications Inc., Lanham, MD

Andreas Colliander
Jet Propulsion Laboratory, Caltech, Pasadena, CA

Wade T. Crow
U.S. Department of Agriculture, Agricultural Research Service, Beltsville, MD

Gabrielle J. M. De Lannoy
KULeuven, Leuven, Belgium

John S. Kimball
University of Montana, Missoula, MT

National Aeronautics and
Space Administration

Goddard Space Flight Center
Greenbelt, Maryland 20771

August 2021
Notice for Copyrighted Information
 This manuscript has been authored by employees of the National Aeronautics and Space
        Administration, Science Systems and Applications, Inc. (SSAI) under contract
   NNG17HP01C, U.S. Department of Agriculture, Jet Propulsion Laboratory, KULeuven,
  and University of Montana with the National Aeronautics and Space Administration. The
 United States Government has a non-exclusive, irrevocable, worldwide license to prepare
    derivative works, publish, or reproduce this manuscript, and allow others to do so, for
      United States Government purposes. Any publisher accepting this manuscript for
   publication acknowledges that the United States Government retains such a license in
 any published form of this manuscript. All other rights are retained by the copyright owner.

Trade names and trademarks are used in this report for identification only. Their usage
does not constitute an official endorsement, either expressed or implied, by the National
Aeronautics and Space Administration.

Level of Review: This material has been technically reviewed by technical management.

                                          Available from

  NASA STI Program                                  National Technical Information
  Mail Stop 148                                     Service 5285 Port Royal Road
  NASA’s Langley Research                           Springfield, VA 22161
  Center Hampton, VA                                703-605-6000
  23681-2199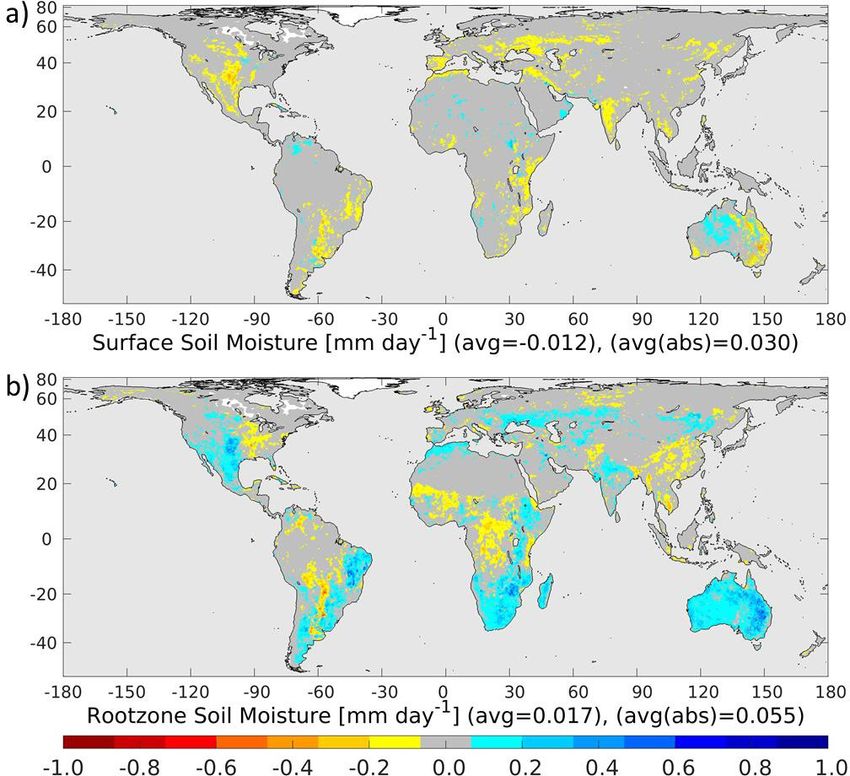
TABLE OF CONTENTS
EXECUTIVE SUMMARY ................................................................................................................ 3
1     INTRODUCTION ....................................................................................................................... 5
2     SMAP CALIBRATION AND VALIDATION OBJECTIVES .................................................. 6
3     L4_SM CALIBRATION AND VALIDATION APPROACH ................................................... 8
4     L4_SM ACCURACY REQUIREMENT ................................................................................... 9
5     L4_SM VERSION 5 RELEASE ............................................................................................... 10
    5.1       Process and Criteria........................................................................................................................ 10
    5.2       Processing and Science ID Version ................................................................................................ 10
    5.3       Summary of Changes from Previous Version .............................................................................. 11
6     L4_SM DATA PRODUCT ASSESSMENT .............................................................................. 13
    6.1     Global Patterns and Features ........................................................................................................ 13
    6.2     Core Validation Sites ...................................................................................................................... 19
       6.2.1     Method ...................................................................................................................................... 19
       6.2.2     Results ....................................................................................................................................... 23
    6.3     Sparse Networks .............................................................................................................................. 25
       6.3.1     Method ...................................................................................................................................... 25
       6.3.2     Results ....................................................................................................................................... 27
    6.4     Satellite Soil Moisture Retrievals ................................................................................................... 28
    6.5     Data Assimilation Diagnostics........................................................................................................ 29
       6.5.1     Observation-Minus-Forecast Residuals .................................................................................... 29
       6.5.2     Increments ................................................................................................................................. 32
       6.5.3     Uncertainty Estimates ............................................................................................................... 34
7     LIMITATIONS AND PLAN FOR FUTURE IMPROVEMENTS ........................................ 36
    7.1       L4_SM Algorithm Calibration and Temporal Homogeneity ...................................................... 36
    7.2       Impact of Ensemble Perturbations ................................................................................................ 36
    7.3       Precipitation Data ........................................................................................................................... 36
    7.4       L4_SM Algorithm Refinements ..................................................................................................... 37
8     SUMMARY AND CONCLUSIONS ......................................................................................... 38
ACKNOWLEDGEMENTS ............................................................................................................ 40
APPENDIX ....................................................................................................................................... 41
    Performance Metrics at Core Validation Site Reference Pixels ............................................................. 41
REFERENCES ................................................................................................................................. 44
2
EXECUTIVE SUMMARY
     This report provides an assessment of Version 5 of the SMAP Level 4 Surface and Root Zone Soil
Moisture (L4_SM) product, which was first released on 27 August 2020. The assessment includes
comparisons of L4_SM soil moisture estimates with in situ measurements from SMAP core validation sites
and sparse networks. The assessment further provides a global evaluation of the internal diagnostics from
the ensemble-based data assimilation system that is used to generate the L4_SM product, including
observation-minus-forecast (O-F) brightness temperature residuals and soil moisture analysis increments.
Together, the core validation site comparisons and the statistics of the assimilation diagnostics are
considered primary validation methodologies for the L4_SM product. Comparisons against in situ
measurements from regional-scale sparse networks are considered a secondary validation methodology
because such in situ measurements are subject to upscaling errors from the point-scale to the grid-cell scale
of the data product.
     The Version 5 L4_SM algorithm was recalibrated to work with the substantially changed calibration
of the assimilated Version 5 (R17) Level-1C brightness temperatures. Specifically, the brightness
temperature scaling parameters in the Version 5 L4_SM algorithm are based on five years of SMAP
observations (April 2015 – March 2020) and no longer rely on data from the Soil Moisture and Ocean
Salinity (SMOS) mission. The Version 5 L4_SM algorithm also benefits from an updated calibration of
the microwave radiative transfer model parameters. Moreover, the land surface modeling system
underpinning the L4_SM algorithm uses an improved surface aerodynamic roughness length formulation.
Furthermore, an error in the fitting procedure used for one of the topography-related functions in the
Catchment model was corrected. This error potentially affected the simulation of soil moisture in about
2% of all land surface elements in previous versions. Finally, the Version 5 L4_SM algorithm includes
major software infrastructure upgrades, including full compliance with the modular and extensible Earth
System Modeling Framework, to facilitate future science algorithm development.
     An analysis of the time-average surface and root zone soil moisture shows that the global pattern of
arid and humid regions is captured by the Version 5 L4_SM estimates. Compared to Version 4, the Version
5 surface and root-zone soil moisture is generally slightly drier, owing primarily to a bug fix in the ensemble
perturbations algorithm. The bug fix also removed an error in the long-term water balance of the Version
4 product, which did not close even after accounting for the (small) effect of the soil moisture analysis
increments. Because of these climatological differences, the Version 4 and Version 5 products should not
be combined into a single dataset for use in applications.
     Results from the core validation site comparisons indicate that Version 5 of the L4_SM data product
meets the self-imposed L4_SM accuracy requirement, which is formulated in terms of the root-mean square
(RMS) error after removal of the long-term mean error, i.e., ubRMSE≤0.04 m3 m-3, where the error is vs.
the unknown true soil moisture. Computed directly against core site in situ measurements at the 9 km scale,
the average unbiased RMS difference of the 3-hourly L4_SM data is 0.040 m3 m-3 for surface soil moisture
and 0.027 m3 m-3 for root zone soil moisture. When factoring in the measurement error of the in situ data,
the L4_SM product clearly meets the 0.04 m3 m-3 ubRMSE requirement. The L4_SM estimates are an
improvement compared to estimates from a model-only open loop (OL5030) simulation, which
demonstrates the beneficial impact of the SMAP brightness temperature data. Overall, L4_SM surface and
root zone soil moisture estimates are more skillful than OL5030 estimates, with statistically significant
improvements for surface soil moisture R and anomaly R values (based on 95% confidence intervals).
Results from comparisons of the L4_SM product to in situ measurements from more than 400 sparse
network sites corroborate the core validation site results.
     The instantaneous soil moisture analysis increments lie within a reasonable range and result in spatially
smooth soil moisture analyses. The long-term mean soil moisture analysis increments make up only a small
fraction of the water budget. The O-F residuals exhibit only small regional biases on the order of 1-3 K

                                                                                                            3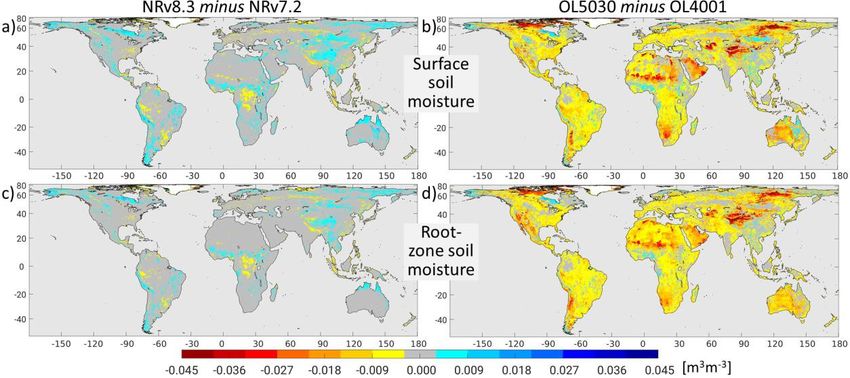
between the (rescaled) SMAP brightness temperature observations and the L4_SM model forecast, which
indicates that the assimilation system is reasonably unbiased. The globally averaged time series standard
deviation of the O-F residuals is 5.5 K, which reduces to 3.5 K for the observation-minus-analysis (O-A)
residuals, reflecting the impact of the SMAP observations on the L4_SM system. Regionally, the time
series standard deviation of the normalized O-F residuals deviates considerably from unity, which indicates
that regionally the L4_SM assimilation algorithm over- or underestimates the total (model and observation)
error present in the system.
      In summary, Version 5 of the L4_SM product is sufficiently mature and of adequate quality for
distribution to and use by the larger science and application communities.

                                                                                                        4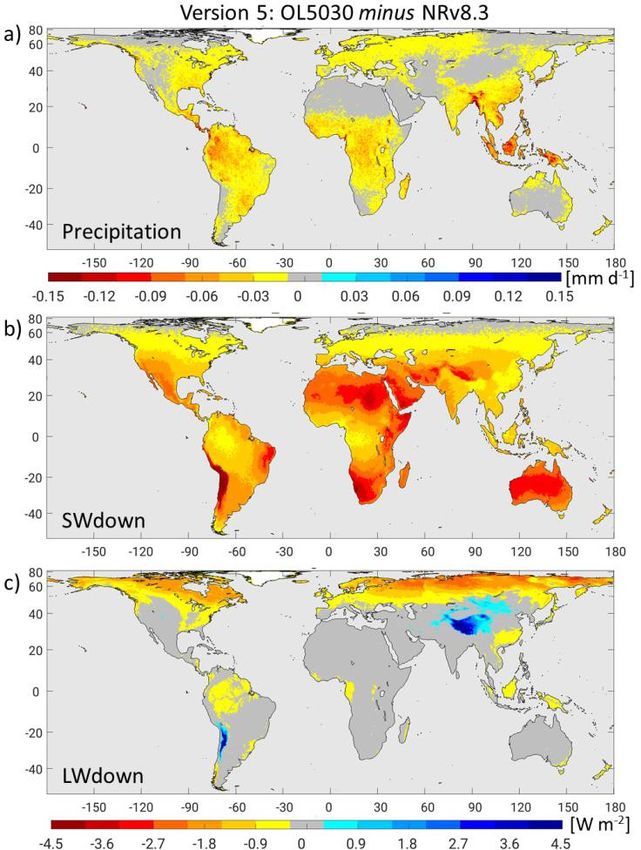
1 INTRODUCTION
     The NASA Soil Moisture Active Passive (SMAP) mission provides global measurements of L-band
(1.4 GHz) brightness temperature from a 685-km, near-polar, sun-synchronous orbit. These observations
are primarily sensitive to soil moisture and temperature in the top few centimeters of the soil. SMAP data
can therefore be used to enhance our understanding of processes that link the terrestrial water, energy, and
carbon cycles, and to extend the capabilities of weather and climate prediction models (Entekhabi et al.
2014).
     The suite of SMAP data products includes the Level 4 Surface and Root Zone Soil Moisture (L4_SM)
product, which provides deeper-layer soil moisture estimates that are not available in the Level 2-3 retrieval
products. The L4_SM product is based on the assimilation of SMAP brightness temperatures into the
NASA Catchment land surface model (Koster et al. 2000) using a customized version of the Goddard Earth
Observing System (GEOS) land data assimilation system (Figure 1; Reichle et al. 2014a, 2017a,b, 2019).
This system, which is based on the ensemble Kalman filter (EnKF), accounts for model and observational
uncertainty through perturbations of select Catchment model forcing and soil moisture prognostic variables,
propagates the surface information from the SMAP instrument to the deeper soil, and ultimately provides
global, 3-hourly estimates of soil moisture and other land surface fields without gaps in coverage. The
publication latency of the L4_SM product is about 3 days. This latency is driven by the availability of the
gauge-based precipitation product used to force the land surface model (Reichle and Liu 2014; Reichle et
al. 2014b, 2017a,b, 2021).

                                Figure 1. Schematic of the L4_SM algorithm.

     The L4_SM product provides surface and root zone soil moisture (along with other geophysical fields)
as 3-hourly, time-average fields on the global, cylindrical, 9 km Equal-Area Scalable Earth, version 2
(EASEv2) grid in the “geophysical” (or “gph”) output Collection (Reichle et al. 2018a). Moreover,
instantaneous soil moisture and soil temperature fields before and after the assimilation update are provided
every three hours on the same grid in the “analysis update” (or “aup”) output Collection, along with other
assimilation diagnostics and error estimates. Time-invariant land model parameters, such as soil porosity,
wilting point, and microwave radiative transfer parameters, are provided in the “land-model-constants” (or
“lmc”) Collection (Reichle et al. 2018a).
     For geophysical data products that are based on the assimilation of satellite observations into numerical
process models, validation is critical and must be based on quantitative estimates of uncertainty. Direct
comparison with independent observations, including ground-based measurements, is a key part of
validation. This assessment report provides a detailed description of the status of the L4_SM data quality
for the Version 5 release of the L4_SM data product. The L4_SM validation process and data quality of
previous versions are discussed by Reichle et al. (2015, 2016, 2017a,b, 2018b, 2019, 2021).

                                                                                                           5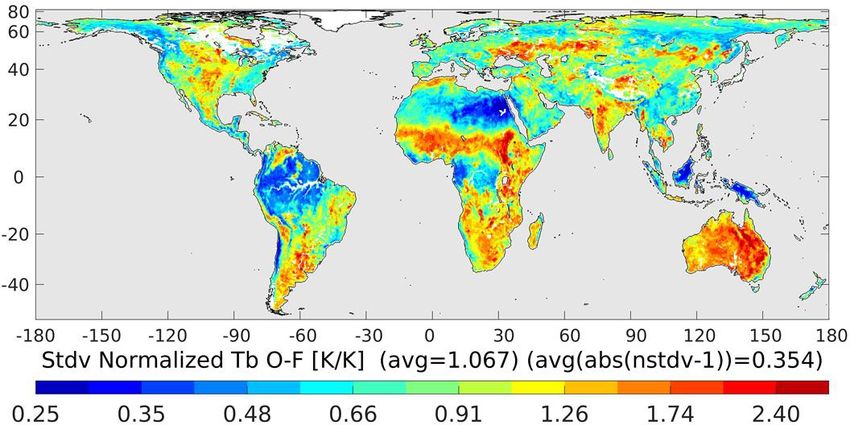
2 SMAP CALIBRATION AND VALIDATION OBJECTIVES
    During the post-launch SMAP calibration and validation (Cal/Val) phase each science product team
pursues two objectives:
    1. Calibrate, verify, and improve the performance of the science algorithm.
    2. Validate the accuracy of the science data product as specified in the science requirements and
       according to the Cal/Val schedule.

                     Figure 2. Overview of the SMAP calibration and validation process.

     The overall SMAP Cal/Val process is illustrated in Figure 2. This process was first formalized in the
SMAP Science Data Cal/Val Plan (Jackson et al. 2014) and the SMAP L2-L4 Data Products Cal/Val Plan
(Colliander et al. 2014). Recently, many pioneering aspects of the SMAP Cal/Val process were
incorporated into community standards for soil moisture product validation and good practices (Gruber et
al. 2020; Montzka et al. 2020). The present assessment report describes how the L4_SM team addressed
the Cal/Val objectives for the Version 5 release. The validation approach and procedures that apply
specifically to the L4_SM product are further detailed in the Algorithm Theoretical Basis Document for the
L4_SM data product (Reichle et al. 2014b).
     SMAP established unified definitions to address the mission requirements. These are documented in
the SMAP Handbook (Entekhabi et al. 2014), where calibration and validation are defined as follows:
    • Calibration: The set of operations that establish, under specified conditions, the relationship
        between sets of values or quantities indicated by a measuring instrument or measuring system and
        the corresponding values realized by standards.
    • Validation: The process of assessing by independent means the quality of the data products derived
        from the system outputs.
     To ensure the public’s timely access to SMAP data, the mission was required to release validated data
products within one year of the beginning of mission science operations. The objectives and maturity of
the SMAP validated release products follow the guidance provided by the Committee on Earth Observation

                                                                                                       6
Satellites (CEOS) Working Group on Calibration and Validation (CEOS 2015), which can be summarized
as follows (Colliander et al. 2021; their Appendix A):
• Stage 1 Validation: Product accuracy is assessed from a small (typically < 30) set of locations and
time periods by comparison with in-situ or other suitable reference data.
• Stage 2 Validation: Product accuracy is estimated over a significant (typically > 30) set of locations
and time periods by comparison with reference in situ or other suitable reference data. Spatial and
temporal consistency of the product, and its consistency with similar products, has been evaluated
over globally representative locations and time periods. Results are published in the peer-reviewed
literature.
• Stage 3 Validation: Uncertainties in the product and its associated structure are well quantified over
a significant (typically > 30) set of locations and time periods representing global conditions by
comparison with reference in situ or other suitable reference data. Validation procedures follow
community-agreed-upon good practices. Spatial and temporal consistency of the product, and its
consistency with similar products, has been evaluated over globally representative locations and
time periods. Results are published in the peer-reviewed literature.
• Stage 4 Validation: Validation results for stage 3 are systematically updated when new product
versions are released and as the interannual time-series expands. When appropriate for the product,
uncertainties in the product are quantified using fiducial reference measurements over a global
network of sites and time periods (if available).
For the Version 5 release, the L4_SM team has completed Stages 1-4, including repeated publication
of the latest validation results in the peer-reviewed literature (Reichle et al. 2017a,b, 2019, 2021; Colliander
et al. 2021). The Cal/Val program will continue over the SMAP mission life span. Incremental
improvements are ongoing as more measurements become available from the SMAP observatory. Version
5 data will be replaced in the archive when upgraded product versions become available.
73 L4_SM CALIBRATION AND VALIDATION APPROACH
During the mission definition and development phase, the SMAP Science Team and Cal/Val Working
Group identified the metrics and methodologies that would be used for L2-L4 product assessment. These
metrics and methodologies were vetted in community Cal/Val Workshops and tested in SMAP pre-launch
Cal/Val rehearsal campaigns. The following validation methodologies and their general roles in the SMAP
Cal/Val process were identified:
• Core Validation Sites: Accurate estimates at matching scales for a limited set of conditions.
• Sparse Networks: One point in the grid cell for a wide range of conditions.
• Satellite Products: Estimates over a very wide range of conditions at matching scales.
• Model Products: Estimates over a very wide range of conditions at matching scales.
• Field Campaigns: Detailed estimates for a very limited set of conditions.
Regarding the CEOS Cal/Val stages (section 2), core validation sites address Stage 1, and satellite and
model products are used for Stage 2 and beyond. Sparse networks fall between these two stages.
For the L4_SM data product, all of the above methodologies can contribute to product assessment and
refinement, but there are differences in terms of the importance of each approach for the validation of the
L4_SM product.
The assessment of the L4_SM data product includes comparisons of SMAP L4_SM soil moisture
estimates with in situ soil moisture observations from core validation sites and sparse networks. Moreover,
independent soil moisture retrievals from satellite radar observations are used to measure the contribution
of the SMAP analysis to the anomaly time series correlation skill of the L4_SM product across much of the
global land surface. Finally, the assessment includes a global evaluation of the internal diagnostics from
the ensemble-based data assimilation system that is used to generate the L4_SM product. This evaluation
focuses on the statistics of the observation-minus-forecast (O-F) residuals and the analysis increments.
The core site comparisons, the assessment of the anomaly correlation skill using independent radar
soil moisture retrievals, and the statistics of the assimilation diagnostics are considered primary validation
methodologies for the L4_SM product. Comparisons against in situ measurements from regional-scale
sparse networks are considered a secondary validation methodology because such in situ measurements are
subject to upscaling errors from the point-scale to the grid-cell scale of the data product.
Due to their very limited spatial and temporal extent, data from field campaigns play only a tertiary
role in the validation of the L4_SM data product. Note, however, that field campaigns are instrumental
tools in the provision of high-quality, automated observations from the core validation sites and thus play
an important indirect role in the validation of the L4_SM data product.
84 L4_SM ACCURACY REQUIREMENT
There is no formal Level 1 mission requirement for the validation of the L4_SM product, but the
L4_SM team self-imposed an accuracy requirement mirroring the one applied to the L2_SM_AP product.
Specifically, the L4_SM surface and root zone soil moisture estimates are required to meet the following
criterion:
ubRMSE ≤ 0.04 m3 m-3 within the data masks specified in the SMAP Level 2 Science Requirements
(that is, excluding regions of snow and ice, frozen ground, mountainous topography, open water,
urban areas, and vegetation with water content greater than 5 kg m-2),
where ubRMSE is the “unbiased” root-mean square (RMS) error, that is, the RMS error computed after
removing long-term mean bias from the data (Entekhabi et al. 2010; Reichle et al. 2015, their Appendix A).
(The ubRMSE is also referred to as the standard deviation of the error.) This criterion applies to the L4_SM
instantaneous surface and root zone soil moisture estimates at the 9 km grid-cell scale from the “aup”
Collection. It is verified by comparing the L4_SM product to the grid-cell scale in situ measurements from
the core validation sites (section 6.2). The criterion applies to the site-average ubRMSE, which is obtained
by averaging across the ubRMSE values for all 9 km core site reference pixels that provide suitable in situ
measurements (Reichle et al. 2015).
L4_SM output fields other than instantaneous surface and root zone soil moisture are provided as
research products (including surface meteorological forcing variables, soil temperature, evaporative
fraction, net radiation, etc.) and will be evaluated against in situ observations to the extent possible given
available resources.
As part of the validation process, additional metrics (including bias, RMS error, time series correlation
coefficient R, and anomaly R values) are also computed for the L4_SM output. This includes computation
of the metrics outside of the limited geographic area for which the ubRMSE≤0.04 m3 m-3 validation criterion
applies.
For the computation of the anomaly R metric, climatological values of soil moisture from a given
dataset (i.e., the L4_SM product or the in situ measurements) at a given location are computed for each day
of the year, thereby generating a local climatological seasonal cycle for that dataset. Anomaly time series
are then computed by subtracting this climatological seasonal cycle from the corresponding raw data. The
anomaly R metric is derived by computing the correlation coefficient between the L4_SM and the in situ
anomaly time series (Reichle et al. 2015).
The validation includes additional metrics that are based on the statistics of the O-F residuals and other
data assimilation diagnostics (section 6.5). Reichle et al. (2015) provide detailed definitions of all the
validation metrics and confidence intervals used here.
95 L4_SM VERSION 5 RELEASE
5.1 Process and Criteria
Since the beginning of the SMAP science data flow on 31 March 2015, the L4_SM team has been
conducting frequent assessments of the L4_SM data product and will continue to evaluate the product
throughout the life of the SMAP mission. These assessments are based on core validation sites, sparse
networks, and assimilation diagnostics, and they capture a wide range of geophysical conditions. The
present report summarizes the status of this process.
The validation of the Version 5 L4_SM product includes comparisons against output from two model-
only simulations that are based on the same land surface model and forcing data as the Version 5 L4_SM
estimates but are not informed by SMAP brightness temperature observations (Table 1). Any accuracy in
these model-only estimates is derived from the imposed meteorological forcing and land model structure
and parameter information.
The first model-only simulation, the ensemble “open loop” (OL5030), employs 24 ensemble members
and applies the same forcing and model prognostics perturbations that are also used in the Version 5 L4_SM
algorithm, whereas the second model-only simulation, the “Nature Run,” version 8.3 (NRv8.3), is a single-
member land model simulation without perturbations (Table 1). The different characteristics of the
ensemble open loop and the unperturbed simulation are exploited in section 6.1, where we assess the impact
of the ensemble perturbations on the climatology of the L4_SM soil moisture estimates.
The OL5030 estimates were prepared for the SMAP period (31 March 2015 to present). The NRv8.3
estimates were generated for the period 1 January 2000 to present. In addition to serving as a reference in
the L4_SM assessment, the NRv8.3 estimates also provide the modeled climatological information required
by the L4_SM assimilation algorithm (Reichle et al. 2014b).
Table 1. Overview of L4_SM products and model-only simulations.
No. ensemble Perturbations? SMAP Version 5 Version 4
members Assimilation?
L4_SM Product 24 Yes Yes Vv5030 Vv4030
Ensemble Open Loop 24 Yes No OL5030 OL4001
Nature Run 1 No No NRv8.3 NRv7.2
5.2 Processing and Science ID Version
The L4_SM product version used to prepare this assessment report has Science Version ID Vv5030
(Table 1; Reichle et al. 2020a,b,c). The L4_SM Vv5030 algorithm assimilates operational data from the
Version 5 SMAP L1C_TB brightness temperatures (CRID R17000 through 22 April 2021 and R17030
from 23 April 2021 through present; Chan et al. 2020).
The assessment period for this report is defined as the 6-year period from 1 April 2015, 0z to 1 April
2021, 0z. The start date matches the first full day when the radiometer was operating under reasonably
stable conditions following instrument start-up operations. The end date was selected to include the
maximum possible number of full years at the time when the present report was prepared.
10For illustrating select changes from the previous L4_SM product versions, this report also used
published Version 4 L4_SM data (Science Version ID Vv4030; Reichle et al. 2018c,d,e), along with the
corresponding Nature Run (NRv7.2) and ensemble open loop (OL4001) simulations (Table 1). Because
Version 4 production ceased before the end of the 6-year validation period, direct comparisons of Version
4 and 5 data are conducted for the 4-year period from 1 April 2015, 0z to 1 April 2019, 0z.
Like previous versions, Version 5 of the L4_SM algorithm ingests only the SMAP L1C_TB radiometer
brightness temperatures, contrary to the originally planned use of downscaled brightness temperatures from
the L2_SM_AP product and landscape freeze-thaw state retrievals from the L2_SM_A product. The latter
two products are based on SMAP radar observations and are only available for the 10-week period from 13
April to 7 July 2015 because of the failure of the SMAP radar instrument. The decision to use only
radiometer (L1C_TB) inputs for the Version 5 release was made to ensure homogeneity in the longer-term
L4_SM data record.
In February 2021, the SMAP Level-1 team discovered that errors in the antenna scan angle (ASA)
inputs affected ~1,600 L1C_TB half-orbit data granules on 55 data-days in 2019 (5 October–23 November)
and 2020 (4-5 February, 9 April, 30 May, and 18 June). The bad data exhibited geolocation errors up to
~100 km in the along-scan direction that were not identified by data quality flags. When the ASA errors
were discovered, reprocessing of the L4_SM Vv5030 product was halted on data-day 4 October 2019 until
nearly all of the 1,600 bad L1C_TB half-orbits were corrected. However, the processing of the published
L4_SM Vv5030 data for October 2019 inadvertently used 22 of the bad L1C_TB half-orbits. To assess the
impact of this processing error, we regenerated the Vv5030 L4_SM data for October 2019 under product
counter 002 without ingesting the 22 bad L1C_TB half-orbits. The differences between the published
Vv5030 data and the Vv5030 data with product counter 002 are minimal. There is virtually no impact on
root-zone soil moisture, and the occasional differences in surface soil moisture dissipate very quickly. It is
impossible to tell with a reasonable amount of effort whether the published or the product counter 002 data
are more correct. For example, the antenna scan angle error might only impact the L1C_TB brightness
temperature observations over ocean and ice; omitting the entire L1C_TB half-orbit from being used in
L4_SM processing might then result in discarding good information over land. For these reasons, we
decided not to replace the published Vv5030 data for October 2019 with the product counter 002 version.
In the meantime, an automated check for ASA errors was added to L1C_TB processing by the Level-1 team
and placed into operations on 23 April 2021 (CRID R17030). Future reprocessing of the L1C_TB and
L4_SM data will therefore avoid a repeat of the aforementioned ASA processing errors.
5.3 Summary of Changes from Previous Version
This section provides a summary of algorithm changes between the previous L4_SM Version 4
algorithm and the current Version 5 assessed here.
Version 5 of the L4_SM algorithm uses the Catchment model version associated with NRv8.3, which
includes minor updates from the previous version of the modeling system (NRv7.2). Specifically:
1.) NRv8.3 uses a revised formulation for the aerodynamic roughness length for consistency1 with the
land model version used in the currently operational version of the GEOS Forward-Processing
1
Two differences between the land-related parameterizations in L4_SM and FP remain. Specifically, the Version 5 L4_SM
algorithm uses the Louis surface turbulence scheme (Louis 1979) and vegetation (tree) height inputs derived from space-borne
Lidar measurements (Simard et al. 2011), as in Version 4, whereas the current FP system uses the Helfand surface turbulence
scheme (Helfand and Schubert, 1995) and old look-up table vegetation heights. The latter are used in FP because of a slight
degradation in the medium-range forecast skill when the satellite-based vegetation heights were used in system development testing
of the FP system (presumably owing to compensating errors). The L4_SM algorithm still uses the older Louis surface turbulence
11(FP) system (Koster et al. 2020; Lucchesi 2018). The revised formulation includes a higher
minimum surface roughness (which particularly affects turbulent fluxes in deserts) and applies
estimates of stem area index along with leaf area index in the roughness calculation.
2.) NRv8.3 corrects an error in the fitting procedure used for one of the topography-related functions
in the Catchment model, which potentially affects the simulation of soil moisture in about 2% of
all land surface elements (De Lannoy et al. 2014b).
Moreover, the following changes impact the L4_SM brightness temperature analysis.
3.) The microwave radiative transfer parameters are calibrated following De Lannoy et al. (2013,
2014a). The parameters used in the Version 5 algorithm were calibrated using the matching
NRv8.3 modeling system and 10 years of SMOS brightness temperature observations (July 2010
– June 2020).
4.) The calibration of the assimilated SMAP L1C_TB brightness temperatures changed substantially
from Version 4 to Version 5. Over land, L1C_TB brightness temperatures are colder by 2-3 Kelvin
on average in Version 5 compared to Version 4 (Peng et al. 2020). Consequently, the Version 5
L4_SM algorithm was recalibrated to work with the substantially changed calibration of the
assimilated L1C_TB brightness temperatures. Specifically, the brightness temperature scaling
parameters in the Version 5 L4_SM algorithm are based on five years of Version 5 SMAP
brightness temperature observations (April 2015 – March 2020) and, unlike in previous versions,
do not rely on SMOS data.
5.) A bug in the ensemble perturbations of the photosynthetically active radiation (PAR) forcing was
fixed in the Version 5 L4_SM algorithm. In all previous L4_SM versions, this bug caused an error
in the unstressed canopy resistance calculations, which resulted in an error in evapotranspiration
primarily over arid regions and deserts, as well as a lack of closure of the water balance in these
regions.
Finally, the Version 5 L4_SM algorithm includes major software infrastructure upgrades.
6.) Specifically, the Version 5 L4_SM algorithm is now fully compliant with the modular and
extensible Earth System Modeling Framework (ESMF), to facilitate future science algorithm
development.
7.) The solar zenith angle calculations in the Version 5 L4_SM algorithm use ESMF utilities, which
differ slightly from the legacy code that was used in the Version 4 algorithm.
8.) In all previous L4_SM versions, there was a slight inconsistency in how ensemble averages of
Catchment model diagnostic variables (such as soil moisture) were calculated. Specifically, the
model diagnostic variables in the “Geophysical Data” (gph) output files were derived from the
ensemble average of the model prognostic variables (such as the Catchment model soil water
excess and deficit variables), whereas model diagnostic variables in the “Analysis Update Data”
collection were first derived separately for each ensemble member and then averaged across the
ensemble. In the Version 5 L4_SM algorithm, all model diagnostic outputs are first derived
separately for each ensemble member and then averaged across the ensemble.
scheme because this scheme includes an implicit treatment of the sensitivity of aerodynamic resistance to both temperature and
humidity; such a treatment is important in the offline (land-only) L4_SM modeling system but is not yet implemented in the newer
Helfand scheme (Helfand and Schubert, 1995) used in the current FP system.
126 L4_SM DATA PRODUCT ASSESSMENT
This section provides a detailed assessment of the Version 5 L4_SM data product. First, global
patterns and features are discussed briefly, including the impact of a bug in the ensemble perturbation
algorithm in Version 4 that has been fixed in Version 5 (section 6.1). Next, we present comparisons and
metrics versus in situ measurements from core validation sites (section 6.2) and sparse networks (section
6.3), followed by a brief discussion of the assessment versus satellite retrievals (section 6.4). Thereafter,
we evaluate the assimilation diagnostics (section 6.5) through an analysis of the O-F brightness temperature
residuals, the soil moisture increments, and the data product uncertainty estimates.
6.1 Global Patterns and Features
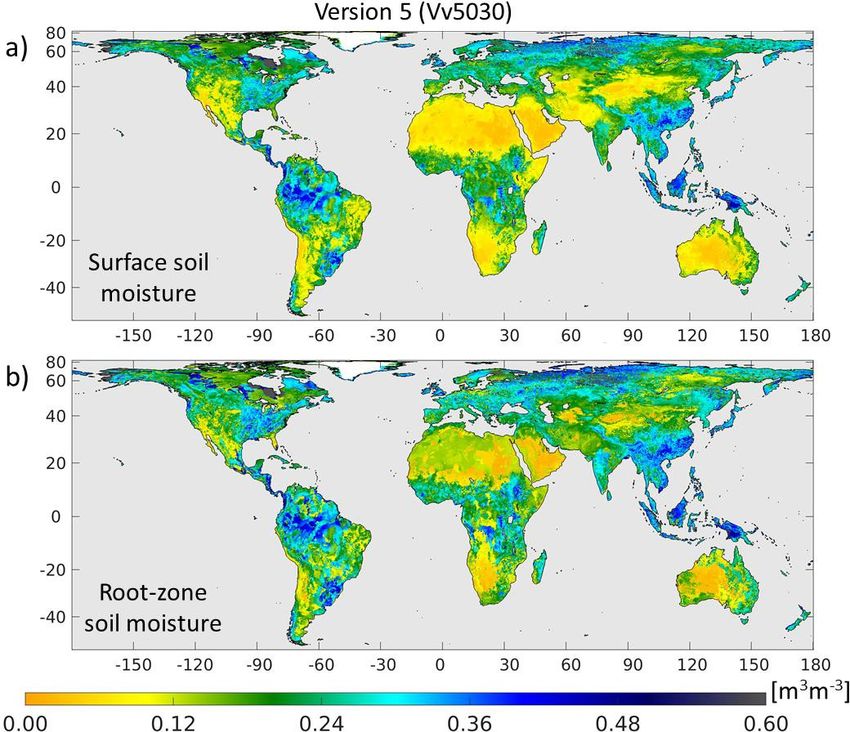
Figure 3 shows global maps of time-averaged Version 5 L4_SM surface and root zone soil moisture
for the 6-year validation period (April 2015 – March 2021). The global patterns are as expected – arid
regions such as the southwestern US, the Sahara Desert, the Arabian Peninsula, the Middle East, southern
Africa, and central Australia exhibit generally dry surface and root zone soil moisture conditions, whereas
the tropics (Amazon, central Africa, and Indonesia) and high-latitude regions show wetter conditions.
Figure 3. Time-average of Version 5 L4_SM (a) surface and (b) root zone soil moisture for April 2015 – March
2021. White shading indicates no-data-values (e.g., over the Greenland ice sheet).
13Generally, the global patterns of absolute soil moisture values are dominated by soil parameters and
climatological factors. The influence of soil texture is noticeable in the coarse-scale patterns in the Sahara
Desert, where little is in fact known about the spatial distribution of mineral soil fractions. Areas with peat
soil include, for example, the region along the southern edge of Hudson Bay and portions of Alaska. In the
land model, the soils in this region are assigned a high porosity value and show persistently wetter
conditions than seen in other areas.
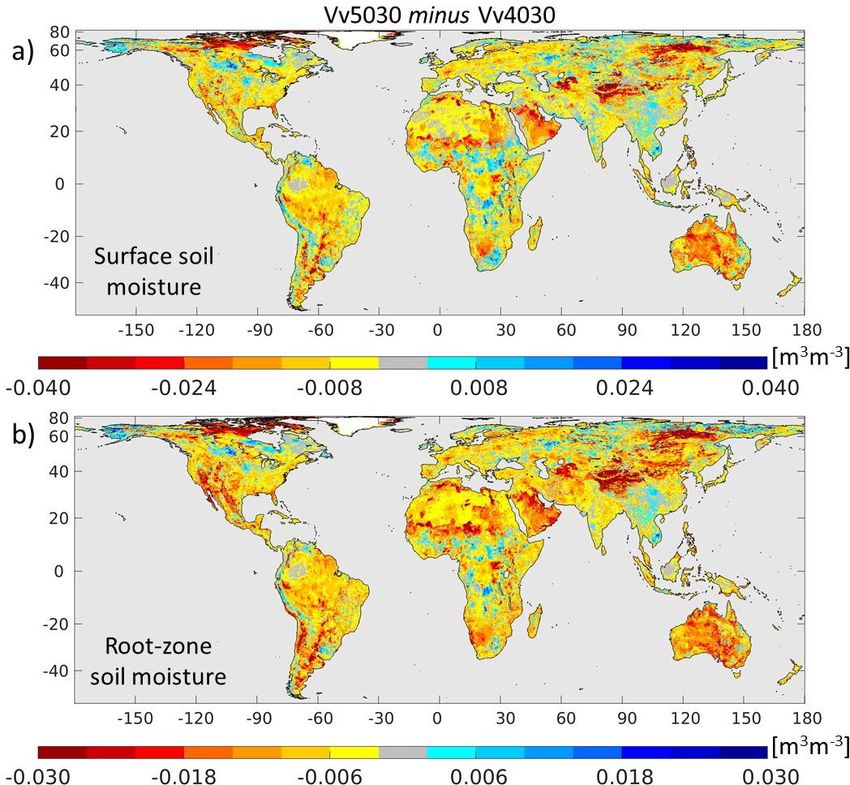
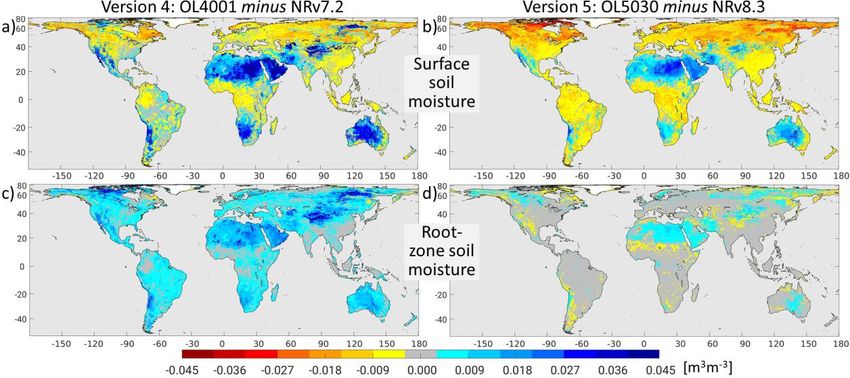
Figure 4 shows global maps of the change in time-averaged soil moisture fields between the Version
4 and 5 L4_SM products for the 4-year period April 2015 – March 2019. Generally, the long-term mean
soil moisture in Version 5 is slightly drier than in Version 4, by 0.008 m3 m-3 in the global average for both
surface and root-zone soil moisture. As will be explained in the following, these differences are the result
of a complex interplay of the changes between Versions 4 and 5, listed in section 5.3 above.
First, the revised aerodynamic roughness length formulation and the slight changes in the solar zenith
angle calculations (items 1 and 7 of section 5.3) have only a minor impact on the mean surface and root-
zone soil moisture, which can be seen in the difference between the underlying NRv8.3 and NRv7.2 model-
only simulations shown in Figure 5a,c. The curve fitting bug fix (item 2 of section 5.3) can result in larger
differences locally, but these changes are limited to a small fraction of isolated tiles and are therefore not
noticeable in Figure 5a,b.
The primary reasons for the mean soil moisture differences between the Version 4 and 5 L4_SM
products (Figure 4) are related to the perturbations used in the ensemble data assimilation system.
Specifically, spatio-temporally correlated perturbations are applied to the surface meteorological forcing
data and the Catchment model soil moisture prognostic variables such that the spread in the ensemble
simulation provides a reasonable representation of the model uncertainty (Reichle et al. 2017a).
The mean soil moisture differences between the Version 4 and 5 ensemble open loop simulations
(Figure 5b,d) very closely resemble those between the Version 4 and 5 L4_SM products (Figure 4), which
must therefore be related to the above-mentioned fixes of the PAR perturbations bug and the slightly
inconsistent ensemble averaging order (items 5 and 8 of section 5.3). This also implies that the mean soil
moisture differences between the Version 4 and 5 products are not driven by the L1C_TB and RTM
calibration changes (items 3 and 4 of section 5.3), which have at most a minor impact on the mean soil
moisture. (Section 6.5.2 below shows that the already small long-term mean soil moisture analysis
increments of Version 4 have been further reduced in magnitude in Version 5.)
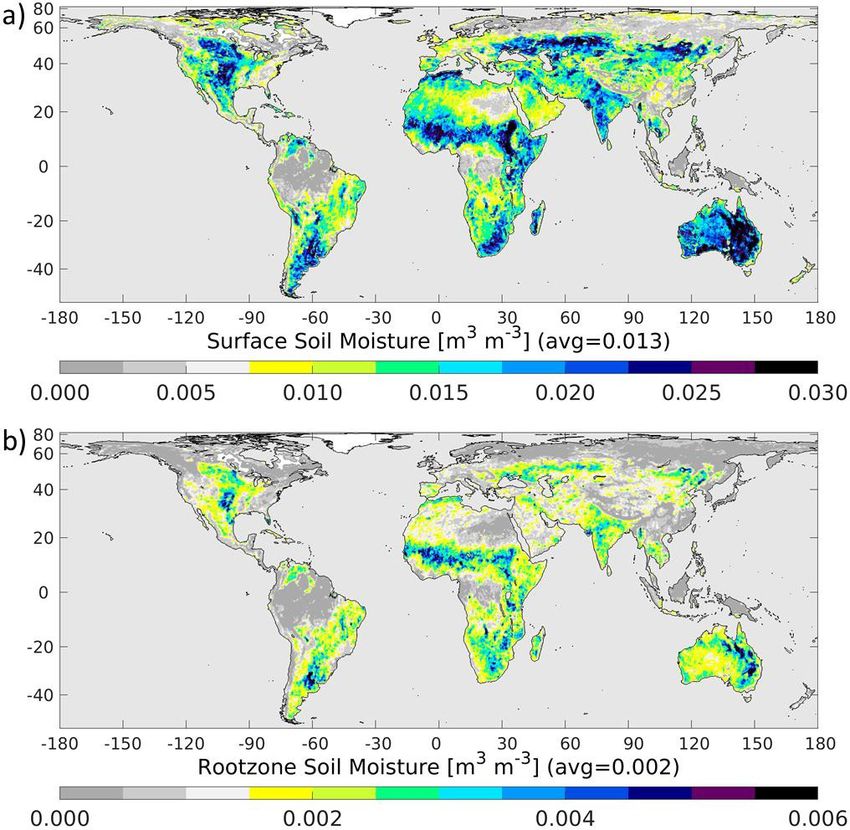
Further insights can be gained by examining the impact of the perturbations on the long-term mean
soil moisture in the modeling system. Figure 6 shows, separately for each version, the mean surface and
root-zone soil moisture differences between the ensemble open loop and unperturbed model-only
simulations (see also Table 1). As expected, in both versions the soil moisture perturbations result in
increased mean surface and root-zone soil moisture in arid and semi-arid regions, where soil moisture is
generally so dry that perturbations can often only add but not remove water. Elsewhere, however, the
perturbations have a net drying effect on surface soil moisture (Figure 6a,b). The most striking discrepancy
between Versions 4 and 5 is in the mean root-zone soil moisture differences between the ensemble open
loop and unperturbed model simulations (compare Figure 6c,d). In Version 4, the ensemble open loop root-
zone soil moisture is wetter than the unperturbed simulation across much of the globe, which is a direct
consequence of the PAR perturbations bug (item 5 of section 5.3). Fixing this bug in Version 5 brings the
mean root-zone soil moisture of the ensemble open loop much closer to that of the unperturbed simulation.
Further investigation revealed that the ensemble average of the perturbed precipitation forcing is
smaller by ~0.5% than that of the unperturbed precipitation (Figure 7a), resulting in generally drier surface
soil moisture when perturbations are used. This small precipitation deficit is caused when the standard-
normal deviates, which are generated with an ensemble mean of zero and with outliers limited to 2.5 times
the standard deviation, are nonlinearly converted into lognormal space for use in the multiplicative
precipitation perturbations. Similarly, the ensemble average of the multiplicatively perturbed downward
14shortwave radiation forcing is ~0.2% less than without perturbations (Figure 7b). Less shortwave forcing,
however, should result in reduced evapotranspiration and thus wetter surface soil moisture conditions.
Outside of arid and semi-arid regions and for the perturbation parameter settings employed in the L4_SM
algorithm, the precipitation deficiency dominates and explains the slightly drier surface soil moisture
conditions seen in the Version 5 ensemble open loop compared to the unperturbed simulation (Figure 6b).
Generally, the gap between the mean of the (multiplicatively) perturbed forcing and the unperturbed forcing
increases with increasing standard deviation of the perturbations and with tighter restrictions on outliers
(not shown). When the threshold for outliers is relaxed to 3 times the standard deviation, the nonlinear
effect becomes negligible. (Applying the threshold for outliers in lognormal space would require different
thresholds for low and high outliers, owing to the strong asymmetry of the lognormal distribution.)
Additionally, in the high latitudes and in high-elevation arid environments (including the Atacama
Desert and the Tibetan Plateau), the ensemble average of the perturbed downward longwave radiation
forcing differs by ~1-5 W m-2 from that of the unperturbed simulation (Figure 7c). This discrepancy is
caused by an air temperature-radiation consistency check that is applied to the (perturbed) longwave
radiation. This check is based on the Stefan-Boltzmann equation and pre-specified values for the minimum
and maximum permissible emissivities of 0.5 and 1.0, respectively. In the more extreme high-latitude and
high-elevation environments, the perturbed longwave radiation is frequently reset to fall within the
permissible range, thereby causing the discrepancy between the ensemble average of the perturbed
downward longwave radiation and its unperturbed nominal value.
The surface soil moisture difference between the ensemble open loop and the unperturbed simulation
in the Version 4 modeling system (Figure 6a) can now be understood as the superposition of the artificially
increased soil wetness caused by the PAR perturbations bug (seen in Figure 6c for root-zone soil moisture)
and the wet/dry difference pattern caused by the nonlinear effects in the perturbations algorithm (seen in
Figure 6b for the Version 5 modeling system).
Finally, Figure 8 shows the long-term soil water balance residuals for Versions 4 and 5. The water
balance residual is computed as (Sf – Si)/Δt – (P – ET – R) – ΔI, where Sf and Si are the final and initial
total soil water storage, Δt is the averaging time interval (April 2015 – March 2019), P is the mean
precipitation, ET is the mean evapotranspiration, R is the mean total runoff, and ΔI is the mean profile soil
moisture analysis increment (in flux units). As can be seen in Figure 8a, the water balance did not close in
the Version 4 L4_SM product. This lack of closure was primarily a consequence of the PAR perturbations
bug, which caused inconsistent values of the unstressed canopy resistance term and thus erroneous ET
values. This error has been fixed in the Version 5 system (Figure 8b).
In summary, Figures 6 and 8 clearly show that Version 5 is more consistent than Version 4 mainly for
two reasons: (i) the ensemble average of the perturbed simulation is closer to the unperturbed simulation in
Version 5 compared to Version 4 and (ii) the water balance closure violation seen in Version 4 has been
removed in Version 5.
Because of the climatological differences in soil moisture (Figure 4), the Version 4 and Version 5
products should not be combined into a single dataset for use in applications.
The L4_SM product also includes many output fields that are not subject to formal validation
requirements. Such “research” output includes the surface meteorological forcing fields, land surface
fluxes, soil temperature and snow conditions, runoff, and error estimates (derived from the ensemble). See
Reichle et al. (2015, their section 6.1) for more discussion of the global patterns and features found in the
L4_SM product.
15Figure 4. As in Figure 3 but for Version 5 minus Version 4 and April 2015 – March 2019.
16Figure 5. Time-average soil moisture differences between the Version 5 and Version 4 modeling systems: (a,b)
surface and (c,d) root-zone soil moisture differences between (a,c) the unperturbed NRv8.3 and NRv7.2
simulations and (b,d) the OL5030 and OL4001 ensemble open loop simulations for April 2015 – March 2019.
White shading indicates no-data-values.
Figure 6. Time-average soil moisture differences between ensemble open loop and unperturbed simulations: (a,b)
surface and (c,d) root-zone soil moisture difference between (a,c) OL4001 and NRv7.2 (Version 4) and (b,d)
OL5030 and NRv8.3 (Version 5) for April 2015 – March 2019. White shading indicates no-data-values.
17Figure 7. Time-average surface meteorological forcing difference between the ensemble mean of the open loop
(OL5030) simulation and the unperturbed (NRv8.3) simulation for (a) total precipitation (b) downward shortwave
radiation, and (c) downward longwave radiation for April 2015 – March 2019. The bottom colorbar applies to
both (b) and (c). White shading indicates no-data-values.
Figure 8. Time-average soil water balance residual of the (a) Version 4 and (b) Version 5 L4_SM product for
April 2015 – March 2019. White shading indicates no-data-values. In Version 4, the water balance did not close
owing to a bug in the radiation forcing perturbations (see text for details).
186.2 Core Validation Sites
6.2.1 Method
This section provides an assessment of the L4_SM soil moisture estimates using data from SMAP core
validation sites, which provide in situ measurements of soil moisture conditions at the scale of 9 km and 33
km grid cells (Colliander et al. 2017a,b). Like the L4_SM Version 4 assessment (Reichle et al. 2018b,
2019), this report uses reference pixel data on the 33 km EASEv2 grid (defined through suitable aggregation
of the 3 km EASEv2 grid), instead of the 36 km reference pixels used in earlier assessments (Reichle et al.
2015, 2016, 2017a). Additional details about the processing of the data and the validation methodology
can be found in Reichle et al. (2015, their section 6.2.1).
The status of the core validation sites is reviewed periodically. The set of core sites that provide data
for this assessment of the L4_SM product are listed in Table 2, along with the details of the 9 km and 33
km reference pixels that are used. The list of core sites matches that of the Version 4 assessment, but there
are a couple of minor changes in the list of references pixels (Table 3). The present (Version 5) L4_SM
validation is based on a total of 48 reference pixels from 19 different core validation sites. Surface soil
moisture measurements are available for all 48 reference pixels, which include 18 reference pixels at the
33 km scale from 18 different sites and 30 reference pixels at the 9 km scale from 18 different sites. For
root zone soil moisture, measurements are available for only 19 reference pixels from 8 different core sites,
including 8 reference pixels at the 33 km scale from 8 different sites and 12 reference pixels at the 9 km
scale from 7 different sites. The 9 km reference pixels for root zone soil moisture belong to the core
validation sites of Little Washita (Oklahoma), Fort Cobb (Oklahoma), Little River (Georgia), South Fork
(Iowa), Tonzi Ranch (California), Kenaston (Saskatchewan), and TxSON (Texas). The same 7 sites plus
Yanco (Australia) provide root zone soil moisture data at the 33 km scale. This very limited set obviously
lacks the diversity to be fully representative of global conditions, but we are not aware of any other
comparable datasets.
The metrics are computed from 3-hourly data, provided at least 480 measurements, or about 2 months
of data, are available after quality control. The computation of the anomaly R value (section 4) further
requires estimates of the 6-year mean seasonal cycle, for which we required a minimum of at least 240
measurements for a given 31-day smoothing window across the 6-year validation period. This requirement
implies that the anomaly R metric is available for surface (root zone) soil moisture at only 17 (7) reference
pixels at the 33 km scale. At the 9 km scale, the anomaly R metric is available whenever the other metrics
are also available.
Table 3 also lists the depths of the deepest sensors that contribute to the in situ root zone soil moisture
measurements. The measurements from the individual sensors are vertically averaged with weights that
are proportional to the spacing of the depth of the sensors within the 0-100 cm layer depth of the L4_SM
root zone soil moisture estimates. At all reference pixels except Little River and Yanco, the deepest sensors
are at 40-50 cm depth. At Little River and Yanco, the deepest sensors are at 30 cm and 75 cm, respectively,
with Yanco’s second-deepest sensors being installed at 45 cm depth. In all cases, the deepest sensors are
therefore weighted most strongly in the computation of the vertical average. To compute the vertically
averaged root zone soil moisture at a given time from a given sensor profile, all sensors within the profile
must provide measurements that pass the automated quality control.
19Table 2. Soil moisture core validation sites used in the present assessment.
Number of 9-km (33-km)
Reference Pixels
Root-zone
Climate Surface Soil Soil
Site Name Country Regime Land Cover Moisture Moisture Reference
Sanchez et al. 2012; Gonzalez-
REMEDHUS Spain Temperate Croplands 2 (1) - (-)
Zamora et al. 2015
Reynolds
USA (Idaho) Arid Grasslands 2 (1) - (-) Seyfried et al. 2001
Creek
Australia (New Cropland /
Yanco Arid 2 (1) - (1) Panciera et al. 2014
South Wales) natural mosaic
Canada
Carman Cold Croplands 1 (1) - (-) McNairn et al. 2015
(Manitoba)
Ngari Tibet Cold Barren / sparse - (1) - (-) Wen et al. 2014
Walnut
USA (Arizona) Arid Shrub open 3 (1) - (-) Keefer et al. 2008
Gulch
Little USA
Temperate Grasslands 3 (1) 2 (1) Cosh et al. 2006
Washita (Oklahoma)
USA
Fort Cobb Temperate Grasslands 2 (1) 2 (1) Cosh et al. 2014
(Oklahoma)
Cropland /
Little River USA (Georgia) Temperate 1 (1) 1 (1) Bosch et al. 2007
natural mosaic
St Josephs USA (Indiana) Temperate Croplands 1 (1) - (-) Heathman et al. 2012
South Fork USA (Iowa) Cold Croplands 3 (1) 3 (1) Coopersmith et al. 2015
Monte
Argentina Temperate Croplands 1 (1) - (-) Thibeault et al. 2015
Buey
Tonzi USA Savannas Clewley et al. 2017;
Temperate 1 (1) 1 (1)
Ranch (California) woody Moghaddam et al. 2016
Canada Rowlandson et al. 2015;
Kenaston Cold Croplands 2 (1) 1 (1)
(Saskatchewan) Tetlock et al. 2019
Savannas Juglea et al. 2010; Khodayar
Valencia Spain Cold 1 (-) - (-)
woody et al. 2019
Niger Niger Arid Grassland 1 (1) - (-) Galle et al. 2018
Benin Benin Tropical Savannas 1 (1) - (-) Galle et al. 2018
TxSON USA (Texas) Temperate Grasslands 2 (1) 2 (1) Caldwell et al. 2018
Bircher et al. 2012; Jensen
HOBE Denmark Temperate Croplands 1 (1) - (-)
and Refsgaard 2018
All Sites 30 (18) 12 (8)
20Table 3. Soil moisture core validation site reference pixels used in the present assessment. The 33 km reference
pixels are shown in boldface. See Table 2 for core validation site characteristics.
Reference Pixel
Depth of
Horizont Deepest Number of Sensors Number of Sensors
Site Name Latitude Longitude al Scale Sensor (Surface Soil Moisture) (Root Zone Profiles)
(Abbreviation) ID [degree] [degree] [km] [m] Min. Mean Max. Min. Mean Max.
03013302 41.29 -5.46 33 0.05 8 12.3 15 n/a n/a n/a
REMEDHUS (RM) 03010903 41.42 -5.37 9 0.05 4 4.0 4 n/a n/a n/a
03010908 41.32 -5.27 9 0.05 4 4.0 4 n/a n/a n/a
04013302 43.19 -116.75 33 0.05 7 7.0 7 n/a n/a n/a
Reynolds Creek
04010907 43.19 -116.72 9 0.05 4 4.0 4 n/a n/a n/a
(RC)
04010910 43.09 -116.81 9 0.05 4 4.0 4 n/a n/a n/a
07013301 -34.86 146.16 33 0.75 8 19.5 23 7 14.9 23
Yanco (YC) 07010902 -34.72 146.13 9 0.05 8 8.6 9 n/a n/a n/a
07010916 -34.98 146.31 9 0.05 8 10.1 11 n/a n/a n/a
09013301 49.60 -97.98 33 0.05 8 18.0 20 n/a n/a n/a
Carman (CR)
09010906 49.67 -97.98 9 0.05 8 9.9 11 n/a n/a n/a
Ngari (NG) 12033301 32.50 79.96 33 0.05 6 6.0 6 n/a n/a n/a
16013302 31.75 -110.03 33 0.05 8 15.4 18 n/a n/a n/a
Walnut Gulch 16010906 31.72 -110.09 9 0.05 8 9.2 11 n/a n/a n/a
(WG) 16010907 31.72 -109.99 9 0.05 8 10.0 11 n/a n/a n/a
16010913 31.83 -110.90 9 0.05 6 6.0 6 n/a n/a n/a
16023302 34.86 -98.08 33 0.45 8 10.7 12 8 9.0 12
Little Washita 16020905 34.92 -98.23 9 0.05 4 4.0 4 n/a n/a n/a
(LW) 16020906 34.92 -98.14 9 0.45 4 4.0 4 4 4.0 4
16020907 34.92 -98.04 9 0.45 4 4.0 4 4 4.0 4
16033302 35.38 -98.64 33 0.45 8 10.4 11 8 9.5 11
Fort Cobb (FC) 16030911 35.38 -98.57 9 0.45 4 4.0 4 4 4.0 4
16030916 35.29 -98.48 9 0.45 4 4.0 4 4 4.0 4
16043302 31.67 -83.60 33 0.30 8 17.1 19 8 15.6 18
Little River (LR)
16040901 31.72 -83.73 9 0.30 8 8.0 8 6 6.3 8
16063302 41.39 -85.01 33 0.05 8 8.3 9 n/a n/a n/a
St Josephs (SJ)
16060907 41.45 -84.97 9 0.05 7 7.0 7 n/a n/a n/a
16073302 42.42 -93.41 33 0.50 8 17.6 19 8 12.4 16
16070909 42.42 -93.53 9 0.50 4 4.0 4 4 4.0 4
South Fork (SF)
16070910 42.42 -93.44 9 0.50 4 4.0 4 4 4.0 4
16070911 42.42 -93.35 9 0.50 4 4.0 4 4 4.0 4
19023301 -32.91 -62.51 33 0.05 8 9.9 12 n/a n/a n/a
Monte Buey (MB)
19020902 -33.01 -62.49 9 0.05 5 5.0 5 n/a n/a n/a
25013301 38.45 -120.95 33 0.40 8 13.1 20 8 14 10
Tonzi Ranch (TZ)
25010911 38.43 -120.95 9 0.40 8 15.0 26 8 18 12
27013301 51.47 -106.48 33 0.50 8 27.0 30 8 23.8 30
Kenaston (KN) 27010910 51.39 -106.51 9 0.05 8 8.0 8 n/a n/a n/a
27010911 51.39 -106.42 9 0.50 8 13.0 14 8 11.7 14
Valencia (VA) 41010906 39.57 -1.26 9 0.05 7 7.0 7 n/a n/a n/a
45013301 13.57 2.66 33 0.05 6 6.0 6 n/a n/a n/a
Niger (NI)
45010902 13.57 2.66 9 0.05 4 4.0 4 n/a n/a n/a
45023301 9.83 1.73 33 0.05 7 7.0 7 n/a n/a n/a
Benin (BN)
45020902 9.77 1.68 9 0.05 5 5.0 5 n/a n/a n/a
48013301 30.35 -98.73 33 0.50 8 28.8 29 8 23.8 24
TxSON (TX) 48010902 30.43 -98.81 9 0.50 8 9.9 10 8 8.9 10
48010911 30.28 -98.73 9 0.50 8 15.0 15 8 13.9 14
67013301 55.97 9.10 33 0.05 8 11.2 15 n/a n/a n/a
HOBE (HB)
67010901 55.97 9.10 9 0.05 5 5.0 5 n/a n/a n/a
21You can also read