Real Estate Market Data Scraping and Analysis for Financial Investments - SIGARRA U.Porto
←
→
Page content transcription
If your browser does not render page correctly, please read the page content below
FACULDADE DE E NGENHARIA DA U NIVERSIDADE DO P ORTO

Real Estate Market Data Scraping and
 Analysis for Financial Investments

                 João Manuel Azevedo Santos

      Mestrado Integrado em Engenharia Informática e Computação

          Supervisor: Pedro Gonçalo Ferreira Alves Nogueira

                          September 10, 2018
Real Estate Market Data Scraping and Analysis for
                 Financial Investments

                     João Manuel Azevedo Santos

      Mestrado Integrado em Engenharia Informática e Computação

September 10, 2018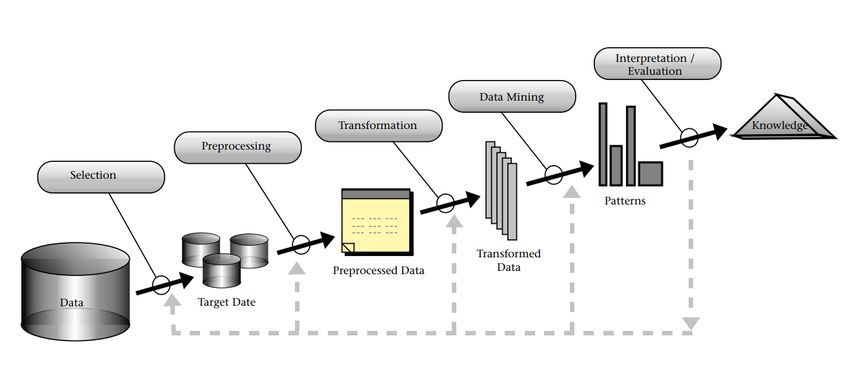
Abstract

All around the world, the real estate market attracts hundreds of millions of euros every year. De-
spite some major disruptions in the context of the financial crisis, the real estate market remains
as one of the major and most stable markets suitable for investments at various scales. Big in-
vestment groups and institutions have the knowledge and resources to gather and analyze all sorts
of information regarding this market. On the other hand, it is hard for individual investors to
make informed decisions about assets in which to invest in because of the lack of knowledge and
resources.
    The information that exists in current real estate online platforms provides low value for in-
vestors looking to make an informed decision. Often, relevant information is not disclosed and
there are no indicators of property value and its fluctuations. This lowers the possibility of success
of the individual investor. The investor is forced to perform intensive hands-on research in order to
analyze all the important details or ends up making decisions based in tendencies and/or marketing
materials. All in all, the retrieval of this information seems to be challenging because it exists in
several different locations and is presented and structured in distinct ways.
    Considering the problem at hand, this project proposes the development of a web scraper for
the selected sources of relevant data. By cleaning, storing and modeling this data in a flexible data
structure it will enable the development of an online aggregation platform for real estate market
data. On top of the normal search and listing criteria that current platforms allow for, investors
will also have access to price analysis by time, area and location. The platform shall also present
the results of a classification task that was performed by extracting relevant features from the data
gathered. The model built with these aims to predict the fluctuations of the asset’s prices.
    This solution will enable a deeper understanding of the real estate market landscape and pro-
vide a unique, centralized and insightful source of information for potential investors.

                                                  i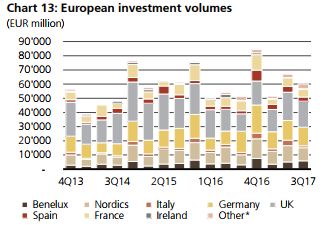
ii
Resumo

O mercado imobiliário atrai anualmente centenas de milhões de euros por todo o mundo e apesar
de algumas quebras em contexto de crises financeiras mantém-se até aos dias de hoje como um
dos maiores e mais estáveis mercados de investimento, adequado para investidores de todas as
dimensões. Os grandes grupos e instituições de investimento possuem os conhecimentos, as técni-
cas e os recursos que lhes permitem recolher e analizar todo o tipo de informação relevante neste
mercado. Por outro lado, é difícil para o investidor individual tomar decisões bem informadas
devido quer ao desconhecimento quer à inexistência de informação relevante.
    A informação existente nas plataformas online do ramo imobiliário apresenta pouco valor
para os investidores. Informação importante e relevante é frequentemente inexistente e não exis-
tem indicadores de valor das propriedades e da sua variação. Isto torna mais difícil o sucesso do
investidor, pois este é forçado a tomar as suas decisões com base em tendências e materiais de
marketing e/ou conduzir uma pesquisa, compilação e análise extensas e demoradas, de forma a
conseguir analisar todos os detalhes importantes. Analisando todos estes fatores, a recolha desta
informação apresenta diversos desafios: encontra-se dispersa em diversas plataformas com difer-
entes formas de apresentar e estruturar o seu conteúdo e podem ainda existir diversos problemas
que afetem a qualidade dos dados.
    Neste projeto, propõe-se então o desenvolvimento de web scrapers para as diversas fontes de
dados selecionadas. Após tratamento, limpeza, transformação e armazenamento desta informação
será possível construir uma plataforma que agrega todos os dados recolhidas sobre possíveis in-
vestimentos neste mercado. Para além das funcionalidades de listagem e busca que as plataformas
atuais oferecem, os investidores terão ainda acesso a análises da variação do preço por tempo, área
e localização. A plataforma disponibilizará ainda os resultados de uma tarefa de classificação que
foi realizada extraindo atributos relevantes da informação recolhida para treinar um modelo de
forma a tentar prever as flutuações de preço dos imóveis.
    A solução apresentada permitirá um aprofundamento do conhecimento sobre o mercado imo-
biliário e oferece aos investidores uma fonte de informação única, centralizada e detalhada.

                                                iii
iv
Acknowledgements

First of all, my deepest feelings of gratitude go towards my parents and sister. Without their love,
guidance, trust and support to lift me up in the bad moments I would not have been able to achieve
such good things in my life.
    I would also like to stress my great respect and appreciation for my supervisor, Professor Pedro
Gonçalo Ferreira Alves Nogueira, for his invaluable support and availability to guide me and help
me overcome the difficulties throughout the development of this dissertation.
    Thirdly, to all my friends and companions in this journey at FEUP. For all the help, guidance,
friendship and companionship and all the great moments spent together, my most sincere thanks
for everything.
    Lastly, a note of appreciation to all the authors referenced throughout this work for their com-
mitment and contributions. Standing on their "shoulders of giants" I hope to have given some
contribution myself.

João Santos

                                                 v
vi
“One man’s “magic”
      is another man’s engineering.”

                 Robert A. Heinlein

vii
viii
Contents

1   Introduction                                                                                                                                               1
    1.1 Context and motivation     .   .   .   .   .   .   .   .   .   .   .   .   .   .   .   .   .   .   .   .   .   .   .   .   .   .   .   .   .   .   .   1
    1.2 Problem description . .    .   .   .   .   .   .   .   .   .   .   .   .   .   .   .   .   .   .   .   .   .   .   .   .   .   .   .   .   .   .   .   3
    1.3 Goals . . . . . . . . .    .   .   .   .   .   .   .   .   .   .   .   .   .   .   .   .   .   .   .   .   .   .   .   .   .   .   .   .   .   .   .   3
    1.4 Document structure . .     .   .   .   .   .   .   .   .   .   .   .   .   .   .   .   .   .   .   .   .   .   .   .   .   .   .   .   .   .   .   .   3

2   Literature Review                                                                                                                                           5
    2.1 Introduction . . . . . . . . .         .   .   .   .   .   .   .   .   .   .   .   .   .   .   .   .   .   .   .   .   .   .   .   .   .   .   .   .    5
    2.2 Information retrieval . . . .          .   .   .   .   .   .   .   .   .   .   .   .   .   .   .   .   .   .   .   .   .   .   .   .   .   .   .   .    5
         2.2.1 Web scraping . . . .            .   .   .   .   .   .   .   .   .   .   .   .   .   .   .   .   .   .   .   .   .   .   .   .   .   .   .   .    6
    2.3 Real estate data analysis . .          .   .   .   .   .   .   .   .   .   .   .   .   .   .   .   .   .   .   .   .   .   .   .   .   .   .   .   .    7
         2.3.1 Knowledge discovery             .   .   .   .   .   .   .   .   .   .   .   .   .   .   .   .   .   .   .   .   .   .   .   .   .   .   .   .    8
         2.3.2 Related projects . . .          .   .   .   .   .   .   .   .   .   .   .   .   .   .   .   .   .   .   .   .   .   .   .   .   .   .   .   .   12
    2.4 Conclusions . . . . . . . . .          .   .   .   .   .   .   .   .   .   .   .   .   .   .   .   .   .   .   .   .   .   .   .   .   .   .   .   .   15

3   Scraping Application                                                                                                                                       17
    3.1 Introduction . . . . . . . .       .   .   .   .   .   .   .   .   .   .   .   .   .   .   .   .   .   .   .   .   .   .   .   .   .   .   .   .   .   17
    3.2 Data sources . . . . . . . .       .   .   .   .   .   .   .   .   .   .   .   .   .   .   .   .   .   .   .   .   .   .   .   .   .   .   .   .   .   17
    3.3 Data storage . . . . . . . .       .   .   .   .   .   .   .   .   .   .   .   .   .   .   .   .   .   .   .   .   .   .   .   .   .   .   .   .   .   18
    3.4 System architecture . . . .        .   .   .   .   .   .   .   .   .   .   .   .   .   .   .   .   .   .   .   .   .   .   .   .   .   .   .   .   .   19
    3.5 Collected data . . . . . . .       .   .   .   .   .   .   .   .   .   .   .   .   .   .   .   .   .   .   .   .   .   .   .   .   .   .   .   .   .   21
    3.6 Challenges and limitations         .   .   .   .   .   .   .   .   .   .   .   .   .   .   .   .   .   .   .   .   .   .   .   .   .   .   .   .   .   21

4   Price fluctuations classification                                                                                                                          23
    4.1 Introduction . . . . . . . . . . .             .   .   .   .   .   .   .   .   .   .   .   .   .   .   .   .   .   .   .   .   .   .   .   .   .   .   23
    4.2 Dataset description . . . . . . .              .   .   .   .   .   .   .   .   .   .   .   .   .   .   .   .   .   .   .   .   .   .   .   .   .   .   23
    4.3 Data preprocessing . . . . . . .               .   .   .   .   .   .   .   .   .   .   .   .   .   .   .   .   .   .   .   .   .   .   .   .   .   .   24
         4.3.1 Data quality . . . . . . .              .   .   .   .   .   .   .   .   .   .   .   .   .   .   .   .   .   .   .   .   .   .   .   .   .   .   24
         4.3.2 Dataset labeling . . . . .              .   .   .   .   .   .   .   .   .   .   .   .   .   .   .   .   .   .   .   .   .   .   .   .   .   .   25
         4.3.3 Clustering . . . . . . . .              .   .   .   .   .   .   .   .   .   .   .   .   .   .   .   .   .   .   .   .   .   .   .   .   .   .   26
         4.3.4 Feature engineering . . .               .   .   .   .   .   .   .   .   .   .   .   .   .   .   .   .   .   .   .   .   .   .   .   .   .   .   28
    4.4 Classification . . . . . . . . . .             .   .   .   .   .   .   .   .   .   .   .   .   .   .   .   .   .   .   .   .   .   .   .   .   .   .   29
         4.4.1 Results and experiments                 .   .   .   .   .   .   .   .   .   .   .   .   .   .   .   .   .   .   .   .   .   .   .   .   .   .   30
    4.5 Conclusions and limitations . . .              .   .   .   .   .   .   .   .   .   .   .   .   .   .   .   .   .   .   .   .   .   .   .   .   .   .   31

5   Web platform                                                                                                                                               33
    5.1 Introduction . . . . . . . . . . . . . . . . . . . . . . . . . . . . . . . . . . . . .                                                                 33
    5.2 Technologies . . . . . . . . . . . . . . . . . . . . . . . . . . . . . . . . . . . .                                                                   33

                                                               ix
CONTENTS
5.2.1 Front-end . . . . . . . . . . . . . . . . . . . . . . . . . . . . . . . . . . 33
5.2.2 Back-end . . . . . . . . . . . . . . . . . . . . . . . . . . . . . . . . . . 34
5.3 System architecture . . . . . . . . . . . . . . . . . . . . . . . . . . . . . . . . . 34
5.4 Views . . . . . . . . . . . . . . . . . . . . . . . . . . . . . . . . . . . . . . . . 36
5.4.1 Search view . . . . . . . . . . . . . . . . . . . . . . . . . . . . . . . . . 36
5.4.2 Results view . . . . . . . . . . . . . . . . . . . . . . . . . . . . . . . . 36
5.4.3 Price analysis view . . . . . . . . . . . . . . . . . . . . . . . . . . . . . 38
5.5 Deployment . . . . . . . . . . . . . . . . . . . . . . . . . . . . . . . . . . . . . 38
5.6 Limitations and future work . . . . . . . . . . . . . . . . . . . . . . . . . . . . 39
6 Conclusions and Future Work 41
6.1 Contributions . . . . . . . . . . . . . . . . . . . . . . . . . . . . . . . . . . . . 41
6.2 Future Work . . . . . . . . . . . . . . . . . . . . . . . . . . . . . . . . . . . . . 41
References 43
A Classification 45
A.1 Exploratory findings . . . . . . . . . . . . . . . . . . . . . . . . . . . . . . . . 45
xList of Figures
1.1 European investment volumes . . . . . . . . . . . . . . . . . . . . . . . . . . . 2
1.2 Main motivations for investing in real estate in Europe, 2017 . . . . . . . . . . . 2
2.1 Information Retrieval System Overview. [Cho10] . . . . . . . . . . . . . . . . . 6
2.2 The five stages of KDD. [FPSS96] . . . . . . . . . . . . . . . . . . . . . . . . . 10
2.3 Phases of the CRISP-DM process. [WH00] . . . . . . . . . . . . . . . . . . . . 12
2.4 Clustering results dendrogram. [HV11] . . . . . . . . . . . . . . . . . . . . . . 13
2.5 Visual aided real estate exploration platform . . . . . . . . . . . . . . . . . . . . 15
3.1 Scraping application architecture diagram . . . . . . . . . . . . . . . . . . . . . 20
4.1 Classes’ distribution . . . . . . . . . . . . . . . . . . . . . . . . . . . . . . . . . 26
4.2 DBSCAN results . . . . . . . . . . . . . . . . . . . . . . . . . . . . . . . . . . 27
4.3 Elbow curve . . . . . . . . . . . . . . . . . . . . . . . . . . . . . . . . . . . . . 27
4.4 K-MEANS results . . . . . . . . . . . . . . . . . . . . . . . . . . . . . . . . . . 28
5.1 Web platform architecture diagram . . . . . . . . . . . . . . . . . . . . . . . . . 35
5.2 Basic search view . . . . . . . . . . . . . . . . . . . . . . . . . . . . . . . . . . 36
5.3 Advanced search view . . . . . . . . . . . . . . . . . . . . . . . . . . . . . . . 37
5.4 Listing view . . . . . . . . . . . . . . . . . . . . . . . . . . . . . . . . . . . . . 37
5.5 Pagination view . . . . . . . . . . . . . . . . . . . . . . . . . . . . . . . . . . . 38
A.1 Frequency table of Type attribute . . . . . . . . . . . . . . . . . . . . . . . . . . 45
A.2 Frequency table of Purpose attribute . . . . . . . . . . . . . . . . . . . . . . . . 45
A.3 Frequency table 1 of Parish attribute . . . . . . . . . . . . . . . . . . . . . . . . 46
A.4 Frequency table 2 of Parish attribute . . . . . . . . . . . . . . . . . . . . . . . . 46
A.5 Frequency table of District attribute . . . . . . . . . . . . . . . . . . . . . . . . 47
A.6 Frequency table of Municipality attribute . . . . . . . . . . . . . . . . . . . . . 47
xiLIST OF FIGURES
xiiList of Tables
2.1 KDD processes correspondence summary . . . . . . . . . . . . . . . . . . . . . 12
3.1 Absense of desired data from the explored real estate platforms . . . . . . . . . . 18
3.2 Advertisements storage model . . . . . . . . . . . . . . . . . . . . . . . . . . . 19
3.3 Collected data amounts and distribution by platform . . . . . . . . . . . . . . . . 21
4.1 Exploratory findings on extracted dataset . . . . . . . . . . . . . . . . . . . . . . 24
4.2 Description of the labeled dataset . . . . . . . . . . . . . . . . . . . . . . . . . . 26
4.3 Predictive attributes . . . . . . . . . . . . . . . . . . . . . . . . . . . . . . . . . 29
4.4 Confusion matrix for experiment 1 . . . . . . . . . . . . . . . . . . . . . . . . . 30
4.5 Confusion matrix for experiment 2 . . . . . . . . . . . . . . . . . . . . . . . . . 31
5.1 Advertisement endpoint description . . . . . . . . . . . . . . . . . . . . . . . . 34
5.2 Advertisements endpoint description . . . . . . . . . . . . . . . . . . . . . . . . 35
5.3 Advertisements’ query parameters . . . . . . . . . . . . . . . . . . . . . . . . . 35
xiiiLIST OF TABLES
xivAbbreviations
ANN Artificial Neural Network
API Application Programming Interface
DBSCAN Density-Based Spatial Clustering of Applications With Noise
DM Data Mining
DOM Document Object Model
HTTP Hypertext Transfer Protocol
IP Internet Protocol
KDD Knowledge Discovery from Data
MVC Model View Controller
NPM Node Package Manager
OPAC Online Public Access Catalogues
UI User Interface
WWW World Wide Web
xvChapter 1
Introduction
In 2017, more than twenty thousand million euros were invested in the real estate market. Despite
some occasional disruptions, this market has maintained itself throughout the years as one of the
most solid and well established investment markets.
Current web platforms for real estate, advertise the selling and renting of real estate assets and
provide the means for searching and listing different categories but fail to provide investors with
essential historical data and overviews of price analysis and variation.
By providing all these features in a single centralized aggregating platform, investors and even
regular buyers will have a valuable tool to help them better decide where and how to invest their
money.
1.1 Context and motivation
Throughout the years the real estate market has presented many investment opportunities for in-
vestors at various levels all around the world. The European real estate market alone attracts
hundreds of millions of euros every year. As shown in Figure 1.1 total investment volumes since
2013 have maintained relatively high and consistent levels of investment. This is despite some
years presenting much better results than others, which may be linked to economic prosperity or
stagnation.
According to the most recent reports, despite some challenges such as the lack of income
growth, it appears that this market remains as one of the most active, and a steady growth is
expected particularly in Europe and Japan. This supports the statement that real estate is still, very
much in demand. Investors and buyers want to make informed decisions regarding their financial
investments. The main reasons that they present for investing in real estate can be divided in
two different categories: financial and social. On the first, they look for ways to maximize their
earnings by investing in properties with high value in terms of current and future profitability. On
the latter, investors are mainly interested in stable and peaceful political and social environments.
1Introduction
Figure 1.1: European investment volumes
In a survey conducted in 2017 with European investors, the researcher’s aim was to find the main
motivations for investing in real estate. Their findings are presented in Figure 1.2
Figure 1.2: Main motivations for investing in real estate in Europe, 2017
We can see that for investors, economic and financial aspects are the most valuable. They
look for attractive risk / return profiles, in well established markets with high liquidity and strong
economic fundamentals that drive growth of property and/or rent values.
2Introduction
1.2 Problem description
Current web platforms provide little information with low value on its own such as the current
price, location, typology and images. This information alone is not sufficient for investors to ana-
lyze and predict the profitability of their real estate assets as they don’t have access to the variation
of price of the asset itself or the neighbourhoods’. This data is spread throughout many different
web platforms, each with its own way of structuring and presenting the information. There might
also be problems affecting the quality of the data such as missing values, redundancies, inconsis-
tencies and noise. This data will be collected by using automated mechanisms. Even if there are
missing values around price variation a dataset can start to be built through these mechanisms.
After compiling this information we should be able to provide the investors with a centralized
and insightful way to search for and analyze their potential real estate investments.
1.3 Goals
In this project we set to develop several automatic mechanisms for collecting, updating and uni-
fying real estate data from the selected data sources. These can be images, keywords, dates, area,
typology, location, contacts, price or others. We are particularly interested in information about
the location, price, area, photos and time-stamps as these will serve as a base model with lots
of potential for extracting the knowledge we want. For this we intend to perform several price
analyses by area, location, time and other existing categories.
Another important goal of this project is the creation of a labeled dataset regarding fluctuation
of asset prices. Using the automated update mechanisms mentioned before we can track if the price
of a certain asset went up or down and use that information to perform an automated labeling task
of our dataset. The labeled dataset will be used to perform a classification task in the scope of the
current project. However, it can also have other applications and uses, and other data scientists
may use it to perform their own descriptive and predictive tasks.
Finally, we will create interactive dashboards with our price analysis and prediction results to
present this information to the investors through the means of a web platform. This platform will
provide listing and searching capabilities by different criteria and characteristics as well as the
visualization of the interactive dashboards as previously mentioned.
1.4 Document structure
Besides Chapter 1, this document contains 5 other chapters. On chapter 2, the state of the art
for our problem is described and some related works are presented. After a brief introduction ,
the main areas of interest are presented starting with web scraping as a sub field of information
retrieval. Then we focus on the more recent data analysis, data mining, visualization tools and
techniques used in the real estate market context. Finally, the main conclusions of this study
are presented in the last section. Chapter 3, describes the implemented solution for the scraping
3Introduction
application. After stating its purpose, the methodology put in practice is presented followed by an
overview of the technologies used. The system’s architecture is then presented and explained and
this chapter ends with a presentation and discussion of the main challenges faced, how they were
overcome and the limitations of the system built. Chapter 4 presents the prediction task that was
carried out with the real estate data gathered. After describing the task and technologies selected to
perform it, the dataset is thoroughly described followed by the methodology applied for labeling
it. Then, the process of preprocessing the data is described and all of its phases are presented
individually. After this we present the different experiments performed to train the models with
different algorithms and parameters. The main results and conclusions are also presented here.
The chapter ends with a brief reflection on the task’s results and how they could be improved.
Chapter 5 describes the web platform built, to search for real estate assets and visualize the results
of the analysis performed on the data retrieved. After a brief introduction the technologies used
are presented, followed by the system’s architecture, which is described in its components, front-
end and back-end. Finally the platform views are presented and the chapter ends with a brief
conclusion and discussion about the limitations of the platform. Lastly, chapter 6 presents the
global conclusions of the work developed and the future work that could benefit the solution to
provide even more value.
4Chapter 2
Literature Review
2.1 Introduction
In this chapter we will explore the state of the art on information retrieval from the web, focusing
on data scraping and the more adequate tools for performing this sort of tasks. We will also review
the most commonly used methods for real estate data analysis using data mining methods and
predictive algorithms. The visualization of this data will also be studied and explored. This has
been a fast-growing field in the last years as a result of a large availability of information, the
capability to process a lot of data and the necessity to present the knowledge extracted from raw
data to non-specialized subjects. All these will be of major importance for the development of the
proposed solution, for better understanding of the scope of the problem and for recognizing the
best tools and technologies to achieve our goals.
2.2 Information retrieval
Information retrieval from the web has been a topic of concern for researchers for a very long time.
In the era of big online platforms and communities like YouTube, Facebook and even electronic
commerce stores like Amazon, the usage of information retrieval systems is now in higher demand
than it has ever been. As we search for our favourite song, browse for an acquaintance online or
try to find the best recipe for preparing dinner we are making use of these kind of systems. As a
result, there has been a great amount of research on these topics.
In a recent research research study, the authors present the broad outline of an information
retrieval system and identify different ways to categorize different information retrieval systems.
This general overview of these systems is presented in Figure 2.1.
5Literature Review
Figure 2.1: Information Retrieval System Overview. [Cho10]
They propose a different approach to the grouping of the information retrieval systems, based
on their content, purpose and functions. In this approach four different types of information re-
trieval systems can be identified: Online Public Access Catalogues (OPAC), online databases,
digital libraries and web-based information services and web search engines [Cho10].
An important characteristic of today’s database systems is that they are web-based. Anyone
with access to a common browser can access and query these databases through simple inputs and
without the need of expertise on these topics.
2.2.1 Web scraping
The search and extraction of information from the World Wide Web (WWW) is usually performed
by web crawlers. A web crawler is a computer program or an automated script that browses the
Web in a structured and automated manner. Web scrapers are a type of Web crawler that aims to
find specific kinds of information and aggregate it for the production of new content. [KT00].
Web scraping (also called Web harvesting or Web data extraction) is a software technique
aimed at extracting information from websites [Sch12]. Web scrapers try to automate the explo-
ration process of the WWW, by either implementing the hypertext transfer protocol (HTTP) or
embedding suitable Web browsers. The data is usually gathered through screen outputs or directly
from the HTML of the page. Web scraping focuses on the transformation of unstructured data
on the Web, typically in HTML format, into structured data that can be stored and analyzed in a
central local database or spreadsheet[VU12].
6Literature Review
There are many methods to scrape information from the Web[HLA15]. Human copy-paste
is the most straightforward method, but it proves unfeasible due to the high cost of resources
especially in big projects. Another method used is text grepping, in which the programs try to
match regular expressions with the patterns they expect to find. Other techniques are HTTP pro-
gramming, DOM parsing, and HTML parsers[HLA15]. In the advent of Big Data, the potential
applications for scraped data and the benefits associated with its analysis have increased expo-
nentially. Web scraping is currently used for online price comparison, weather data monitoring,
website change detection, Web research, Web mash-up, and Web data integration. Several (com-
mercial or open-source) tools, aimed at personalizing websites by adopting scraping techniques
are currently available[VU12].
The following sections will present a brief review of the available tools and technologies which
make use of web scraping methods.
2.2.1.1 Beautiful soup
Beautiful Soup is a Python library for fetching data from HTML files. It provides a set of functions
to help programmers navigate, search and modify the DOM tree. This is open-source software.
2.2.1.2 Selenium
Selenium is a browser automation software. It is most commonly used for its automated testing
capabilities but it can also serve as a scraping tool. It allows to search and navigate through web-
pages and retrieve any content that they contain. It is also open-source software.
2.2.1.3 Screen-scraper
Screen-Scraper is a powerful tool for extracting data and information from the web. It offers a
friendly interface that eases the process of building the data patterns and creating crawling mecha-
nisms with a simple point-and-click interface. It allows the retrieval of data from all kinds of web
platforms and to export the results to a variety of formats.[HKD13].
2.3 Real estate data analysis
Real estate data analysis for investment purposes, only started to appear in real estate literature
in the late 1960s and early 1970s, even though there were already several analytic tools and tech-
niques used by economists and financial analysts. Up until then terms such as utility functions,
profitability and time value of money were nonexistent in the real estate appraisal and investment
literature. [RS70]
More recent analyses involve modern decision-theory concepts and complex financial equity
evaluation techniques. With the wide adoption of computer-based systems it is now possible to
model and explore the impact of a variety of factors on the value of assets.
7Literature Review
State-of-the-art real estate analyses approach real estate investment as a capital asset which
is able to generate its own stream of profits. Therefore, real estate can be regarded as a case
of capital budgeting. This process, consists in determining and evaluating all the future costs and
investments needed in the long-term. The cash-flows at various stages of the investment project are
estimated to determine whether the potential returns generated meet a sufficient target benchmark.
[GK03]
2.3.1 Knowledge discovery
Knowledge discovery from data (KDD), also referred to as data mining (DM) is a prominent and
fast-growing field in data science. The advent of the WWW and all of its web platforms, such as
YouTube, Facebook, internet banking, real estate searching, medical sites and many others, has
led to massive amounts of raw data being stored by private companies and government agencies
all over the world. Storing this data is very cheap considering the potential value of the data along
with the decreasing prices of storage systems and rise in their capacity. However, the the main
problem that modern data scientists are faced with is that the true value is not in the raw data
stored but in their ability to extract meaningful relations, patterns, trends and correlations in said
data. [KM06]. KDD is by nature interdisciplinary and has many different applications, such as:
• Marketing - Making use of the database marketing systems, the data stored can be used
to identify different customer groups and forecast their needs. Another very interesting
application is called market-basket analysis, which attempts to find patterns in shopping
behaviours such as if a customer bought a specific item then he is also likely to buy some
other specified item. This information is of major importance to businesses as they can
recommend and expose their customers to the products that they are more likely to buy
[FPSS96].
• Investment - Many different companies build their own data mining models for invest-
ment processes, however most don’t disclose how they are built. In a recent paper from
[CCMO14], the scientists developed a system based on neural networks for real estate price
appraisal taking into account environmental factors of the property location.
• Fraud Detection - Data mining systems have been used for monitoring credit card fraud,
watching over millions of accounts and pinpointing certain financial transactions that may
hint at the occurrence of money laundering activity. [SGW+ 95].
• Manufacturing - Data mining plays a very important role in modern manufacturing en-
gineering. It has several applications in production processes, fault detection, operations
optimization, product quality improvement, maintenance and decision support. [HSK06]
• Telecommunications - Big telecommunications companies produce a great amount of in-
formation. Data mining techniques may be applied to improve marketing effectiveness,
identify network faults and telecommunications fraud. [Wei05]
8Literature Review
Some data is already collected and made available in structured datasets, organized in tabular
format where each row represents an instance and each column represents an attribute, that are
ready to be used in knowledge discovery tasks. Platforms such as Kaggle, provide free datasets
and promote data mining competitions where data scientists are encouraged to find their own
strategies and develop their own solutions.
2.3.1.1 Most common data mining tasks
In the DM field, it is common to categorize the tasks in two different categories:
• Descriptive analytics - Summarizing and aggregating data for pattern extraction. In descrip-
tive tasks the results are obtained by directly applying an algorithm to the data.
• Predictive analytics - Extracting a model from the data to be used in predictions. By using
a set of predictive attributes, also known as features, a model is induced which labeling of
new unlabeled objects.
[Kan11], identifies in his book the main DM tasks:
• Classification - Discovering of a learning function that can classify an item into one of
different classes.
• Regression - Aims to assign a quantitative value to an unlabeled item, given the value of its
attributes.
• Clustering - A predictive task that fits items into a finite set of groups where items in the
same group are more similar among themselves than data from different groups.
• Summarization - Seeks to summarize and aggregate the data in order to obtain a more com-
pact dataset.
• Dependency Modeling - Finding relations between values of attributes and/or the predictive
attributes themselves.
• Change and deviation detection - Detecting the main modifications in the data.
2.3.1.2 The KDD process
The KDD process is defined by [FPSS96] as the process of using DM techniques for extracting
knowledge from raw data. This process is described in 5 stages:
• Selection - Consists in the identification and selection of all relevant data sources, focusing
on target samples or variables that will be used throughout the KDD process.
9Literature Review
• Preprocessing - The data gathered from the selected sources is often noisy, unstructured data
and prone to inconsistencies. Therefore, a set of operations needs to be performed to ensure
the quality of the data. This includes removing noise or outliers if appropriate, deciding on
how to properly handle missing data, and how to make use of temporal information. There
are also issues related to data types, schema, and mapping of missing and unknown values.
• Transformation - This step consists in converting the data into suitable formats for DM
algorithms.
• Data Mining - In this stage, specialized tools with specialized algorithms are used to find
patterns in the data. At the end of the DM process there should be a report of the analysis
performed so that the results can be verified and evaluated.
• Interpretation/Evaluation - This consists of the interpretation and analysis of DM process
results. This evaluation should be made in conjunction with experts and business analysts
from the specific research field, so that if the results are not good enough a new iteration of
the process can be initiated.
Figure 2.2: The five stages of KDD. [FPSS96]
2.3.1.3 The SEMMA process
The SEMMA process was developed by the SAS institute. It proposes a cycle with 5 stages that
should conduct the life cycle of a data mining project [AS08]:
• Sample - Extraction of a data sample that is big enough to contain all the significant infor-
mation and small enough that it can be analyzed and manipulated quickly.
• Explore - Exploration of the data to find unexpected patterns and/or correlations that are not
evident to the naked eye.
10Literature Review
• Modify - Modification of the data by selecting, creating and transforming the variables.
• Model - Allowing an algorithm to automatically create a model that consistently predicts a
desired outcome.
• Assess - Evaluating the usefulness, reliability and correctness of the findings.
This process offers a well detailed and organized process to develop and maintain DM projects.
It helps with finding and solving the business problems as well as implementing new business goals
[SA05].
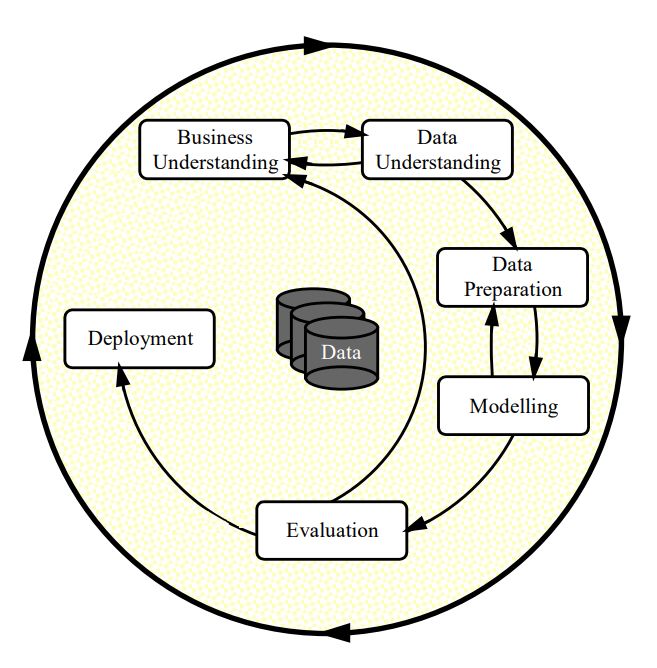
2.3.1.4 The CRISP-DM process
CRISP-DM stands for Cross-Industry Standard Process for Data Mining. It was developed by an
industry consortium to address the necessity of standardizing DM practices. It is a very complex
process and it requires specialists with proper tools. Hence, the emphasis is in properly managing
all the aspects of the project and following a sound methodology [WH00].
• Understanding the business - Focuses on defining the purposes of the project from an orga-
nizational and business perspective.
• Understanding the data - Starts with getting acquainted with the data and its intricacies while
exploring data quality issues and finding interesting sets.
• Data preparation - Consists of transforming the original dataset in the one that is going to be
fed into the modeling tool. It includes a range of operations that can be performed includ-
ing: cleaning the data, replacing missing values, normalization and aggregating attributes to
obtain new features.
• Modeling - In this step apply various modeling techniques and optimize its parameters.
Going back and forth between this phase and the data preparation is common.
• Evaluation - At this stage, a moderately high-quality model should have been obtained and
we should ensure that the followed process accurately reflects business objectives.
• Deployment - The last step is to structure, model and present the knowledge discovered to
the customer.
The sequence of steps of CRISP-DM is not a strict one, as we can understand by analyzing 2.3.
It is common for new models and results to drive other business objectives and therefore, restart
the whole cycle. This process is very well documented, studied and organized, and it allows for
an easier understanding and revising of DM projects.
11Literature Review
Figure 2.3: Phases of the CRISP-DM process. [WH00]
2.3.1.5 Summary
Although the stages on the different processes seem to have direct correspondence on the others,
the CRISP-DM process introduces the business understanding and deployment phases as intrinsic
and imperative to the DM proccess. It has been argued that KDD and SEMMA, with their Pre
KDD phase and sampling, also deal with business issues[AS08]. If they did not it would not be
possible to extract a meaningful sample. [AS08] The correspondences identified are presented in
2.1:
Table 2.1: KDD processes correspondence summary
KDD SEMMA CRISP-DM
Pre KDD ———– Business Understanding
Selection Sample
Data Understanding
Preprocesing Explore
Transformation Modify Data Preparation
Data Mining Model Modeling
Interpretation/Evaluation Assess Evaluation
Post KDD ———– Deployment
2.3.2 Related projects
The following sections present and explore some projects related to the one in hand.
12Literature Review
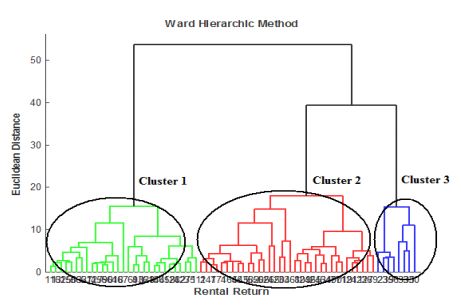
2.3.2.1 Using hierarchical clustering algorithms for the Turkish residential market
[HV11], studied the contributions of clustering methods in the assessment of real estate portfo-
lios. The study applied a set of hierarchical clustering techniques (average, centroid, complete,
median, single, ward and weighted), to a dataset containing rental return data from seventy-one
metropolitan residential areas in Turkey.
Clustering techniques are able to describe a dataset by partitioning it into groups, where the
instances belonging to the same group are more similar among themselves than data from different
groups. Hierarchical clustering is one of the most widely adopted clustering methods as it allows
for a simple and effective visual representation of the results while also allowing for general usage
since the user does not have to input parameters for the algorithm. Commonly, a tree like structure
called dendrogram is used to represent each step of the agglomerating process. By cutting the tree
at different levels clustering results are obtained. The tree obtained in this project is presented in
figure 2.4
Figure 2.4: Clustering results dendrogram. [HV11]
The results of this study support the partition of residential areas in three clusters that reveals
a significant return profile distinction in the residential areas in Turkey. This made it possible to
identify a group which was specified as the "hot" market for real estate investment, with clearly
higher return rates than others.
2.3.2.2 A Neural Network based model for real estate price estimation considering environ-
mental quality of property location
In this paper [CCMO14], the authors propose a model based on ANN, artificial neural network,
for real estate price estimation. ANNs are among the best methods for learning input-output
relationships from observable data. In a complex system like the real estate market this ability
may prove very useful to model the market’s trends and motivations.
13Literature Review
The study collected data regarding asking prices of properties in Taranto, Italy, to serve as
training data for the task of estimating the asking prices of residential assets. For this the authors
studied the impact of different variables: environmental, property intrinsic, distance to city centers
and pollution levels.
The ANN proved very efficient for the task proposed. The authors were able to create a model
with a very good correlation to both train and test results. They also performed a sensitivity
analysis in order to assess the most significant input variables. This was achieved by repeating
the ANN training phase and removing one feature at each iteration while evaluating the impact of
the removal. As a result of this analysis the variables which seem to be the most significant are
those related to the address of the asset. The addresses with proximity to industrial centers, with
the existence of a garden, balcony, or proximity to the beach were most significant. The number
of inhabitants in the area does not seem to affect property values as its removal from the dataset
resulted in no changes to the model.
This model may be used to support investment in the transportation areas, help with appraisals
and possibly even promote a positive environmental impact.
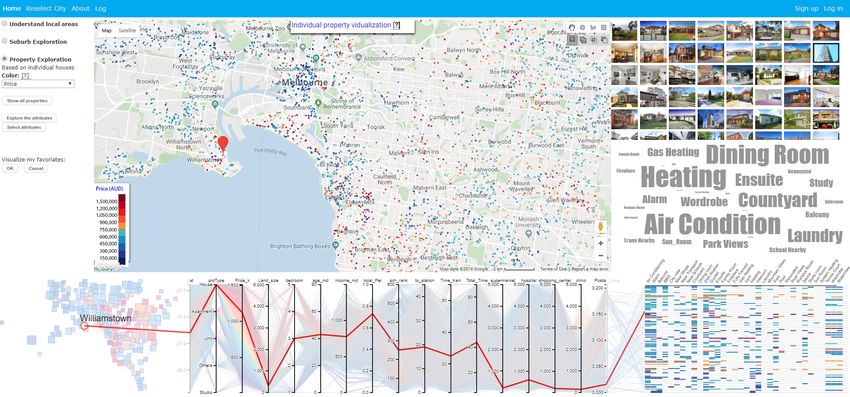
2.3.2.3 Visualization-Aided Exploration of the Real Estate Data
[LBSY16], implemented a visualization-aided system for buyers to explore the real estate data of
entire cities. Using this system for different areas it is possible to explore school and transportation
systems as well as other facilities. It also allows the user to filter by individual requirements and
make comparisons between properties/suburbs. They provide a preliminary implementation of the
system where it is possible to explore all these features.
The real estate data was collected by non-conventional channels such as crawling information
from Real Estate Australia, census statistics and transportation companies’ websites. The data
from different categories was integrated and transformed into attributes. Finally, they propose a
visualization solution with four coordinated views:
• Google map view - Maps the real estate assets with geometrical figures on a google map
view and uses visual variables and colours to provide additional information.
• Multidimensional view - The multidimensional view uses the current map view to connect
parallel coordinates with the attributes, to a geographic scatter plot and a coloured boolean
table. This view is very effective as it can model the entire map view or just the property
the mouse points at. It also allows for effective visualization of different sets of property
features.
• Image card view - Displaying images of the neighbourhood.
• World cloud view - Is a visualization technique of textual information where the importance
of each tag is reflected on the font size.
In figure 2.5 it is possible to see a preview of the platform exploring region prices in a visual
way.
14Literature Review
Figure 2.5: Visual aided real estate exploration platform
2.4 Conclusions
Having reviewed the state of the art concerning information retrieval methods, web scraping in
particular, it is concluded that this methodology appears to be effective and efficient for the pur-
poses of this project. By making use of Beautiful soup 2.2.1.1 and Selenium 2.2.1.2, it will be
possible to retrieve the contents of the target real estate platforms for storing, exploring and con-
structing our dataset. It is important to state that web scraping may be against the terms of use
of some websites and platforms. Being that in this project our interest is on the scientific issues
that concern the adoption of scraping mechanisms we do not take legal issues into account when
implementing the scrapers and Web scraping techniques.
The DM field appears to be in the prime of its existence, its applications are numerous and
in very distinct areas. In the real estate market the importance of delivering pertinent, useful and
insightful information regarding assets has led to the study of data mining applications for real
estate appraisal. This has also led to the development of more interactive and valuable visualization
techniques. Environmental factors also seem to play a major role in real estate pricing motivations
and trends, and is closely followed by the intrinsic properties of the assets. The latter, is the target
data for this project.
15Literature Review
16Chapter 3
Scraping Application
3.1 Introduction
This chapter describes the implementation of the web scraping application for collecting real estate
data. The application targets the data in eight selected web platforms for real estate advertising in
Portugal. The scope of the project is limited to data collected in the Porto district, as it is sufficient
to validate all aspects of the proposed solution. The main requirements of the system being devel-
oped are the continuous collection, storage and update of the retrieved data. The purpose is to not
only collect the available data at the moment but to build a solution which enables the monitoring
of the selected platforms. This allows the platforms to build up the data stored over time and to
detect changes in the assets’ prices.
The following sections present the main findings of the studies performed on the real estate
platforms selected, the specifications of our database and its contents, and the description and
presentation of the system’s architecture. The chapter ends with a discussion about the challenges
faced throughout the development, how they were overcome and the main limitations of the built
system.
3.2 Data sources
The first step towards planning and building the proposed application was to explore the web
platforms operating in the Portuguese real estate market. Several platforms were identified in
the first selection phase with a focus on the Porto district and its data regarding location, prices,
typologies, photos and time-stamps. Table, 3.1 portrays the absence of the desired data on the
explored platforms:
The most valuable data for the goals and tasks of our project is in the form of time-stamps,
location details, prices and typologies. As exhibited by the results, all the explored platforms
offer information about location, prices and typologies. So our selection criteria for this stage was
17Scraping Application
Table 3.1: Absense of desired data from the explored real estate platforms
Platform Imovirtual Idealista Era Remax Casas Sapo OLX CustoJusto BPIExpresso MilleniumBCP Caixa LardoceLar
Price
Photos
Timestamp X X X X
Useful area X
Terrain area X X X X
Location
Features X X X X X X X
Textual description X
Typology
Contacts X X X X
Purpose
Views X X X X X X X
Platform ID
based at first, on the availability of time-stamps and then two more platforms were included for its
abundance of data. Given these points, nine scrapers were developed for the continuous retrieval,
update and storage of the desired data on the following platforms:
• Imovirtual - https://www.imovirtual.com
• Idealista - https://www.idealista.pt
• Casas Sapo - https://casa.sapo.pt
• OLX - https://www.olx.pt/imoveis
• CustoJusto - https://www.custojusto.pt/portugal/imobiliario
• BPI Expresso - http://bpiexpressoimobiliario.pt
• LarDoceLar - https://www.lardocelar.pt
• Remax - https://www.remax.pt
• Era - https://www.era.pt
Finally, we explored the structure and organization of the platforms. Our findings support that
we should guide our implementation by the two major tasks identified: scraping advertisement
links and scraping those links’ contents. The identification of an asset in a given platform is
achieved by means of a platform ID. Therefore, in our system the assets are identified by the
pair . If the platform does not provide an ID for an asset then we
aggregate the title, price and type of asset into a string to serve as an alternate ID.
3.3 Data storage
For storing our data we use a MongoDB database. Mongo is a NoSQL database program which
uses documents similar to JSONs to represent instances. It is a great fit for the task in hand as
it allows us to store data in a flexible structure. Mongo offers all the main features of regular
18Scraping Application
database systems and more: powerful queries, indexing, replication, load balancing, file storage,
aggregation, server-side Javascript execution, fix-sized collections and transactions. 1
After a careful analysis of the available data, a model was defined for the advertisements being
stored. It contains all the features that were considered relevant for the current project as well
as some others that may be used for further enhancing the functionality of the proposed system.
Table 3.2 presents the documents’ fields names, types and a short description.
Table 3.2: Advertisements storage model
Name Type Description
_id objectID internal mongo identifier
photos arr(string) array of photo links
price float asset’s asking value
typology string real estate nomenclature for housing assets. (T0 - TX, X stands for number of bedrooms)
usefulArea float constructed area
terrainArea float construction plus terrain area if applicable
otherCharacteristics arr(string) array of other characteristics found (construction year, condition, ...)
features arr(string) array of asset’s features (fireplace, parking spot, balcony, ...)
description string a textual description of the conditions advertised
district string asset’s district
municipality string asset’s municipality
parish string asset’s parish
platformID string platform unique identifier
views int number of visualizations of the advertisement
creationDate date timestamp of the advertisment’s creation
updateDate date timestamp of the advertisment’s last update
contact int phone number to contact the announcer
purpose enum() intention to sell ou rent
platform enum() source platform
type of asset being advertised: apartment, house, bedroom, terrain, store, warehouse, garage,
type enum()
office, building, farm or loft
link string URL of the scraped advertisement
updates arr(object) each object of the array represents a detected update and contains some data on it
object.oldPrice float asset’s price before the update
object.newPrice float asset’s price after the update
object.Timestamp date timestamp of the change detection
object.newLink string URL of the advertisement containing the updated price
3.4 System architecture
The system built follows the application design pattern known as Producer/Consumer. The main
principle is that there is one or more threads that produce some desired instance that is stored
in a queue and properly handled by one or more consumer threads. This design pattern is best
applied when the rate of production is significantly higher than the consumption. There are several
components working together for the purposes of the application. A detailed architecture diagram
is presented in figure 3.1.
• Queue - A queue is an abstract data structure that stores its contents by order of arrival.
The operations allowed in this structure are restricted to inserting elements on its tail and
1 This and more information about mongodb on the website https://www.mongodb.com/
19Scraping Application
removing from the first position. For our solution, we implement a different queue for every
platform and it serves as a communication channel for our producer and consumer threads.
• Link producer - The producer threads are responsible for retrieving advertisement links and
placing them in the corresponding queue. There is one instance per platform. It accesses a
given URL and loops through the pages of results effectively sending links to the queues.
The thread terminates after the last page of results is scraped.
• Link consumer - The consumer threads continuously access the queues and remove the
top element until both the queue is empty and the producer thread has signaled that there
are no more links. It is possible to configure the number of consumer threads desired.
Each thread sends a request to the URL removed from the queue and scrapes its contents
while structuring them in the model presented in table 3.2. This structure is then stored
as a document in our Mongo collection. This thread also manages the updates of existing
advertisements. If a already exists in our database (detection via ID) the price of the current
advertisement is checked against the one that exists in our database. If a price change is
detected a new field is added to our asset’s document: the updates field. It consists of an
array of updates where each instance contains some information related to the changes.
• Main - The main program for our solution is responsible for all the previously presented
parts working together. It takes the target platform as single argument, establishes the con-
nection to the database and launches the producing and consuming threads. When the pro-
ducer is no longer retrieving links it signals the consumers so that when the queues are
empty they no longer wait for more links and all the threads can safely terminate.
Figure 3.1: Scraping application architecture diagram
20Scraping Application
3.5 Collected data
The creation of the described scraping application enabled the collection of a wide range of ad-
vertisements from the target real estate platforms. Its continuous usage throughout the last months
also contributed to a good amount of registered price updates on our database. Table 3.3 presents
a broad view of the total amounts of scraped advertisements and their platform distribution.
Table 3.3: Collected data amounts and distribution by platform
Platform Number of assets Number of updates
Imovirtual 96993 3954
Casas Sapo 29099 2095
OLX 5625 491
CustoJusto 50183 2228
BPIExpresso 28013 1881
LarDoceLar 12804 606
Remax 3122 150
Era 11624 386
Total 237463 11791
3.6 Challenges and limitations
There were several challenges during the development of this application. Most of them were con-
nected to some active target protection against scraping and non-human usage of their platforms,
while others were related to the nature of the data being collected.
The first problem encountered was that after a number of GET requests were sent, some plat-
forms would actively block the IP address of the source. To tackle and mitigate this issue as much
as possible we developed some "anti-detection" mechanisms. A GET request contains a singular
string that allows the identification of the source operating system, application type and software
versions by network peers: the user-agent field. Using data from a web publication about user-
agent’s percentage usage, a random choice function was implemented. It chooses from a list of
the most common user agent where each element has a probability of being chosen associated to
their predominance. This technique is employed on both the Link producer and the Link consumer
whenever a GET request is sent. In-between every request sent to the platforms there is a random
waiting time between one and three seconds in both threads. Finally, when the Link producer
sends the links extracted from the current list page to the queue, there is a randomization of the
order in which they are sent, so that the access is not sequentially performed.
Another common issue was page content that would only render after some user action. This
means that the desired content is hidden on the initial render but it can be obtained through the au-
tomation of the user task needed. When faced with dynamic content we used Selenium, reviewed
in 2.2.1.2. It makes use of a web browser driver to automate actions or wait for specific elements
to load. The main usage for this was on the Remax platform where the pagination was dealt with
21Scraping Application
Javascript rather than URL parameters. Almost all platforms protect the contact information of
the advertisement’s owner. It was decided that this work-around would not be used for scraping
this data because of the overhead added. Accessing every URL scraped in this manner is an in-
tensively time consuming task and for the scope of the current project, contact information was
deemed irrelevant.
Regarding the asset’s location, most of the target platforms do not present the full address on
their advertisements. Typically, a string aggregates all the available information about the location
and there may be a Google map indicating the broader area where it is located. These strings were
matched against lists of Porto’s municipalities and parishes whenever this information was not
distinctively presented.
The performance of these enhancements can be evaluated by their ability to overcome the
difficulties in the scraping mechanisms for eight out of nine selected platforms. Regardless of
our best efforts, the Idealista platform proved able to actively block our attempts to develop auto-
mated mechanisms for accessing its pages even after the implementation of the before mentioned
enhancements.
22Chapter 4
Price fluctuations classification
4.1 Introduction
In this chapter we describe the classification task that was performed by using the data gathered
with the scraping application presented in the last chapter. This data presents an opportunity to
perform a prediction task to classify the assets’ price fluctuations. With this motivation, Rapid-
miner was chosen to serve as a software platform in which we performed our data mining tasks
and procedures. Rapidminer provides an environment with a drag and drop interface that offers
a wide range of operators for data preparation, machine learning, deep learning, text mining, and
predictive analyses. More information on Rapidminer can be found on their website 1 . Using a
NoSQL extension for the Rapidminer environment enabled us to establish a connection between
Rapidminer and our local mongo database. Then, using the Read from Mongo operator we queried
our database to obtain our data in a structured data table. With the tools and operators made avail-
able by Rapidminer we set to perform our data mining task.
The following sections begin by presenting and describing the dataset used in this DM task.
After that all the preprocessing tasks performed and their methodologies are detailed. This is fol-
lowed by the description of the predictive methods employed, the different experiments conducted
and their results discussion and evaluation. To conclude the chapter the main conclusions and
limitations of our task are briefly discussed.
4.2 Dataset description
As shown in table 3.3 our database has a lot of raw data. For the purposes of this task, some of
the model’s fields were deemed not fit. This was the case of the otherCharacteristics and features
arrays as they represent information that is hard to properly categorize and standardize. The textual
description is also not useful without some previous text mining preprocessing technique which is
1 https://rapidminer.com
23You can also read


