Kaipara District Compost Options Assessment Feasibility Study
←
→
Page content transcription
If your browser does not render page correctly, please read the page content below

Funding support from:

                                               Report Commissioned by:

Kaipara District Compost Options
Assessment Feasibility Study
Report Dated: 12th December 2020 – Version 3

                                               Independent Reporting:

                                                                             1
                                               Strategic Insight for Social Good   TM
Project Contacts
Impact Consulting                                                                      Sustainable Kaipara
Company:          Impact Consulting NZ Ltd                                             Organisation:                Sustainable Kaipara Ltd
                  www.impactconsulting.co.nz                                                                        www.sustainablekaipara.org

                                                                                       Stephanie Gibson             021 0274 2331
Josh Bruce        josh.bruce@impactconsulting.co.nz                                    Project Lead                 steph@sustainablekaipara.org
                  021 165 6305                                                                                      Director - Community lead

Report Dated: December 2020

Report Disclaimer Notes:

Evidence Based Decisions                                                                               Partnership | Community Lead Projects
We believe that the best decisions are realistic, evidence based and consider multiple                 We believe that partnership is important, that community facing projects have the
perspectives. As such, we provide independent reporting to help stakeholders make                      greatest positive impact, and that sustainability is essential for long-term community
informed decisions and give their projects and activities the best possible chance of                  benefit. As such, we work in partnership with local government, businesses and
success.                                                                                               community groups to gather relevant data to inform decisions.

Independence:                                                                                          Disclaimer:
In providing this report Impact Consulting are providing an independent assessment of the              Information, data and general assumptions used in the compilation of this report have
proposed project or activity, based on available and gathered evidence and information.                been obtained from sources believed to be reliable. Impact Consulting NZ Ltd has used this
The views of Impact Consulting and/or its consultants may or may not coincide with the                 information in good faith and makes no warranties or representations, expressed or
views of the client. In order to help the client and associated stakeholders make informed             implied, concerning the accuracy or completeness of this information. Interested parties
decisions, Impact Consulting shall not be constrained in expressing its view, but will outline         should perform their own due diligence, analysis and projections on key factors or issues,
the rationale behind the views expressed. Alongside this we commit to remaining open to                prior to acting in relation to this report.
feedback and additional information from project stakeholders, with potential to adjust
recommendations or project outcomes where deemed appropriate and well-reasoned.                        All work is done, and services rendered at the request of, and for the purposes of the client
                                                                                                       only. Neither Impact Consulting NZ Ltd nor any of its employees accepts any responsibility
                                                                                                       on any grounds whatsoever, including negligence, to any other person. While every effort
                                                                                                       is made by Impact Consulting NZ Ltd to ensure that the information, opinions and forecasts
                                                                                                       provided to the client are accurate and reliable, Impact Consulting NZ Ltd shall not be
                                                                                                       liable for any adverse consequences of the client’s decisions made in reliance of any report
                                                                                                       provided by Impact Consulting NZ Ltd.

                                                                                                                                                                                                  2
Contents
Contents ............................................................................................... 3
Executive Summary................................................................................ 4
Acknowledgements................................................................................ 7

SECTION 1
Needs Assessment ................................................................................. 9
Survey Results ..................................................................................... 20
Business and Community Organisations.................................................. 26

SECTION 2
Organic Waste Management Options Summary....................................... 30
Composting Basics ............................................................................... 33
Feedstock ........................................................................................... 34
Household Scale Organic Waste Options................................................. 36
Community Scale Organic Waste Options ............................................... 39
Case Study: Kaicycle ............................................................................. 43
Case Study: Extreme Zero Waste ........................................................... 45
Commercial Scale Options Summary ...................................................... 48
Case Study: Envirofert .......................................................................... 52

SECTION 3
Recommendations Section.................................................................... 55
Recommendations ............................................................................... 66

                                                                                                             3
Executive Summary
1     Report Context                                                                  3       Survey Results
This independent report has been compiled by Impact Consulting on behalf of           Two online surveys were undertaken. One focussed on households with 268
Sustainable Kaipara, with funding support from the Ministry for Environment.          responses and one focused on businesses, schools and community groups
The report outlines our assessment of the best fit hot compost options for the        with 77 responses.
Kaipara Region based on available information.
                                                                                      Survey results showed that:
The report is broken into three sections:                                                 • 34% of households and 38% of businesses / community
    1. Needs Assessment                                                                       organisations currently bin some, or all, of their food waste with
    2. Options Assessment                                                                     their rubbish.
    3. Recommendations                                                                             o 45% of respondents would use a free weekly food waste
                                                                                                       collection service.
2     Regional Context                                                                             o 45% of respondents would be willing to pay for weekly food
The Kaipara region features a geographically disbursed population of 24,100                            waste collection.
people. The two main urban centres in Dargaville (5,027 people) on the West                        o An additional 25% would prefer to drop off their food waste.
Coast and the rapidly growing area of Mangawhai and surrounds (5,548) on the                       o 39% of businesses and community organisations would be
East Coast.                                                                                            willing to pay for weekly food waste collection.
Currently rubbish and recycling are collected via bags on a user pays basis. There
is no organics or food waste collection and limited options for green waste               •    73% of households and 38% of businesses / community
disposal.                                                                                      organisations currently compost their green waste.

There are currently two council waste transfer stations within the Kaipara
District. All landfills are now closed, with waste transported around 60km north      4       Options Summary
to the Northland Regional Landfill (Puwera), in the Whangarei District.               There are a wide range of possible hot composting options. Ranging from
                                                                                      localised community composting boxes, through to large in-vessel
The January 2020 Kaipara District waste audit indicated that by weight, 41% of        composting systems and larger scale commercial scale windrow operations.
household refuse was organic and food waste. Making it over 2.5 times heavier
than the next largest waste stream. By volume organic and food waste accounts         There are also a range of approaches to composting process. The main ones
for around 6% of current household refuse.                                            being 1) aerobic composting, which is turned or oxygenated via forced
                                                                                      aeration and 2) fermentative anaerobic composting, which is inoculated with
It is estimated that organic material and food waste currently going to landfill in   beneficial anaerobic microbes, effectively creating a scaled up bokashi type
the Kaipara District, equates to approximately 1,165 tonnes per year. This is
                                                                                      system.
based on one rubbish bag per household per week and excludes self-haul waste.

                                                                                                                                                                 4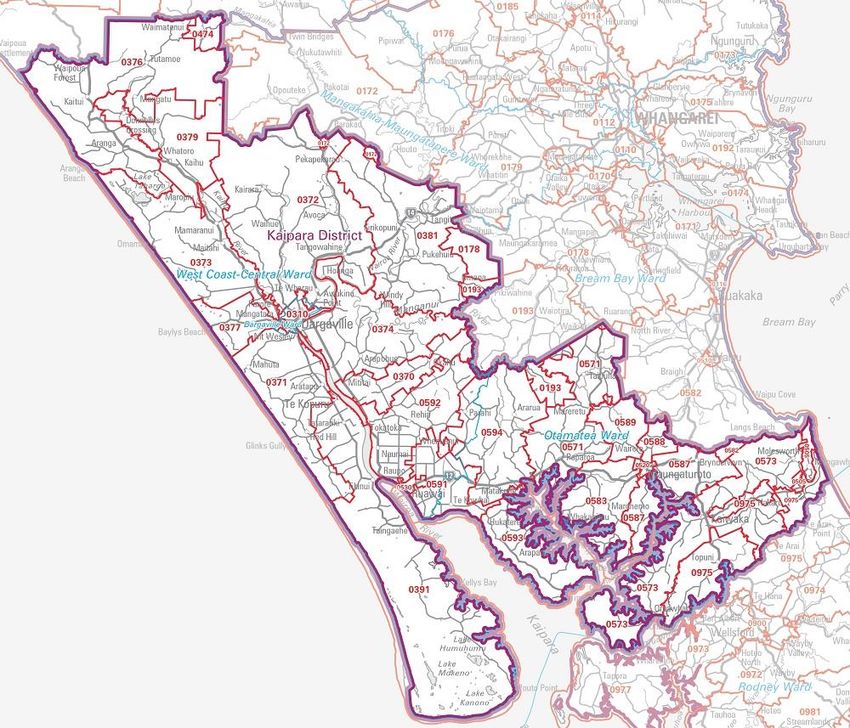
5          Recommendations
In terms of environmental impact, removing food waste from landfill is one                •    Even with proposed landfill Waste Disposal Levy increases over the
of the simplest things that, we as individuals and Kaipara as a region, can do                 next 4 years from $10 per tonne to $60 per tonne, there is currently
to reduce our contribution to greenhouse gas emissions.                                        insufficient financial benefit for waste contractors to setup, staff and
                                                                                               run an organics diversion system themselves, without additional
If global food waste were a country, it would be the third largest producer                    funding input or establishment support, from Council or other public
of greenhouse gasses and carbon emissions, behind China and the USA.1                          funding sources.
The number one objective of the Kaipara District Council Waste
Management and Minimisation Plan (WMMP) 2017, is to:                                5.3       Funding
            1. To reduce the quantity of recoverable material entering landfill.    There are several potential funding models for hot composting and diversion
                                                                                    of organic material from landfill. The following progression is recommended:
            With the initial target being:
            1.1 To decrease the annual quantity of waste disposed of to landfill          1. Short-term: User pay + waste minimisation grants
                from the Kaipara district to below 200kg per capita per year              2. Medium-term: Waste minimisation funding
                (equates to > 30% diversion).                                             3. Long-term: Targeted or general rate

Removing food and organic waste from rubbish bags provides the greatest
potential gains in terms of achieving the Kaipara District Council’s waste          5.4       Recommendations
minimisation objectives (a weight-based target).                                    It is our view that as far as possible, localised solutions which limit
                                                                                    transportation, employ local people, and produce high quality outputs should
5.1        Implications for current system                                          be prioritised. This includes encouraging home-based solutions first and
Indications are that removal of food wate from household refuse would               foremost.
result in a 41% decrease in refuse to landfill by weight and 6% by volume.          The following recommendations made based on our assessment of the best
This means that households would theoretically buy 6% less rubbish bags.
                                                                                    fit hot compost options for the Kaipara Region.
This is anticipated to have minimal impact on the viability of current services,
with the worst case being the need for a $0.19c increase in bag price (6%).               1. HOME: Community Education
                                                                                             It is recommended that Kaipara District Council tag some waste
5.2        Financial Incentive for Diversion                                                 minimisation funding for home composting education, encouraging
       •    There is currently very minimal financial incentive for households to            home-based food waste solutions such as bokashi, worm farming
            divert their organic and green waste from landfill.                              and home composting. Recommended allowance: $15K per year.

1   Love Food Hate Waste

                                                                                                                                                                      5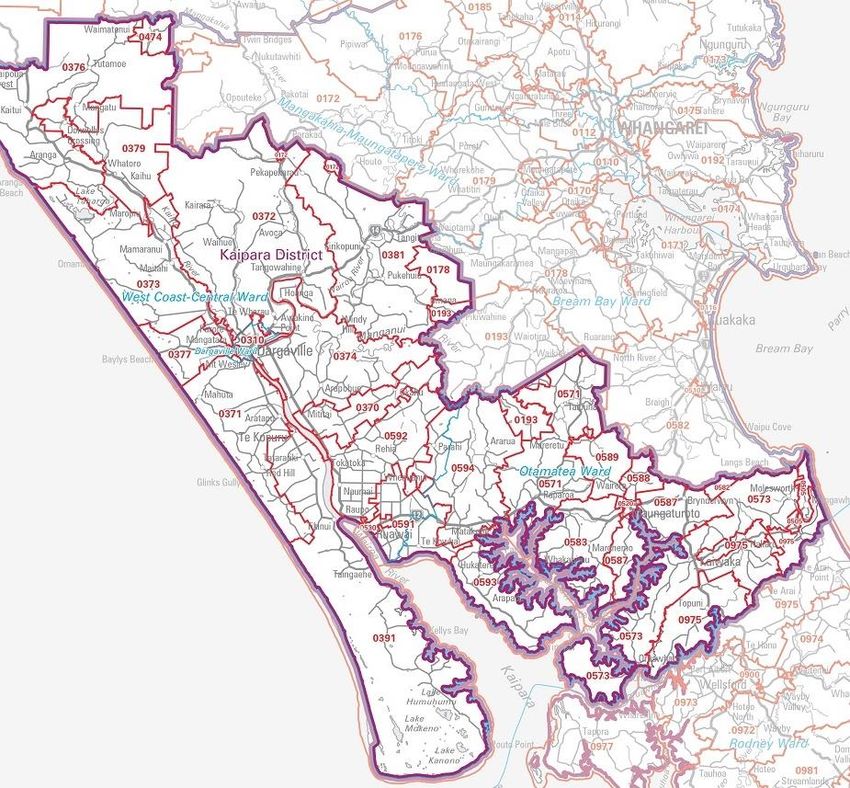
2. LOCAL: Community Composting                                                4. OTHER: Sewage Sludge
   It is recommended that community hot composting initiatives are               While not investigated in detail within this report, it is understood
   supported at schools, marae and community gardens. These                      that Kaipara wastewater treatment sludge is currently transported
   activities are localised, minimise waste transport and have a huge            to landfill. It is recommended that a HotRot system could be
   range of community building and educational benefits. Education of            investigated in more detail for the processing of wastewater
   volunteers and effective ongoing management / support for these               treatment sludge for the region (as is used in Palmerston North).
   systems is important to get the best results. As such is it                   With increasing landfill costs, ability to process wastewater sludge
   recommended that an annual site management / support                          may enhance the viability of a composting system. While pasteurised
   contribution is funded by the Kaipara District Council, with the              within the system, consideration would need to be given to end
   collection and composting activities locally funded by service users,         product use and the potential for higher heavy metal content.
   or via other funding sources, or run by volunteers.

    Recommended allowance: $2,750 annual grant per community
    composting site, with an initial objective of x10 sites regionally.

    It is recommended that this funding is maintained for each new site,
    for a minimum of x3 years to enable them to get established, with
    consideration of longer-term support based on results.

3. REGIONAL: Larger Scale Composting
   It is recommended that a Horizontal Composting Unit and/or a HotRot
   in vessel composting system are investigated in more detail and
   business case prepared, as potential future solutions for the Kaipara
   District. Depending transport logistics and site suitability, the
   composting hub/s may be located at waste transfer stations in the
   Dargaville and/or Mangawhai areas. Consideration should be given to
   the comparative advantage of having two sites, given the potential for
   staff to also run other transfer station activities, verses a single hub
   and with increased transport costs and environmental impact.
   Projected population growth should also be considered.

                                                                                                                                                    6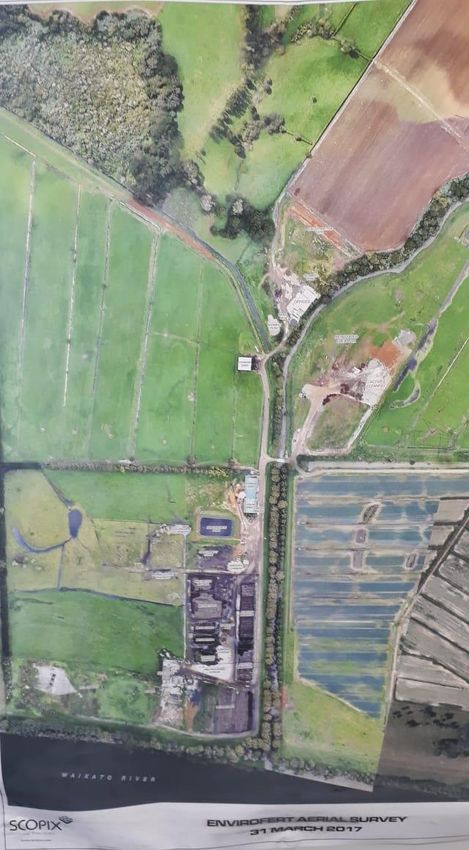
Acknowledgements                                                               KAIPARA
                                                                               Stephanie Gibson - Sustainable Kaipara Compost Project Co-ordinator
THANKS TO:                                                                     Sarah Bray - Sustainable Kaipara
Impact Consulting would like to thank Sustainable Kaipara and the following    Kate Matheson - Sustainable Kaipara
organisations and individuals for their time and input into our research for   Donna Powell - Kaipara District Council Solid Waste Manager
this project. We hope it will prove to be a valuable resource.                 Victoria del la Varis-Woodcock - Kaipara District Councillor & Love Kaipara
                                                                               Rob Battcher - Kaipara Refuse
Please note that while care has been taken in research, reporting and
                                                                               Kaipara Residents and Businesses - x345 Survey Respondents
subsequent recommendations, this is an independent report and as such has
not had direct input from the organisations listed. It therefore cannot be
considered to represent the views of the Kaipara District Council or any of    OTHER NORTHLAND ORGANISATIONS
the individuals or organisations acknowledged or referenced.                   Trish Allen - Mangawhai Waste Busters
                                                                               Susan Karels - Northland Eviroschools Co-ordinator
                                                                               Andrew Sclater - Northland Waste

                                                                               CONVERSATIONS WITH COMPOSTERS
                                                                               Paul McGuire - Envirofert
                                                                               Kate Walmsley - Kaicycle
                                                                               Jess Barnes - Hampshire Urban Farm
                                                                               Shannon Gormley - We Compost
                                                                               Tim Bowater - OMG Auckland
                                                                               Richard Wallis, Tim Bowater, Teresa Marinovich - The CarbonCycle Company
                                                                               Rick Thorpe and Liz Stanway - Raglan Extreme Zero Waste
                                                                               Ben Bushell - Community Compost
                                                                               Prashanti Lovegrove - The Compost Co. Waiheke Resources Trust

                                                                               OTHER CONVERSATIONS
                                                                               Owen Embling - Convex Plastics (including compostable packaging)
                                                                               Robert Murray – BioGro (organic certification)

                                                                               Efforts were made to meet with additional Kaipara District Council and Northland
                                                                               Regional Council Staff and councillors. However, these were not possible, due to
                                                                               Auckland Covid-19 lockdown and resulting travel schedule changes.

                                                                                                                                                             7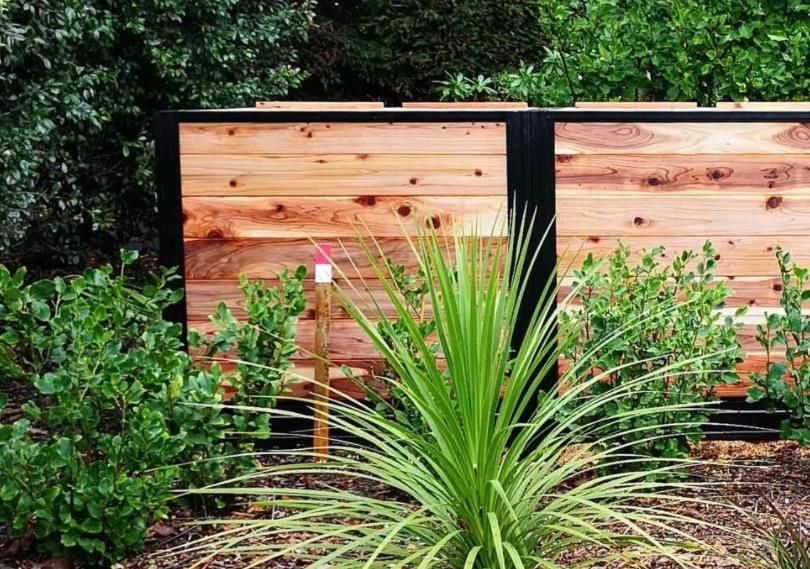
SECTION 1
   NEEDS
ASSESSMENT

                8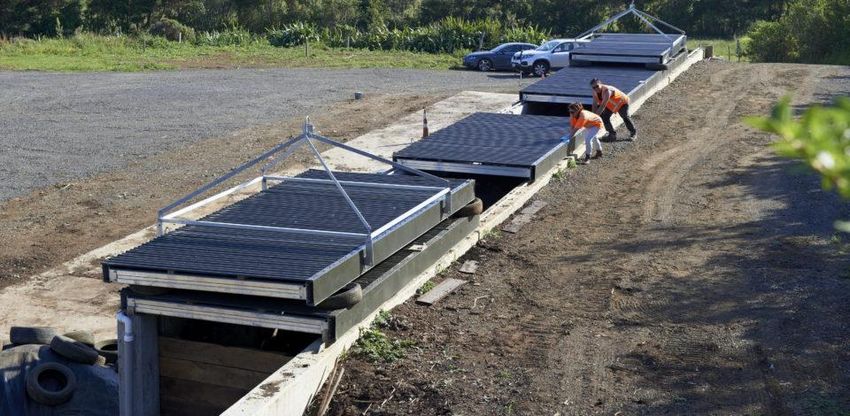
Needs Assessment
6          Context and Regional Overview
The Kaipara District is located within Northland and sits between three other
territorial authorities, namely the Far North District and Whangarei Districts
to the north and Auckland City to the south.

Kaipara is a geographically extensive district, centred around the northern
reaches of the Kaipara Harbour (the largest harbour in the southern
hemisphere)2 . The District effectively span the entire northern freshwater
catchment of the Kaipara Harbour on the west coast, plus the catchment of
the Mangawhai Harbour on the east coast.

Area:                   3,117 km2
Main Centres:           Dargaville (pop. 5,000), Mangawhai (pop. 5,500 and growing)
Population:             24,100
Households:             9,962
Ethnicities:            83.3% Pākehā, 24.6% Māori, 8.3% other.
Landscape:              The Kaipara District has large areas of fertile land. Many
                        areas are very low-lying, with an extensive tidal river
                        network, and would be considered at risk of sea-level rise1 .
                        It is also a relatively hilly region with all main townships
                        geographically separated by hills.
Road Network: The Kaipara District has 1,572km of local roads of which 71%
              (or 1,119kms) are unsealed and 450kms which are sealed.
              Given its small population and the large geographic extent
              of the district, Kaipara finds it challenging to fund the
              maintenance and upgrading of this extensive roading
              network1 .
Industries:             The regional economy is founded on primary industries,
                        particularly dairy, and supported by manufacturing 1 .

2   Kaipara, Place, People and Key Trends - Kaipara District Environmental Scan 2019

                                                                                        9
7          Regional Population Growth Projections
Infometrics Population Projections Report Summary 3

Historically, most of Kaipara’s population growth has taken place in the       growth in the Dargaville urban area predominantly takes place in the Kaipara
Mangawhai area. This pattern is expected to continue in future, particularly   Coastal and Maungaru areas.
as further improvements to State Highway 1 reduce travel times into            Population in Ruawai-Matakohe and Otamatea areas is expected to ease
Auckland, thus improving the attractiveness of Mangawhai for commuting         slightly. Despite a slight decline in population, the number of households is
workers. The Mangawhai area is projected to more than double in                still expected to increase in these areas due to decreasing household sizes.
population by 2051.
                                                                               In 2019 there were an estimated 2.37 people per household within the
The population in the Dargaville urban area is expected to continue growing    Kaipara district.
steadily, prompted by steady employment growth in Dargaville, as well as
neighbouring rural areas prompted by the Kaipara Kai initiative. Population

Figure 1 – Population Projections 4                                            Figure 2 – Kaipara District Households projections5

3   Population Projections 2018-2051 Kaipara District Council April 2020       5   Population Projections 2018-2051 Kaipara District Council April 2020
4   Population Projections 2018-2051 Kaipara District Council April 2020

                                                                                                                                                          10
Kaipara District - 2019 Population Geographic Distribution by Sub-district Areas and Projected Growth by 2051
Data source: Population Projections 2018-2051 Kaipara District Council April 2020
Dargaville 5,027 +70
Maungaru 1,890 +317
Ruawai-Matakohe 2,520 -100
Otamatea 1,785 -214
+445 Kaipara Coastal 3,796 Maungaturoto 1,318 +270
Mangawhai 5,548 +7,249
Kaiwaka 2,217 +441
86% of Kaipara’s Population Growth
over the next 30 years is projected to
be in the Mangawhai area. 118 Communities
The Kaipara District Council Parks and Open Space Plan divides the District
into six communities (Northwest Coast, Southwest Coast, Dargaville, Rural
Heartland, Harbour Communities and Mangawhai). While different from the
sub-district areas used for population projections, these are helpful when
considering geographic catchments.
Figure 3 – Kaipara District Council Parks and Open Spaces Strategy 2006 Figure 4 – Population projection sub-district areas
129 Existing Waste Management Facilities
There are currently only two council waste transfer stations for the whole of Green Waste: Orang Otang Tree Trimmers have a facility at 126 Mangawhai
the Kaipara District. These are located at Hakaru and Dargaville. North heads road. They currently only collect their own green waste. This is
Kaipara Transport also run a private transfer station at Maungaturoto. mulched on site and then sold.
Recycling: In addition, Kaipara Refuse have a sorting facility located at 9.2 Dargaville Transfer Station
Ruawai which allows for recycling drop off. The team are open to exploring Location: 199 Awakino Road, Dargaville
green waste and compost options. Management: Kaipara Refuse
Green Waste: Collected and stockpiled on site. This has been composted,
9.1 Hakaru Transfer Station mulched and bagged for resale in the past by a private
Location: 636 Kaiwaka Mangawhai Road, Hakaru company, but was not economically sustainable.
Management: Northland Waste Other: The site includes a material recovery store and recycling
Green Waste: On roadside signage, but not promoted or on price list. drop off station.
Green waste currently taken around the back of site and
mulched. Sold as mulch.
Hakaru Transfer Station Dargaville Transfer Station
13Waste Transfer Stations - Kaipara District and Surrounds
Hikurangi Transfer Station
Ngunguru Transfer Station
Ruatangata Transfer Station
Kokopu Transfer Station
Re:Sort Whangarei
Tauraroa Transfer Station
Dargaville Transfer Station
(managed by Kaipara Refuse)
Uretiti Recycling Centre
NKT Transfer Station
(Privately owned and operated
by North Kaipara Transport)
Kaipara Refuse Sorting Facility, Ruawai Hakaru Transfer Station
(allows recycling drop off only) (managed by Northland Waste)
Rustybrook Road
Community Recycling
Centre
Lawrie Road Community
Recycling Centre
1410 Travel Times
10.1 Travel times to existing waste transfer stations
When evaluating the potential for organic waste collection or drop-off, it is
relevant to consider geographic distribution and travel times. The following
table outlines travel times from the main townships and most remote
settlements, to the nearest transfer existing station.
Distance to the nearest transfer station
Settlement Nearest Transfer Station Distance Driving Time
Waipoua* Dargaville 56km 53min
Baylys Beach Dargaville 14km 14min
Dargaville Dargaville 2.6km 3min
Tangiteroria Dargaville 24km 21min
Pouto Point** Dargaville 71km 1hr 9min
Ruawai Dargaville 31km 24min
Paparoa Hakaru 31km 26min
Maungaturoto Hakaru 19km 17min
Mangawahi Hakaru 7km 7min
Kaiwaka Hakaru 7km 7min
Figure 5 * Northern-most settlement, ** Southern-most settlement
10.2 Travel Times from Main Centres Mangawhai: Historically a small township and holiday home location. However,
The following tables summarise travel times from main centres. the area now has a rapidly expanding residential population, which is projected
to more than double by 2051. When including Mangawhai heads and rural
Dargaville: The main service centre and township for the Kaipara District. properties, Mangawhai currently has a population greater than Dargaville.
Dargaville to… Distance Driving Time Mangawhai to… Distance Driving Time
Tangiteroria 24km 21min Tangiteroria 98km 1hr 15min
Ruawai 28km 20min Dargaville 87km 1hr 6min
Paparoa 49km 36min Ruawai 59km 47min
Maungaturoto 61km 45min Paparoa 38km 31min
Mangawahi 87km 1hr 6min Maungaturoto 26km 22min
Kaiwaka 77km 56min Kaiwaka 14km 14min
Other Centres Outside of the District Other Centres Outside of the District
Whangarei 56km 49min Whangarei 73km 1hr 6min
Warkworth 115km 1hr 28min Warkworth 42km 40min
Auckland Central 173km 2hrs 16min Auckland Central 99km 1hrs 26min
Figure 6 Figure 7
15Schools Rolls (as a Proxy for Population and Potential Community Compost Hubs) Each Student represents approximately x6.4 Residents
Notes: 1. Many teenagers from Mangawhai currently go to school outside of the District due to limited options. Although changing, the area traditionally has a higher proportion of retirees.
2. Approximately 26% of residents aged 5 – 19 years of age go to school outside the region or are not in school (based on student numbers vs. Statistics NZ 2018 age group Census data).
MAP KEY
Primary / Intermediate Schools
19 Secondary Schools
51 School Roll Count
(Roll is for the adjacent star as at
15 1 July 2019. Clustered schools are
34
collated into a single figure)
29
Primary: 737
Secondary: 430
TOTAL: 1,167
33
118
51 Primary: 247
Primary: 109 46 Secondary: 423
Secondary: 147 TOTAL: 670
TOTAL: 256 480
143
48
21
22
1611 Kaipara District - Household Waste Audits
The Kaipara District Council have commissioned four waste audits since 2015, Jan 2020 Kaipara Household Waste Audit Major Categories Breakdown
the latest of which was undertaken in January 2020.
These audits consistently show that putrescible (or organic waste) to be the
largest component of waste currently going to landfill across all collection
areas, accounting for 40.9% of household waste by weight in the bags
sampled during the week 20-24 January 2020. This is roughly consistent with
previous audits from different times of the year, however an increase is seen
over spring and summer. Over the four waste audit samples, putrescible
made up an average of 38% of household waste.
41%
Percentage of Organic Matter in Household Waste
of rubbish in
Audit Date Feb 2015 Jul 2017 Oct 2019 Jan 2020 bags is organic
Putrescible % 31.2% 37.60% 42.20% 40.90%
Figure 8 - Data Source: Kaipara Domestic Kerbside Collection – Waste Audits
The table below shows a breakdown of the top eight waste categories going
to landfill in January 2020. Breakdown is by collection area.
Figure 9 – Data Source: Kaipara Domestic Kerbside Collection – Waste Audit Jan 2020
Paparoa /
Waste Category Mangawhai Dargaville Maungaturoto Mangawhare Tangiteroria
/ Kaiwaka
Putrescible 47.58% 40.78% 30.53% 35.79% 37.04%
Plastic - Non
14.49% 13.64% 16.61% 17.69% 12.70%
Recyclable
Paper 10.22% 14.19% 7.89% 9.12% 19.05%
Nappies 6.81% 8.02% 11.47% 13.81% 0.00%
Glass - Recyclable 4.39% 4.11% 9.56% 6.70% 2.12%
Cardboard 3.84% 3.33% 5.38% 2.68% 2.65%
Textiles 2.82% 6.45% 5.14% 3.36% 7.93%
Potentially
2.77% 2.75% 2.45% 6.43% 3.97% Figure 10
Hazardous
Other 7.08% 6.73% 10.97% 4.42% 14.54%
Total 100% 100% 100% 100% 100% 1712 Overall Waste Volumes
The Kaipara District currently have limited available data on exact volumes of Kaipara Kerbside Waste
total waste from the region, due to the fact that a significant proportion of
Per INDIVIDUAL per Year
waste is self-hauled (around 40-50%) to transfer stations, rather than
kerbside collection. Without accurate figures for both disposal methods, it is 118kg Landfill
difficult to track overall waste trends.
A secondary factor is that due to larger shopping centres outside of the
district and lower dumping fees for some items, some residents utilise
facilities in neighbouring regions.
All landfill from the Kaipara District is currently transported to the Northland
Regional Landfill, located in Puwera 8.5km south of Whangarei. The land fill
was opened in 2009 and is owned in a 50/50 private partnership between
Northland Waste Limited and the Whangarei District Council. 48kg of this
is organic
13 Estimated Household Organic Waste to Landfill Volumes
A Jan 2020 waste audit showed that by weight 40.9% of kerbside rubbish was 40.9% of Rubbish
organic waste (or putrescible). The following estimates are based on 1 rubbish in Kaipara bags is
bag per week per household. This would equate to an estimated total of 1,165
organic material.
tonnes per annum or approximately 117kg per household per annum.
Kaipara Kerbside Waste
Households 9,962 2019 population estimates
Per HOUSEHOLD per Year
Average rubbish bag weight 5.5 kg (2020 waste audit)
Total Waste 54,791 Total kg waste per week (based on one 286kg Landfill
rubbish bag per household)
Putrescible / organic 40.9% 2020 waste audit average
Organic material to Landfill 22 Total tonnes per week
Organic material to Landfill 1,165 Total tonnes per year
Total Rubbish to Landfill 286 Kg per household per year
Organic waste to portion 117 Kg per household per year
Total Rubbish to Landfill 118 Kg per individual per year
Organic waste to portion 48 Kg per individual per year
117kg of this
is organic p.a.
1814 Estimated Household Organic Waste Going to Landfill by Area (Using School Based Population Distribution Proxy)
Estimates based on: x6.4 residents per school pupil, x1 household per 2.42 residents and x1 bag of waste per household per week with 40.9% per bag organic waste.
MAP KEY
xxx kg Kg Organic Waste to Landfill per Week
xxx tonne Tonne Organic Waste to Landfill per Year
114 kg
6 tonne
90 kg 204 kg Estimated Household Organic Waste to Landfill
5 tonne Location Kg / Week Tonnes / Year
11 tonne
Dargaville 7,004 364
174 kg Mangawhai 5,254 273
9 tonne Maungaturoto 4,021 209
Ruawai 1,537 80
7,004 kg Kaiwaka 858 45
364 tonne Te Kopuru 708 37
All Others 1,908 100
198 kg Total 21,290 kg 1,108 tonne
10 tonne
708 kg
37 tonne
1,537 kg 306 kg 4,021 kg 5,254 kg * * Note: Due to a high proportion of Mangawhai
80 tonne 276 kg 16 tonne students attending school outside the district, the
209 tonne 273 tonne
14 tonne equivalent of an additional 400 students has been
added to Mangawhai, so that the total residents
858 kg equate to the estimated 2019 population.
126 kg 45 tonne
7 tonne 288 kg
132 kg 15 tonne
7 tonne
19Survey Results
15 Methodology
Two online surveys were developed during October 2020 to assess current
practices regarding organic waste and evaluate the potential demand for
collection and composting services within the Kaipara District. These were
distributed via Facebook posts and direct emails to relevant Kaipara based
organisations and contact lists. The two surveys contained very similar
question sets, with one tailored to households and other to businesses,
schools and community organisations. Both surveys had a $100 voucher prize
draw incentive.
NOTE: While both surveys were distributed as widely as possible, due to the
nature of the survey topic, there is potential for a self-selection bias i.e.
people who are interested in composting and waste reduction are more
likely to have completed the surveys.
15.1 Household Survey
Questions: 7
Average time to complete: 3 minutes 48 seconds
Total responses: 268
Total District population: 24,1006
Assumed confidence level: 95%
Margin of error: 6%
15.2 Business and Community Organisations Survey
Questions: 10
Average time to complete: 3 minutes 46 seconds
Total responses: 77
Total Business within District: 3,4927
Assumed confidence level: 95%
Margin of error: 11%
6 Population Projections 2018-2051 Kaipara District Council April 2020 7 https://ecoprofile.infometrics.co.nz/Kaipara%2BDistrict/Businesses/Structure
200.4%
1%
1%
3%
0.4%
0.4%
19%
1% 3%
0.4%
5%
0.4%
0.7%
3%
3% 1% 12% 18%
1% 1%
3% 6%
0.7%
Household Survey Response
6%
Distribution by Respondent Postcode
2116 Estimated Food Waste Volumes by Household Size • 51% of Kaipara households are estimated to produce less than 1.5kg
Love Food Hate Waste estimate that NZ households throw away 157,389 of food waste per week.
tonnes of food a year. This equates to approximately 32kg per person per • 34% of households estimated to produce 1.5kg -2.5kg per week.
year. On this basis Kaipara would produce 318 tonne per annum, with… • 14% of household estimate to produce over 2.5kg per week.
Household Size
50.0% 44.0%
45.0%
Percentage of respondents
40.0%
35.0%
30.0%
25.0%
18.3%
20.0% 16.0%
15.0%
7.5% 8.2%
10.0%
3.7%
5.0% 0.7% 1.5%
0.0%
1 2 3 4 5 6 7 8
Number of people in the respondents household
17 Domestic Food Waste Management (259 respondents)
• 62% of survey respondents currently compost at least some of their • Of the 160 respondents who compost, 64 also used chickens, pigs or
food waste, 34% put some or all of it in the rubbish bin. worm farm and 19 of them still put some items in the bin.
Existing Household Foodwaste Management
70% 62%
60%
Compost
Percentage of respondents
50%
40% 34%
30% 24%
20%
20%
8%
10% 2% 2% 2%
0%
Compost
Compost Rubbish Bin
Rubbish Bin Chickens Worm Farm Pigs Insinkerator Bokashi or Bury Dogs
Current Food Waste Management 2218 Anticipated Uptake if Free Collection
• Responses: 262
18.1 Additional Comments
• Question: If a FREE WEEKLY food waste collection service was 53 People made additional comments in response to this question. The main
available, how likely would you be to use it? themes were existing solutions and access. Almost all comments were
supportive, for example:
• “Great idea”
• “This service was available when I lived in Raglan. It was fantastic.”
NO 66% of comments were ‘No’ due to existing solutions, such as:
(wouldn't use it) • “Love the idea so much. As we are rural would mostly continue to
All YES compost etc. at home, but know at my workplace we would use it, at
Respondents (would definitely use it) Playcentre etc. and when in town”
• “I have 2 compost bins but love this idea!”
• “But I would support my friends who do not compost to use”
• “Brilliant idea but all my scraps are hen food or home compost.”
• “Just for the meat and bones if acceptable”
MAYBE
Several were in relation to accessibility and service provision, including:
• “At the moment, where we live, even the rubbish pick up is 4ks down the
dirt road and super inconvenient- hence our chickens and pigs”
• “I live in rural Kaipara and wouldn't expect this type of service to be
NO (wouldn't use it) available to me”
• “Don’t get any rubbish collection at this point, but would love to have one”
• “Being in Te Kopuru I would assume this would not become available
here for a long time if it ever does become a thing”
MAYBE
Only those
Of respondents who currently bin a portion (or all) of their food waste,
who bin some
26% lived in Dargaville and 38% in Mangawhai and Kaiwaka areas (post
of their food
codes 0505 and 0573).
waste
(89 responses)
If offered, survey results show strong potential uptake of a free
weekly food waste collection. Especially by those who currently
YES bin a some (or all) of their food waste.
(would definitely use it) 2319 Willingness to Pay for Collection
Survey results show 45% of all respondents would be willing to pay
To gauge propensity to pay for the proposed food waste collection service
respondents were asked the following question. for collection and an additional 25% would rather drop off.
Question: What is the MOST you would PAY, if the WEEKLY food waste Most Willing to Pay for Collection (All respondents 253)
collection service was 1) provided by a not-for-profit community
40%
group 2) they washed your bucket / bin for you and 3) you could
Percentage of responses
put the service on hold when you were away? 31%
30% 25%
19.1 All Respondents 19% 20%
Respondents: 253 20%
All Question Respondents
10%
Wouldn't pay or use it 78 31% 4%
2%
Would rather drop off than pay 63 25% 0%
$3.75 per week ($15 p/m) 48 19% Wouldn't pay Would rather $3.75 per week $5 per week $7.50 per week $10 per week
or use it drop off than ($15 p/m) ($20 p/m) ($30 p/m) ($40 p/m)
$5 per week ($20 p/m) 50 20% pay
$7.50 per week ($30 p/m) 10 4% Most willing to pay for weekly collection
$10 per week ($40 p/m) 4 2%
Total 253 100%
Of those who bin food waste, 58% would be willing to pay for
19.2 Only those who currently bin a portion of their food waste collection and an additional 29% would rather drop off.
Respondents: 86
Those who bin a some (or all) their food waste Most those who bin waste are willing to Pay for
Wouldn't pay or use it 11 13%
Collection (86 responses)
Would rather drop off than pay 25 29%
40%
$3.75 per week ($15 p/m) 21 24%
Percentage of responses
29%
$5 per week ($20 p/m) 22 26% 30% 24% 26%
$7.50 per week ($30 p/m) 5 6% 20%
13%
$10 per week ($40 p/m) 2 2%
10% 6%
Total 86 100% 2%
0%
Wouldn't pay Would rather $3.75 per week $5 per week $7.50 per week $10 per week
or use it drop off than ($15 p/m) ($20 p/m) ($30 p/m) ($40 p/m)
pay
24
Most willing to pay for weekly collection20 Household Green Waste 21 Household Green Waste Volumes
Respondents: 237 Respondents: 253
Question: What do you currently do with your hedge trimmings, lawn Question: How much green waste do you estimate you produce per year?
cuttings, garden and green waste?
Estimated Number
m3
of Small Trailer or Response Count
(Assuming each load 3m 3)
Household Green Waste Management Ute Loads per Year
80% Less than 1 42 63
73% 1 42 126
70% 2 48 288
3 30 270
Percentage of respondents
60% 4 20 240
5 39 585
50%
6 1 18
40%
7 1 21
8 1 24
29%
30% 10 9 270
12 4 144
20% 15% 14% 15 2 90
20 1 60
10% 5% 27 1 81
40 1 120
0%
100 1 300
Compost it Burn it Take it to the Wood chip it N/A Don't
dump produce any Total 2,700m 3
Current management of green waste option/s selected
Based on the survey responses above, Kaipara households on average
produce around 10m3 of green waste per year. Assuming 9,962 households
• 73% of Kaipara households compost at least some of their green district wide, this equates to approximately 100,000m3 of household green
waste. waste per year.
• 15% of households take at least some of their green waste to the
dump. As respondents could select multiple options, the percentages in the green
waste graph add to 136%. However, as a proportion of total responses ‘burn
it’ and ‘take it to the dump’ represent 21% and 11% respectively. This means
as a preliminary gauge, a maximum of 32,000m3 of household green waste
could theoretically be available district wide.
25Business and Community Organisations
22 Business and Community Group Participation Summary 23 Respondents by Business or Organisation Type
Total Respondents: 77 Business and organisation types. Note: multiple selection was possible.
22.1 Distribution by postcode Industry or Sector % of respondents Count
Food - Cafe / Restaurant / Takeaway 13.9% 10
Education - Primary School 13.9% 10
Retail 9.7% 7
Agricultural / Farming / Forestry 9.7% 7
Accommodation / Tourism 8.3% 6
Coffee 6.9% 5
3% Food - Food Stall / Farmers Market 4.2% 3
Construction 4.2% 3
1% Education - Secondary School 4.2% 3
Professional or Business Services 4.2% 3
1% Wholesale / Commercial Supplies 2.8% 2
Church or Religious Entity 2.8% 2
22% Food - Supermarket / Dairy 1.4% 1
1%
Landscape / Gardening / Tree Pruning 1.4% 1
3% Fishing 1.4% 1
4%
3% Marae 1.4% 1
Medical 1.4% 1
8% Education - Early Childhood 1.4% 1
3% 10% 22% Manufacturing / Mechanical 0% 0
Transport / Logistics 0% 0
6% 3% Social Service 0% 0
Other 27.8% 20
Business and Community TOTAL 120.9% 87
Group Survey Response
Other responses included: Annual Event, Art & Craft Gallery, Coffee Roaster, we collect
Distribution by green waste, Education, Enterprise - Consultancy, Furniture, Importing ex USA, KDC,
Respondent Postcode Lifestyle block, small permaculture orchard, Local government, Museum, Non-profit
Art/Craft Gallery, Plant nursery x2, Pools and leisure, Public Library, Real Estate, Sawmill,
Veterinary Clinic.
2624 Organic Waste Types (excluding food) 26 Organic Waste Volumes (excluding food)
Respondents: 50 The following volumes are approximated based on a range of responses. The
Question: What organic or green waste does your business or only entity / respondent producing significant quantities of organic waste
organisation generate? was a sawmill, who currently burn, bury and sell their organic waste.
Waste Type Count %
Approx. volume per week Count m 3 per week
None (OR food waste only) 30 42%
None 3 0
Green Waste - Pruning, clippings, branches 23 32% Less than 1 bucket 11 0.11
Organic or Compostable Manufacturing by-product (eg. 3 4% Less than a rubbish bag 5 0.3
saw dust, brewing dregs, husks) Less than 500 ltr 3 0.75
Untreated Timber Waste 3 4% Less than a trailer 5 15
30+ m 3 1 30
Animal Manure - Stables, Calf Sheds, Woolsheds, 6 8%
Total 28 46.16m3
Chicken Manure
Other (please specify) 6 8%
Total Responses 71 100% 27 Business and Community Food Waste
‘Other’ included: Food and green waste, General office paper and fish carcases / frames, Respondents: 59
Old clothing, Paper, Paper and student lunches, takeaway cups and plates, Napkins.
Question: What food waste does your business or organisation
generate?
25 Business and Community Organic Waste Management
Respondents: 58 Type of Food Waste Produced
Question: What do you currently do with your organic, manufacturing
60% 54%
or green waste?
Percentage of Respondents
Management % Count 50%
Compost it 38% 29
40%
Take it to the dump 11% 8
Wood chip it 9% 7 30% 24%
22% 20% 20%
Burn it 9% 7
20%
Spread it on paddocks 7% 5
10% 5%
Sell it 3% 2
Burry it 1% 1 0%
None Food waste - Food waste - Coffee Grounds Compostable Seafood or
Don’t produce any 22% 17
less than 20 more than 20 Packaging meat
Total Responses 100% 76 litres per week litres per week byproduct -
shells, guts,
bones etc.
Food Waste Produced
2728 Food Waste Management 29 Propensity to Pay for Collection
Respondents: 50 To gauge propensity to pay for the proposed food waste collection service
Question: What do you currently do with your scraps, food waste and respondents were asked the following question.
compostable packaging?
Respondents: 52
Business and Community Group Food Waste Question: What is the MOST you would PAY, if the WEEKLY food waste
collection service was 1) provided by a not-for-profit community
Management group 2) they washed your bucket / bin for you and 3) you could
50% 46% put the service on hold when you were away?
Percentage of Respondents
38%
40%
Maximum businesses and community groups
28%
30%
would be willing to pay for collection
18% 56%
20% 16% 60%
Percentage of respondents
10% 50%
40%
0%
Compost it Bin with Feed to Pigs Feed to Worm Farm 30%
Rubbish Chickens 19%
20%
Waste Management 8%
10% 6% 6% 6%
Comments included: Give coffee grounds away to customers at the front door, staff take 0%
own scraps home, students take food waste home. Wouldn't Would $5 per week $10 per $15 per $20 per
pay or use it rather drop week week week
off than pay
Most willing to pay
Many businesses and organisations said they wouldn’t use a paid service
because their volume was so low. One indicated that they wouldn’t pay for
food waste but would be willing to pay up to $40 for tree pruning removal
per trailer load.
28OPTIONS
ASSESSMENT
29Organic Waste Management Options Summary Capacity:
Cost:
This is food waste capacity, not total inputs.
This is setup cost, not operational cost.
Household Scale Options
Home Compost (Cold) Bokashi Wormfarm
• Capacity: 5-7kg per week • Capacity: 12kg per week • Capacity: 14kg per week
• Cost: $46 - $140 • Cost: $100 (x2 bins) • Cost: $120 - $375
Additive approx. $15 per 100kg waste.
Community Scale Options
Community Hot Compost In-Vessel Automated (Bertha) In-Vessel Composting Turned
• Capacity: 50kg / week per box • Capacity: 3 tonne per week Horizontal Composting Unit (HCU)
3-4 tonne / year per box 156 tonne per year • Capacity: 5 tonne per week
• Cost: $750 - $2,800 per box • Cost: $150K +GST 250 tonne per year
• Cost: $200K
Easily scalable via additional boxes. Distributed Stationary concrete truck barrel type design
model means less waste miles. Greater capacity with automated turning / aeration. Food waste 12-week cycle from end to end. In process
possible via using faster anaerobic fermentative is pasteurised / brought up to temperature 3 maturation. Aerated / turned using a digger.
processes and/or separate windrow maturation. times over 7 days. Requires power supply. 3-6
months’ windrow maturation required.
Commercial Scale Options
In-Vessel Composting (Automated) Aerated Static Pile Composting Aerated (Turned) Windrow
• Capacity: 0.25 - 52 tonne/week food • Capacity: Limited by site / consents • Capacity: Limited by site / consents
• Cost: $150K (2.8 t/w unit only) and suitable feedstock and suitable feedstock
$1.5M (50t/w operational) • Example: 40,000 tonne p.a. (total) • Example: 50,000 tonne p.a. (total)
• Cost: Approx. $2M equipment, • Cost: Est. $1.5M equipment,
Variety of systems available at various scales.
plus land and consents. plus land and consents
HotRot and VCU is are common systems in NZ,
with in process maturation, producing stable
Higher operational costs than a forced aeration
compost in 12 days. Limited maturation Requires power supply. Requires leachate
management. Lower cost at smaller scale and static pile system (labour and fuel). Requires
required. Vermicomposting (or large scale worm
possible for community level, however leachate management. Lower cost30at smaller
farming) is sometimes operated as in-vessel.
generally commercial due to land required. scale, generally commercial due to land required.Community Hot Compost Boxes Bertha ( N elson) Horizontal Composting Unit (HCU)
CarbonCycle Bins
Above: Bertha Image Source Below: VCU Image Source
Above: HCU - Image Source
VCU ( Vertical composting Unit) 31GORE-TEX (Covered aerated windrow) | Tunnel HotRot Windrow (Static Aerated) / (Turned)
Gore-Tex Covered Forced Aeration Windrow (Above) (Below)
Above: Static Aerated Below: Large Turned windrow
HotRot 1206 capacity of 0.2-0.4 tonne per day
HotRot 1811 capacity of 1.8-2.5 tonne per day
Below: Small turned windrow
Enclosed Composting Tunnel
HotRot 3518 capacity of 10-15 tonne per day 32
Above: Custom In-Vessel Forced Aeration Compost Tunnel Above: HotRot SystemsComposting Basics 30.4 Oxygen Flow
Turning the pile, placing the pile on a series of pipes, or including bulking
30 Main Factors agents such as wood chips and shredded newspaper all help aerate the pile.
Producing a quality compost product relies on five main factors. Aerating the pile allows decomposition to occur without the production of
methane. Care must be taken, however, not to provide too much oxygen,
1. Feedstock and Nutrient Balance which can dry out the pile and impede the composting process.
2. Particle Size
3. Moisture Content In a fermentative anaerobic composting process oxygen and airflow is
4. Oxygen Flow (or lack of it in a fermentative process) avoided or deliberately limited, to promote the growth of the selected
5. Temperature anaerobic organism which the compost has been inoculated (sprayed) with.
30.1 Feedstock and Nutrient Balance 30.5 Temperature
Compost system inputs are often referred to as feedstock. Feedstock is made Microorganisms require a certain temperature 45-65°C range for optimal
up of a mixture of high nitrogen (green) and high carbon (brown) inputs. For activity. Certain temperatures promote rapid composting and destroy
every tonne of inputs most composting systems will produce around 500kg pathogens and weed seeds. A period of 3-4 days at temperatures greater
of compost. than 55°C are required for pasteurisation. If the temperature does not
increase, anaerobic conditions (i.e. rotting) occur. Controlling the previous
Regardless of the scale of the composting operation, being able to source four factors can bring about the proper temperature.
enough suitable feedstock of each type to create a balanced mix is a critical
Source: Adapted from US EPA
factor in determining or limiting capacity.
30.2 Particle Size / Density
Grinding, chipping, and shredding materials increases the surface area on
which microorganisms can feed. Smaller particles also produce a more
homogeneous compost mixture and improve pile insulation to help maintain
optimum temperatures. If the particles are too small, however, they might
prevent air from flowing freely through the pile.
30.3 Moisture Content
Microorganisms living in a compost pile need enough moisture to survive.
Water is the key element that helps transports substances within the
compost pile and makes the nutrients in organic material accessible to the
microbes. Optimal moisture content by weight is 40-60% (damp not wet, if
you can squeeze more than a couple of drops from a handful, it is too wet).
33Feedstock Browns – Carbon-rich
WOOD
C:N
Wood chips 400:1
31 Carbon vs. Nitrogen Sawdust 325:1
All composting systems require a mixture of Carbon rich (brown) and Ashes (wood) 25:1
Nitrogen rich (green) inputs (other than Bokashi, which can operate solely on WASTE
food waste). Cardboard 350:1 – 560:1
Newspaper 175:1
Peanut shells 35:1
While brown and green feedstocks are often respectively referred to Carbon GARDEN
(C) and Nitrogen (N), the reality is that all organic matter contains both. The Fruit waste 35:1
balance of these inputs is an important factor in producing good quality Leaves – oak 40:1 – 80:1
healthy compost. With excess carbon, decomposition slows down, with Leaves – mixed 60:1
Corn stalks 75:1
excess nitrogen, the compost will start to rot and get smelly.
Pine needles 80:1
OTHER
The targeted C:N ratio for compost feedstock is generally in the range 25-30:18 . Peatmoss 50:1
Food waste is generally in the range of 20-25:1 (C:N) meaning carbon rich Straw 75:1
inputs are also needed. These also act as bulking agents to aid with airflow, Figure 12 - Source: CarbonCycle Composting Guide 5
balance the density of the compost and help to absorb surplus moisture.
Greens – Nitrogen-rich C:N
FOOD
Carbon Nitrogen Coffee grounds 20:1
Food scraps – mixed 20:1
High carbon inputs may include: High nitrogen inputs may include:
Food scraps – vegetables 25:1
• Dry leaves • Fruit and vegetable scraps
GARDEN
• Twigs • Coffee grounds
Mixed garden cuttings (not all green) 30:1
• Torn up wet carboard • Eggshells Weeds 30:1
• Shredded paper • Garden waste Grass clippings – fresh 15:1 – 20:1
• Egg trays • Lawn clippings Grass clippings – sun dried 20:1 – 25:1
• Small branches • Seaweed Alfalfa 12:1
• Untreated saw dust OTHER
• Bark chips Seaweed 19:1
• Straw Hay from legumes 15:1 – 20:1
Hay from grass 15:1 – 32:1
• Coffee husks
Clover 23:1
• Pine needles
MANURE
Figure 11
Poultry 3:1 – 15:1 3:1 – 15:1
Cow 20:1
8 https://carboncyclecompost.com/the-carboncycle-composting-guide/ Horse 20:1- 50:1
Others 15:1 – 25:1
34Household
Scale
Options
35Household Scale Organic Waste Options
32 Household Scale Organic Waste Systems
Home based systems are the most efficient way to reduce household organic
waste going to landfill. The following table provides an overview of the main
household organic waste management systems.
System Summary Limitations Capacity and Ratio Cycle Time Cost
Worm Farm 9 Uses stacked or continuous flow Can’t take meat, dairy, citrus, bread, pasta, Bins capacity 60-90kg in total. Casings need $70 - $325 bin cost
arrangements. Produces nutrient rich cooked or processed food, spicy food, Worms can eat their own weight emptied every depending on brand
worm casting and worm tea for use in onion and garlic, acidic foods, oils or per day. Hungy Bin indicate 6 months and + $50 for 250g of
14 kg the garden. excess liquids such as soup. capacity for up to 2kg per day. drip tray as tiger worms
Per week needed.
70% green, 30% brown.
Bokashi10 Two stage anaerobic fermentation Can’t take oil or excess liquid. Need to Standard bins are 15ltr, a 140ltr 7-14 days in $49 - $79 bin cost –
system (no oxygen), using a beneficial drain liquid every 2-3 days. system is possible using modified the Bokashi x2 bins required.
microbial culture. The first stage (7-14 wheelie bins for schools, cafes Bin.
days) is in the Bokashi Bucket, the Can take all food scraps including raw or etc. Capacity limited only by bin + microbial culture
12 kg second stage occurs when buried in cooked meat, citrus, and fish and poultry size and the need for 1-2 Plus, 2-4 weeks additive $15 per kg
Per week soil or compost bin (2-4 weeks). with small bones included. tablespoons of microbial culture buried in soil (1kg is enough to
(with x2, 15ltr bins)
Produces liquid and solid compost. additive per 2ltr of feedstock. or compost process approx. 50-
Often used in conjunction with cold Alternative systems are available for bin. 100 litres of organic
compost. Bokashi are subsidised by processing pet waste. 100% green. matter)
several councils around NZ.
Cold Compost 11 Aerobic (oxygen) based Can’t take large amounts of fats or oils. In Total bin capacities generally 3-6 months for $46 - $140 bin cost
decomposition. Requires air flow, order to prevent pests most advice is to range from 220 – 430 litre. Ability the bottom
moisture and correct ratio of green to avoid meat, bread, pasta, egg, cooked or to cater for around 6-12 litres of third of the
5-7 kg brown inputs. Benefits from being processed foods. Citrus peels, onions and food waste per week. compost to be
Per week covered and in a sunny position garlic should be limited. Avoid weed mature.
directly on the soil. seedheads, diseased or infested material, 30% green, 70% brown.
or invasive plants.
Figure 13 – Food waste assumed to weigh approximately 0.75kg per litre – Reference link
9 https://compostcollective.org.nz/worm-farming/#Getting-started
10 https://www.zingbokashi.co.nz/
11 https://compostcollective.org.nz/composting-bin/#GETTING-STARTED
3633 Household Organic Waste Option Inputs
33.1 Feedstock Ratios
The following infographics from The Compost Collective 12 provide a general
overview of approximate feedstock ratios for household scale organic waste
management options.
Bokashi Worm Farm Cold Compost
Figure 14 – Feedstock Ratios – The Compost Collective 9
12 https://compostcollective.org.nz
37Community
Scale
Options
38
Image source: www.CarbonCycleCompost.comCommunity Scale Organic Waste Options
34 Community Scale Composting Systems Overview These options work well for small or distributed communities and are likely
to be most relevant for the Kaipara District. Most are modular or scalable,
For the purpose of this report, community scale composting options, have
been defined as those with capacity for up to approximately five tonne of which limits both transportation costs and associated the negative
food waste per week. environmental impacts.
1) Community based Hot Compost Boxes 2) Bertha (Community Compost Nelson) 3) HCU Composter (Extreme Zero Waste 4) HotRot
(Kaicycle, CarbonCycle etc.) Raglan, Innovative Waste Kaikoura,
Ruapehu District Council etc.)
Summary Community based hot composters are Stationary concrete truck barrel type Concrete channel with built in drainage Horizontal in-vessel system with tumbling,
generally 1.2m cubes with a total capacity design with automated turning / aeration. and air holes. Holds approx. 200m 3 of central shaft with paddles and forced
of approximately 1,700 ltr. When properly Feed once a week. Food waste is compost (30m x 3m x 2.5m). Regularly aeration. Produces stable compost within
managed the centre of these boxes reach pasteurised / brought up to temperature 3 aerated / moved over a 12-week cycle about 12 days. Limited maturation
pasteurisation temperatures of over 55C. times over 7 days. Requires power supply. from one end to the other with a digger or required. Feed systems important.
Multiple boxes with removeable sides are 3-6 months’ windrow maturation required. tractor and backhoe. Removable roof Designed to be fed via a hopper over
used to enable simple turning from one Electronic sensors to manage temperature panels to manage humidity, temperature 24hrs. Various sizes available doesn’t
box to another by hand. Produces good and turning. Motor reversed to feed and pests. In process maturation. Requires require shed. Requires power and feed
quality compost and easily scalable. compost back out. Requires power. machinery. systems.
Cost $2,800 per box13. Self-built boxes possible $150K +GST preliminary estimate from The Kaikora HCU reportedly cost $30K14 to Comet Composter - $55K
at lower cost. Functionality and pest Ben Bushell. build, the Raglan HCU reportedly cost HotRot 1206 - $145K (tipper) $225K (auto)
proofing important considerations in for $200K15 (assumed to include consents). HotRot 1811 - $405K (tipper) $550K (auto)
self-built boxes. HotRot 3518 - $1.8M
Food Waste Approx. 800kg per box. Capacity limited by 4 tonnes per week 5 tonnes per week Comet Composter, 175-260kg per week
Capacity number of boxes and speed of composting 200 tonnes per year 260 tonnes per year HotRot 1206, 1 - 1.25 tonne per week
cycle. HotRot 1811, 6.1 - 8.75 tonne per week
HotRot 3518, 35 tonne per week
Total capacity is double the figures above.
Collection E-bikes and trailers. E-bikes and trailers, plus a van. Specially designed trailer. Usually bin and truck based collection.
Additional Forks, shovels, wheelbarrows, hand Mulcher, ‘Bertha’ compost mixer system, Rotating head forklift, tractor and backhoe Bin loaders / tippers, hopper, conveyors
Composting sprayers, water source, machete or tipping trailer and towing vehicle, available or 4.5 tonne digger or similar. A covered are for the most part included in
Equipment similar, mulcher / woodchipper (essential land area or secondary site for maturation area for product mixing, auger and preliminary price estimates above.
Required if accepting compostable packaging). phase. bagging equipment are also helpful. Shredder / mulcher also needed, concrete
Bagging system if selling by the bag. pad and power required.
13 https://carboncyclecompost.com/shop/#community-composting
14 https://www.yumpu.com/en/document/read/35332930/zero-waste-bus-tour-report-south-island-2004-pdf-13-mb
15 https://infocouncil.aucklandcouncil.govt.nz/Open/2018/12/GBI_20181211_AGN_7987_AT_files/GBI_20181211_AGN_7987_AT_Attachment_64105_1.PDF
3935 Community Hot Compost Box Use Methodologies
The following table provides a comparative overview of the main approaches
to community scale composting systems currently operating in New Zealand,
aerobic and anaerobic. The main difference between the two approaches is
the need for aeration or turning and the compost cycle times. Many
community composting organisations are now using a combination of
aerobic and anaerobic methods. 35.3 Aerobic vs. Fermentative Anaerobic Compost Box Comparison
Aerobic Fermentative Anaerobic
35.1 Aerobic Composting Standard • 1,700 litre • 1,700 litre
This is the traditional method of hot composting. The aerobic composting Compost Box (1.7m 3 or 1.2m cube) (1.7m 3 or 1.2m cube)
Volume
process uses oxygen-dependent organisms to break down the organic
Cycle Time • 8-10 weeks minimum • 6 weeks minimum
matter. As such the compost is aerated and frequently turned to maintain
oxygenation and achieve temperatures of over 550 C (for periods of three or Turning • 4-5 times minimum • 2 times
more days for pasteurisation). Turning of the compost varies by composter
and organisation, as well as the density and makeup of the compost, ranging Process • Cut or shred larger items • Cut or shred larger items
considerations • Many require water supply • Requires sprayer for inoculant
from twice per week through to once every 2 weeks.
depending on inputs and water supply
• Benefits from an aerated • Benefits from a sealed
35.2 Fermentative Anaerobic Composting environment environment
Fermentative Anaerobic Composting is an approach utilising a Beneficial
Anaerobic Microbe mix (e.g. BAM which contains x12 species of fungi, yeasts Additional cost • Estimated $25 - $55 per cycle • Estimated $15 - $25
and bacteria). Anaerobic composting is also known as Fermentative or SPIC considerations
Labour 15-30min per turn at $22.10 BAM $4 per cycle (Requires 1Ltr per box
Composting (Static Pile Inoculated Compost) and is effectively a scaled up per hour (excludes filling and per cycle and retails at $80 for 20Ltr).
Bokashi type system. As the compost is layered, or the box filled, it is sprayed unloading). Labour 15-30min per turn at $22.10 per
hour (excludes filling and unloading).
with an inoculum containing beneficial anaerobic microbes, which break
down the organic matter without the need for oxygen and while eliminating Food waste • 800kg per box (at 50% ratio) • 800kg per box (at 50% ratio)
the production of methane. This significantly reduced the need for turning capacity
the compost. Several inoculants are commercially available, of which Nutri- Maturation post • 8-12 weeks • 8-12 weeks
Life B.A.M is one. Some community composting organisations are also composting
experimenting with making their own. Advantages • No additives required • Lower overall cost when
including labour
NOTE: Fermentative Anaerobic Composting is different from anaerobic digestion • Reduced need for turning
or anaerobic decomposition (rotting), which produces environmentally harmful • Faster cycle time
methane and creates a sludge which is even more difficult to breakdown and
Figure 15
typically still requires aerobic composting to be stabilised.
40You can also read