Wellington Economic Inventory Analysis - URP 6920 Planning Workshop Fall 2011 1 Wellington Economic Inventory Analysis
←
→
Page content transcription
If your browser does not render page correctly, please read the page content below
Wellington Economic Inventory Analysis

                                                   URP 6920
                                               Planning Workshop
                                                   Fall 2011
  1   Wellington Economic Inventory Analysis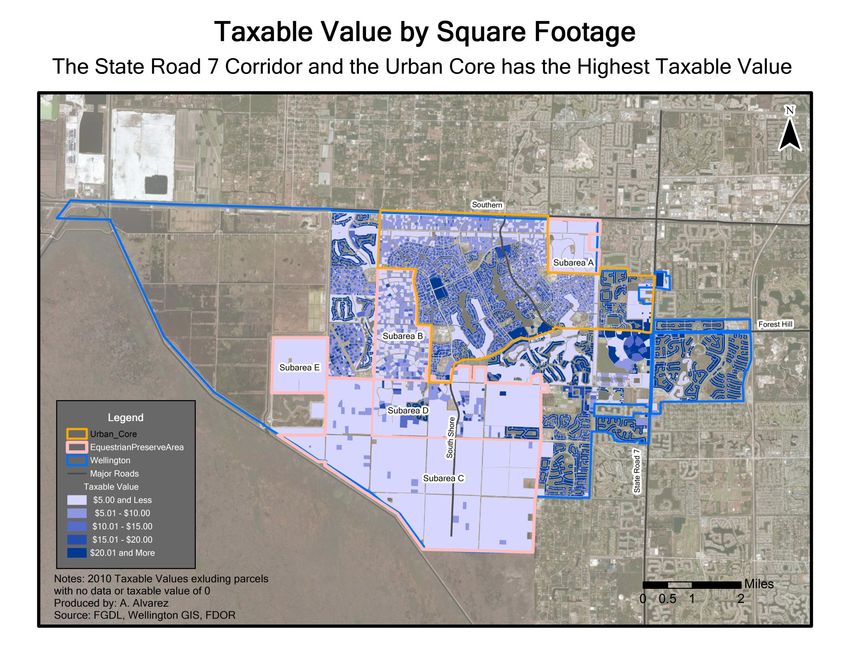
2 Wellington Economic Inventory Analysis
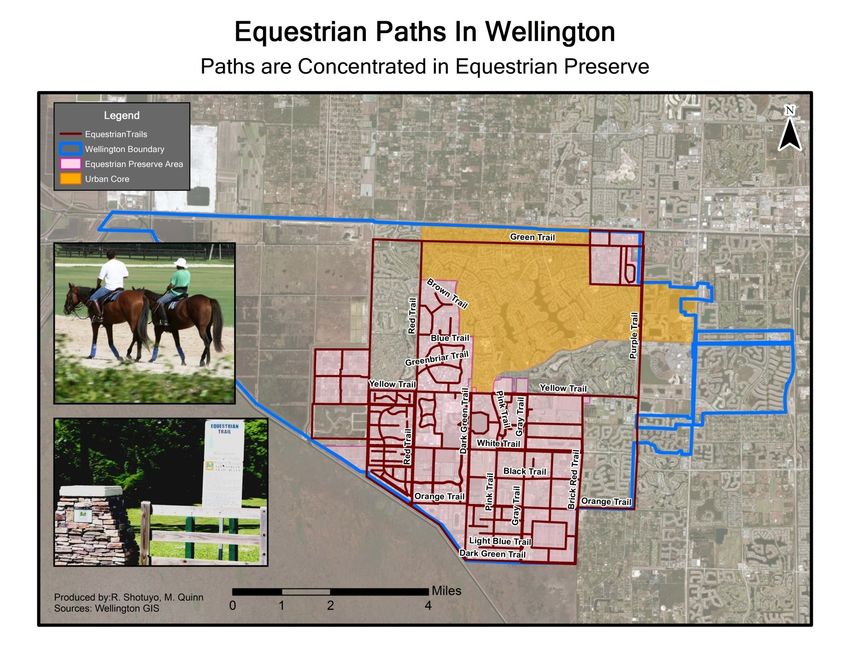
Table of Contents
Executive Summary ................................................................. 4 Chapter Four: Local & Regional Business Climate ................ 64
Chapter One: Changing to Stay the Same .............................. 9 Local Industry Dominance and Sector Prevalence ...... 64
The “Great Hometown” Character of Wellington ........... 9 Local Health Care Cluster ........................................... 64
Equestrian Community in Wellington .......................... 11 Wellington’s Workforce ................................................ 65
Business-Friendly Culture of Wellington ..................... 12 Commuting Patterns .................................................... 67
Responsive Governance ............................................. 13 Business Culture ......................................................... 69
Chapter Two: Self-Discovery ................................................. 14 Big-Box Stores ............................................................ 73
Who are the present Wellingtonians? ......................... 14 Medical Facilities ......................................................... 74
Who are Wellington’s competitors? ............................. 19 Veterinary Facilities ..................................................... 78
What are their consumption habits? ............................ 23 Six Pillars Initiative ...................................................... 78
Who can Wellington attract today and in the future? ... 25 Life Sciences and Research Facilities ......................... 78
Which demographic aspects can shape Wellington’s Primary and Secondary Education .............................. 80
future? ................................................................................ 31
Higher Education ......................................................... 82
Chapter Three: Physical Assets and Competitiveness ......... 33
Business Climate of Wellington ................................... 84
Development and Redevelopment .............................. 33
FAU SURP Research Team................................................... 85
Redevelopment: Focus on Specific Sites .................... 35
Developable Areas ...................................................... 39
Green Space and Pedestrian Facilities ....................... 42
Critical Facilities .......................................................... 44
Networks ..................................................................... 46
Property Market ........................................................... 54
3 Wellington Economic Inventory Analysis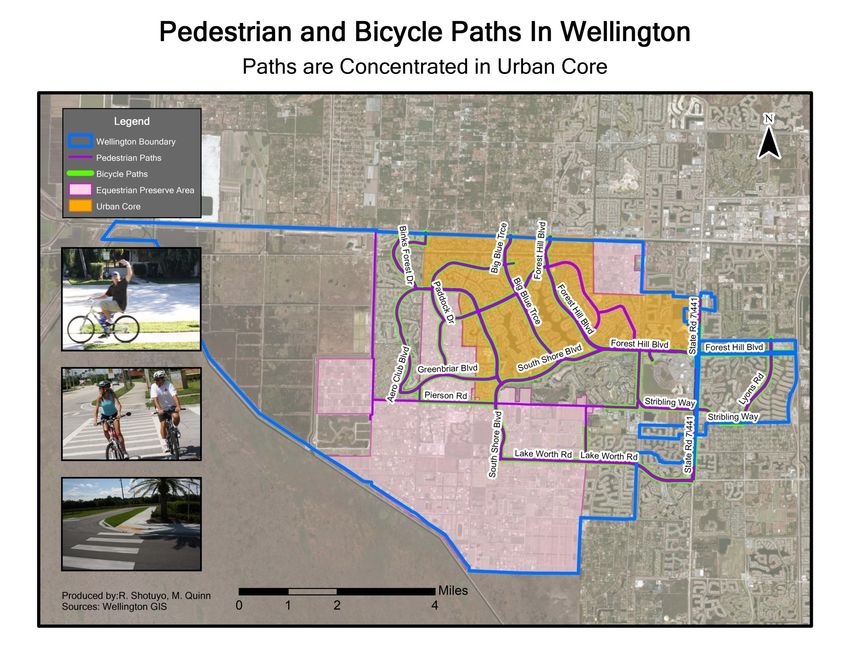
Executive Summary structures, transportation characteristics (travel time to work),
occupation, class of workers, educational attainment, and
housing occupancy. Later, the findings from the key areas
were compared to the findings from four other comparable
Wellington is a community of 56,508 people, located on 44.9 cities in South Florida including Jupiter, Royal Palm Beach,
square miles of land in Palm Beach County, Florida1. Coral Springs, and Weston. Key findings from the
Wellington is a family-oriented community with 79 percent of demographic analysis include:
its households comprised of families. With its “Great
Hometown” character and exceptional equestrian resources,
In terms of the Total Population and Population Density,
Wellington is a unique community in Palm Beach County and
across the three geographic areas, there was an influx of
in South Florida.
new residents. More specifically, the population density
within the 30 minute heavy drive time area increased the
This report provides the results of the Economic Inventory
most. This presents historic opportunities for Wellington in
Analysis for Wellington. The Economic Inventory Analysis was
terms of increased demand of people who are likely to live
conducted in three parts: Demographic Analysis, Physical
and/or work in Wellington.
Resources Analysis and Economic Conditions Analysis. Each
In terms of Age, the group with the least number of people
part focused on identifying the key questions and variables,
in Wellington is between 20-34 years old. Wellington is a
data collection, analysis, and interpretation of results.
family oriented community; the residents between 35-49
years old and below 19 years old represent the two most
Demographic Analysis
dominant age groups. The small number of 20-34 year old
The first stage of the project focused on demographic analysis age group residents shows that young people who are out
and compared Wellington with the 30-minute heavy-traffic of college and/or young professionals in the early stages of
drive-time radius (HDR) and the 30 to 60-minute heavy-traffic their lives do not stay in Wellington. Some of the younger
drive-time radius (HDR) areas around Wellington. residents of Wellington might be moving to other places
when they reach this stage, which might suggest a
Sixteen variables were examined for the demographic analysis
possible brain drain from the residents.
of the three geographic areas including total population,
The Household Size within Wellington is greater than that
population density, ethnicity, age, gender, language
of the surrounding 30 and 30 to 60-minute HDR areas
characteristics, number of households, household size,
emphasizing the strong family character of the community.
households by number of vehicles, household income, age of
With regard to Household Income, the inflation adjusted
data suggests that the median household income in
1
Source: 2010 U.S. Census Wellington has declined over the course of eight years.
4 Wellington Economic Inventory Analysis
For the 30 to 60-minute HDR area, the data suggests concentration of its residents (25 years or older) having
income polarization. These are the effects of the current Bachelor’s degrees or higher.
economic recession.
Demographic Analysis results generally show that Wellington
With regard to Travel Characteristics, the most significant
is a high-income and highly-educated community that has the
conclusions drawn from the analysis indicate that residents
potential to attract more residents from the region. Compared
that live within the 30-minute HDR are traveling to
to other cities with similar characteristics, Wellington has
Wellington for work related reasons. On the other hand,
strong competitive advantages in relation to its demographic
the majority of residents that live within the 30 to 60-minute
characteristics and community profile as a family-oriented
HDR are not traveling into Wellington for work. If
community.
Wellington would like to attract more people from this area,
the amount of high-paying job opportunities in the city
Physical Resources Analysis
needs to be increased.
With regard to Occupation/Class of Workers across the An analysis of the physical resources within Wellington and
three geographic areas, White Collar occupation inside a 30-minute HDR around Wellington was conducted to
constitutes the largest class of workers. determine the viability and sustainability of the community at
With regard to Educational Attainment, 21.29 percent of large. Key findings for this analysis include:
residents, age 25 or older, within the 30-minute heavy
traffic drive time area and 29.30 percent of the residents Wellington has approved 5.5 million square feet of new
within 30 to 60-minute heavy traffic drive time area have development as of 2011. 82 percent of this development is
obtained Bachelor’s degree or higher. This percentage is approved for non-commercial uses. Most of the
37.94 percent for Wellington, which shows that Wellington development has been approved outside of the urban core.
has a higher concentration of university educated residents Vacant residential land accounts for 90 percent of all
compared to surrounding areas. vacant land. Of this, 84 percent is located in the equestrian
In terms of comparison of Wellington with other four cities, preserve. Of all the vacant non-residential land, 85 percent
the results affirm that demographically these cities are is located in the urban areas.
similar. All of the communities are family-oriented with The lack of housing stock diversity is a weakness for
similar household size and high median income. Median Wellington. The community is relatively uniform in terms of
age also remains around the same level. the types of housing that it offers. This is a challenge in
Wellington has the second highest median household terms of attraction of new residents.
income after Weston. In terms of educational attainment, Presently, Wellington’s retail competitiveness is on par,
Wellington is again ranked second after Weston in terms of which suggests that the community is neither under-served
nor over-served and is relatively stable. Wellington’s retail
5 Wellington Economic Inventory Analysis
competitiveness can be found chiefly on Forest Hill one day encroach upon space reserved for the equestrian and
Boulevard and could go up or go down depending on the conservation areas.
market condition.
Economic Conditions Analysis
Wellington’s critical facilities adequately meet the demands
of the community and parks, schools, police stations, and In the Economic Conditions Analysis, the topics that were
the like are at optimum level. Ultimately, Wellington’s examined include the contribution of the Wellington’s residents
critical facilities should accommodate an additional 5,000 to its economy in comparison to four cities (Jupiter, Royal
to 6,000 residents, but in that case, Wellington may require Palm Beach, Coral Springs, and Weston); the contribution of
more critical facilities. Thus, Wellington should invest the major physical assets to Wellington’s economy; and the
carefully in these aspects. regional context for Wellington in terms of key economic
Wellington is well situated at the edge of major traffic flows, variables. In the regional context, Wellington is compared to
characterizing it as an origin and destination, rather than a the 30-minute HDR, 30 to 60-minute HDR and the county. Key
pass-through location. It is well connected to the major findings are:
cities and transportation nodes located to the east via road
networks. In contrast, north-south connectivity is limited for Between the five cities, the industries of employment for
Wellington. residents is similar. Among the five cities, Jupiter is the
The lack of connectivity between the agricultural area, only city with more people entering for work compared to
equestrian area, urban core, and commercial fringe poses people who are going to other places to work. In all other
a challenge to the overall connectivity within Wellington. cities including Wellington, more people leave to work in
Uniting them could present an opportunity to strengthen other cities compared to people who come to these cities
the community identity. to work.
Wellington’s principal strengths come from good city Wellington does not provide enough higher paying jobs for
planning. The community’s effort to spearhead a medical
the people that live there. Furthermore, the workers that
arts district alludes to a bold initiative that will make use of
are coming into Wellington are coming in for lower-wage
the resources of the Wellington Regional Medical Center.
jobs. The younger age group of workers (29 and under)
represent the smallest proportion of all workers coming in,
Results of the Physical Resources Analysis show that
staying or leaving Wellington for work. This shows that this
Wellington possesses strengths for development and
age group is shrinking in Wellington. Even though the
redevelopment through the use of land and the building of new
working population that are in the 29 and under age range
structures. There are still some parcels of vacant land and
represent a lower segment of the population, this age
several under-utilized buildings, which are ideally situated in
group is primarily working in Wellington. It would benefit
the community and can be developed or redeveloped.
However, development and redevelopment is limited and may
6 Wellington Economic Inventory Analysis
Wellington to strive to add higher wage jobs as many governmental taxes. Wellington needs to utilize its
people leave the city to work somewhere else. equestrian preserve resource in a way to create more
In Wellington, the community exercises effective revenue for the community.
governance and has strong leadership within the different In terms of industry, Wellington holds many opportunities
governmental levels. for the future, based on relatively strong retail and
Wellington holds a business-friendly culture. City officials healthcare sectors. Wholesale and other industrial uses
and local business owners, residents and the Chambers of are very limited in the area.
Commerce all are welcoming of new business investment Wellington High School is the only school with an Equine
into the community. The community holds an identifiable and Pre-Veterinary focus. Building on this educational
Medical Arts District, which is in plans of expansion, as well aspect, partnering with a university and creating synergies
as a large retail sector which is also growing. between the equestrian industry and medical arts may add
Wellington once relied on the continued proliferation of to the economic competitiveness of Wellington.
planned development communities with single family The Life Sciences sector is increasingly important in Palm
dwellings in order to fulfill its housing demands and further Beach County. In this regard, current and future firms in
grow its local economies. After the real estate crisis, this Wellington may one day find themselves competing with
resource simply does not exist anymore. In turn, like in firms such as Scripps and Max Planck on a multi-scalar
other communities in South Florida, Wellington is now level. Wellington needs to plan immediately how to assist
faced with a high-level of foreclosures. The largest to ensure the success of firms in its Medical Arts District
concentrations of foreclosures are in the non-equestrian and possibly encourage other firms in Palm Beach County
areas. to relocate to Wellington while promoting the appeal and
The equestrian identity that Wellington has been able to advantages of Wellington community. There is tremendous
obtain and maintain is a major opportunity for the potential for growth in this area in the years to come.
community. The fact that Wellington holds the largest and
Economic Conditions Analysis demonstrates that in order to
longest running Equestrian Festival in the world presents a
seize on growth opportunities, Wellington has to creatively
unique opportunity for economic and community
utilize its unique economic assets by creating synergies
development and is a competitive advantage in the region
between the equestrian industry, medical arts, and retail
as well as in a global scale.
sectors. True innovation lies in the junction of these unique
Between 2005 and 2009, agricultural and non-agricultural
resources. Creating high-paying jobs through medical arts and
equestrian preserve taxes as a source of tax revenue has
life sciences is important for the economic future of Wellington.
steadily declined in proportion. In 2005, equestrian
preserve taxes were 13 percent of total governmental
taxes, while in 2009, it was seven percent of total
7 Wellington Economic Inventory Analysis
Key Questions

After the completion of these three analyses, key findings and
results were organized to answer following four major
questions. The chapters in this report are also organized
according to these questions, which are:

 1- What does Wellington need to change to stay the same
    as a “Great Hometown”?
 2- Who are the present and future residents of Wellington
    (A Self-Discovery)?
 3- How do the physical resources contribute to the
    competitiveness of Wellington?
 4- What is the local and regional business climate for
    Wellington?

Wellington is a “Great Hometown” and a desirable place to
live, both now and in the future….

         8   Wellington Economic Inventory Analysis
Chapter One: Changing to place that is missed once one is away. These characteristics
can all be examined under the concept of “urban livability”,
Stay the Same which is about the attractiveness of a place for people.
Although, the definition of this concept is subjective according
Wellington has indispensable assets that add to its “Great to different communities and people, the American Institute of
Architects identifies some common principles that are
Hometown” character. In order to preserve the
associated with urban livability2. These principles include
community identity in this fast changing world, Wellington
offering variety of choices in housing, recreation, employment,
needs to embrace and plan for the changes in its urban shopping, and transportation; human scale and walkability;
environment. mixed-use developments; vibrant public spaces that stimulate
face-to-face interaction and public art; neighborhood identity
The “Great Hometown” Character of Wellington with a sense of place; preservation of open spaces; protecting
environmental resources; providing a variety of transportation
“A place where you can raise a family, where your children return to choices; restoring the existing developments; and excellence
raise their families and where you can comfortably and actively age
in design of the built environment. All of these principles aim to
in place. We are Wellington—recognized as one of the Best Places to
create more healthy, enjoyable and safe living choices for
Live because of what we offer.”
people.
(Source: Community Investment, )
Wellington has well-maintained neighborhoods, top-rated
schools, many parks, unique equestrian resources, and high
level of services, all of which contribute to the “Great
Hometown” character. In the past 20 years, Wellington’s
population has almost tripled. Wellington is a family-oriented
community. Currently, around 79 percent of the households in
Wellington are comprised of families. Most residents are in the
35-49 year age group, whereas the 20-34 year range has the
least number of residents. Median household income in 2010
has exceeded $79,000, which is high compared to other
communities in South Florida.
Picture 1.1: 9/11 Monument in Wellington, a key asset demonstrating
community values of a “Great Hometown”
Wellington’s “Great Hometown” catchphrase is associated with
2
a place that offers quality amenities for its residents and a Kelly, J. (2007) “Reflections on the Most Livable City: AIA’s 10 Principles of Livable
Communities” Columns. Oct. 07, pp. 6-13.
9 Wellington Economic Inventory Analysis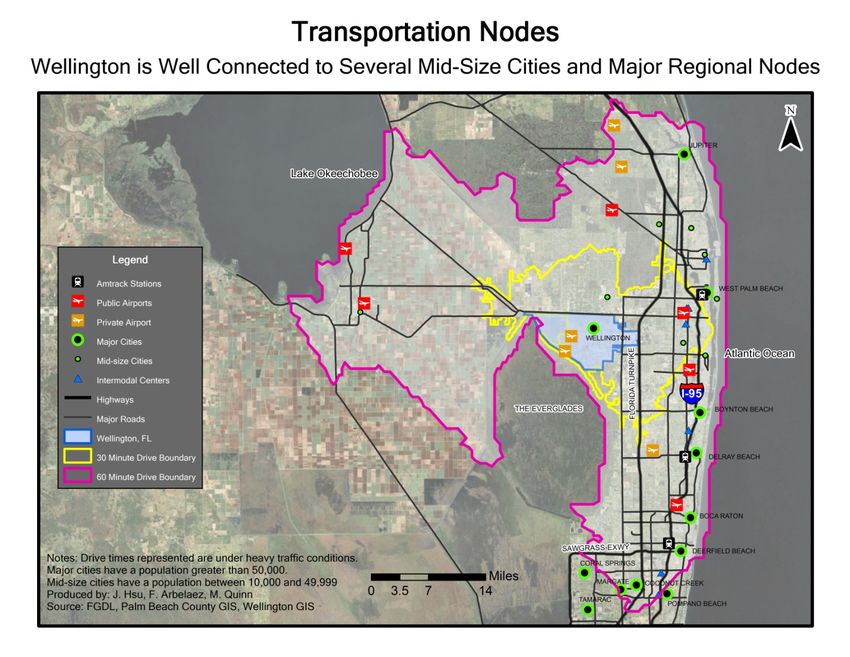
Wellington, as a “Great Hometown”, has many of these
characteristics. It is truly a place and community with high
livability. In 2010, Wellington was chosen as one of the “top
100 places to live” by the CNN Money magazine by looking at
indicators including jobs, schools, safety, commute times,
housing affordability, median family income, median age,
weather, and air pollution. From Florida, there were two other
places that are ranked in the top hundred, Coral Springs and
Coconut Creek. Achieving livability and building great
communities are always works in progress. Providing options
in tune with the emerging global and regional trends is a key to   Picture1.2: Aerial view from Midtowne in Wellington, an area that serves as a
attract and keep residents in Wellington.                          spine corridor for Wellington

In this rapidly changing world, where people are connected         The family-oriented character is an important asset in
globally through technology, the choices offered in                Wellington. Based on where people and families are in their
communities should always be under constant analysis. In this      life development stage, their preferences and what they can
fast world, people’s living, entertainment and consumption         afford change. Family-oriented character should not be only
habits change quickly. Wellington is a high-income level           about attracting and keeping families as residents of
community, which indicates that residents of Wellington will be    Wellington, but it should also be about attracting and keeping
more open to customized consumption and specialized tastes         family members in every stage of their lives.
in shopping and entertainment as well as in housing related
choices. For example, gourmet restaurants and boutique             Wellington     has    many     communities       with    different
stores might be attractive to Wellington’s residents as much as    characteristics. There are traditional neighborhoods, golfing
the chain restaurants and stores. Also, through this type of       communities, equestrian areas, as well as very unique places
consumption, Wellington might become an important magnet           including an aviation community and the Rustic Ranches.
for the residents in the surrounding communities.                  Because of this variety, constructing a singular place identity is
                                                                   a challenge. These diverse communities and neighborhoods
                                                                   can be brought together in various different ways. Creation of a
                                                                   well-utilized pedestrian-friendly environment that connects
                                                                   destinations such as public plazas, parks, restaurants, and
                                                                   shopping areas can be one way to enhance and create a
                                                                   vibrant area. In Wellington, it is very easy to envision an

        10    Wellington Economic Inventory Analysis
environment where people know each other, share
experiences, and embrace the “Great Hometown” character.
Equestrian Community in Wellington
The equestrian community truly gives Wellington a global
identity as “the winter equestrian capital of the world”. The
Palm Beach International Equestrian Center (PBIEC) reports
that between December and April, more than 7,000 local and
visiting horses compete in sports including show jumping, Picture 1.3: Equestrian events held in Wellington
hunter, dressage, western/trail riding, driving and polo. PBIEC
organizes the Winter Equestrian Festival (WEF), which is the Wellington has a global brand, which attracts many people
largest and longest-running event in horse sports (12-weeks) from different parts of the region, country and the world. This
held annually from January through April. Riders and horses global brand has great potential to be utilized as an urban
from many countries and the U.S. come to Wellington to marketing and economic development strategy. In city
compete in these events. The International Polo Club, located marketing, the challenge is to find a balance between
in Wellington, is also considered as one of the best polo standardization and differentiation3. City marketing strategies
facilities in the world and hosts tournaments between January both demonstrate a level of development in a place that is as
and April. strong as the competitors’ and at the same time they
accentuate the unique opportunities offered by the urban
With its equestrian identity, Wellington is compared to places context. In this regard, authentic character of the place is the
such as Lexington, KY and Ocala, FL, which are designated as most important asset. “Great Hometown” character of
the “Horse Capitals of the World” by the U.S. Department of Wellington defines a unique identity for Wellington. Based on
Agriculture. In the world, Wellington is on the list with important the global equestrian identity and the uniqueness of the
equestrian communities including Newmarket, England, which community in the region, the question for Wellington becomes
is the birthplace and global center of pure bred horse racing, “Great Hometown for whom?” In this regard, it is important to
and Chantilly in Paris, France, known as the prince’s city and recognize different groups that live and visit Wellington and
an equine capital. In terms of Polo, Wellington is in the same understand their needs.
list with places such as St. Moritz, Switzerland.
3
Doel, M. and Hubbard, P. (2002) “Taking World Cities Literally: Marketing the City in
a Global Space of Flows”. City. 6(3), pp. 351-368.
11 Wellington Economic Inventory Analysisfrontier of Florida’s economy. Palm Beach County is one of the
Business-Friendly Culture of Wellington leading counties in the state in terms of pursuing growth in the
life sciences sector. In this respect, Wellington is in tune with
“The role of municipal government is to facilitate business the economic context of the county and the state.
development through the provision of adequate infrastructure and a
friendly government environment. Business needs to be able to grow
and prosper. The community needs to address the issues of
neighborhood revitalization, infrastructure and facilitation.”
(Source: Economic Development, )
Wellington has approximately 2,600 businesses. Wellington
Green Mall and Wellington Regional Medical Center are the
two largest employers in Wellington. The current economic
situation has proven that communities should develop and
implement more attractive models for businesses. Wellington
Picture 1.4: Medical Arts as a possible economic development strategy in
recognizes this and attempts to diversify its economic base by
Wellington
pursuing businesses that are based on high-paying innovative
jobs that are sustainable, which is about efficient use of
The workforce of the knowledge economy that deals with
resources to create short and long term profits. In Wellington
information and innovation belong to the “Creative Class”. A
2060 vision, one of the topics emphasized is about creating a 2
common theme present in all the workers of the Creative Class
million square feet Medical Arts District focused around the
is their high level of education and skills. As Richard Florida
Wellington Regional Medical Center. It is expected that such a
states, the workers for these types of industries know that their
district will add around 6,000 jobs to Wellington’s economy and
basic needs will be met by any city, therefore they are more
may also offer alternative job opportunities for the residents
discerning about where they choose to live. They look for
that are working outside of Wellington.
amenities such as cultural events and parks and they are more
concerned with the quality of life in an area. The Creative City
This characteristic of Wellington might be examined in relation
concept connected to the Creative Class is about 3 T’s:
to the recent economic development vision in Florida focused
Technology, Talent and Tolerance4. A city that has more of the
around the knowledge economy, specifically the life sciences
3 T’s will be more successful in attracting businesses and
sector. Since 2002, there is a deliberate effort in Florida to
people. It is important to note that the Creative City concept is
diversify the economic base comprised of construction,
deemed to be more applicable to the metropolitan area scale
tourism, and agriculture with high-tech knowledge based
industries. Life sciences including medical arts are seen as the 4
Florida, R. (2002) The Rise of the Creative Class. Basic Books: New York.
12 Wellington Economic Inventory Analysisthan the individual cities5. Still, with the emerging life sciences Responsive Governance
sector and attention paid to arts and creative industries, Palm
Beach County and South Florida provide a fertile context for “Whether through personalized pre-application meetings with the
the Creative Class and this is an issue that should be taken Wellington review team, using expedited permitting with a single-
into account by Wellington. point of contact to help you through the process, help with designing
a customized zoning district or putting you in contact with the right
people, we can help you get your project started off on the right foot
As noted earlier, in Wellington, the smallest age group is the
and keep it moving through a clear and consistent process.”
between 20 and 34. This means that young post-college (Source: Responsive Government, )
professionals do not prefer to live in Wellington especially in
this stage of their lives. Thus, this analysis may also indicate Wellington embraces local businesses and residents as their
that children of families who live in Wellington may leave customers and believes local government should work as a
Wellington after college. For this reason, it is possible that partner with these groups. Wellington’s government structure
Wellington may be experiencing “brain drain”. Data indicates is built on innovation for more efficiency in the administrative
that Wellington teens are graduating high school, heading off structure as well as building relationships with residents and
to college and then not choosing to return. The question then businesses.
becomes whether or not Wellington is willing to make the
changes to attract these people back to the community. These This view of local government as a partner to residents and
young professionals may be first-time homeowners that may businesses is more applicable to the general framework of
be priced out of the city or they may have life style choices, “governance”, which involves the processes of decision-
which are not found in Wellington. If Wellington wants to attract making and implementing these decisions7. There are many
this young professional workforce back to live and remain, it formal and informal actors taking role in governance and
needs to provide living, entertainment and career related government is only one of them. Thus, this framework implies
choices that cater to the life style of these young professionals. the need for formation of more fluid networks between
The creative knowledge economy depends on creating an stakeholders to make decisions with more events and
“innovative milieu”6 in which informal relationships play a communication.
crucial role in collective learning and adapting to change.
Planning the urban context of Wellington should strive to
develop this “innovative milieu” for its workers and residents.
5
Lewis, N.M and Donald, B. (2010) “A New Rubric for ‘Creative City’ Potential in
Canada’s Smaller Cities” Urban Studies 47 (1), pp. 29-54.
6 nd 7
Castells, M. (2010) The Rise of the Network Society. 2 Edition. Wiley-Blackwell: Stoker, G. (1998) “Governance as Theory: Five Propositions”. International Social
West Sussex, UK. Science Journal. 50 (155), pp. 17-28.
13 Wellington Economic Inventory Analysissteady growth during the last twenty years. However, it is
important to mention that Wellington was incorporated in 1996.
Chapter Two: Self-Discovery Population density has remained steady between 2000 and
2010. The population of Wellington has been consistently
Wellington is embarking on a period of self discovery: growing at around 18,000 people per decade. Population in
Discovering its strengths, discovering its weaknesses, Wellington is highly concentrated around the Urban Core8.
discovering which characteristics define a “Wellingtonian” There is a higher density cluster near SR 441 and the majority
and where they live. As Wellington recognizes these of the remaining area is rural and equestrian preserve area.
characteristics they can begin to evolve and shape their Wellington’s age and gender demographics are depicted in the
following pyramid. Note that the age group between 20 and 34
community.
years are smaller compared to other age groups (Figure 2.1).
Who are the present Wellingtonians?
2010 Population by Age & Gender
South Florida has seen rapid growth for the last twenty years, Female Male
and so has Wellington. Demographic data reflects a great 172 253
change in population, immigration, education, and social 80 to 84 years 320 420
492 546
characteristics. Wellington developed from a farming 70 to 74 years 641 748
1,074 1,083
community rated as one of the “Best Places to Live” by CNN 60 to 64 years 1,549 1,583
1,908 2,064
Money Magazine in 2010. 50 to 54 years 2,324 2,537
2,477 2,905
40 to 44 years 2,217 2,661
Wellington has seen rapid growth in all demographic areas 1,621 2,018
30 to 34 years 1,165 1,396
during the past decade. The U.S. 2010 Census reports a total 1,186 1,247
20 to 24 years 1,491 1,414
population of Wellington as 56,508. Table 2.1 shows the 2,350 2,333
10 to 14 years 2,610 2,517
2,110 1,987
Population and Population Density Wellington, Florida 1990-2010 Under 5 years 1,463 1,434
Absolute Percent 3,000 2,000 1,000 0 1,000 2,000 3,000
Category 1990 2000 2010
Change Change
17,935 46.5% Figure 2.1: Population by Age & Gender (2010 U.S. Census)
Population 20,670 38,573 56,508 (2000 to (2000 to
2010) 2010)
Population
1,228 1,258 8
Density (Sq Mile) Urban Core refers to the densely populated area outside the Equestrian Preserve
Area, bounded by the Southern Boulevard in the north, US 441/ SR7 in the east,
Table 2.1: Population and Population Density Wellington, Florida 1990-2010 Forrest Hill Boulevard, South Shore Boulevard and Pierson Road in the south, and
(U.S Census) 140th Avenue, Greenview Shores Boulevard, Ousely Farms Road, and canals in the
west.
14 Wellington Economic Inventory AnalysisThe average household size in Wellington is 2.93. 80 percent 2.1). As shown in Figure 2.3, median income has increased
of all the households are comprised of families. These families between 2000 and 2010. On the other hand, inflation adjusted
have young children that go to Wellington’s schools. These median income actually indicates a decline in the median
families are most likely to have cars for each parent and income level between 2000 and 2010.
additional cars for either travel or recreation. In Wellington
around 35.6 percent of the households are earning more than Median Household Income (dollars)
$100,000. 36.90 percent are earning between $50,000 and $80,000
$100,000 (Figure 2.2). This shows that the majority of the $75,268
residents earn more than the county median average income. $75,000
$70,000
Household Income $70,271
$65,000
2000 2010
2.10% Figure 2.3: Median Household Income (2000 U.S Census and 2010 ACS)
3.80%
10.20%
6.20% Less than $10,000
5.90% $10,000 to $14,999 Wellington is a family-oriented community (Figure 2.4). In
7.20%
$15,000 to $24,999 2010, 79 percent of its population lived in a family household,
$25,000 to $34,999
maintaining its family-orientated identity defined in 2000.
$35,000 to $49,999
9.50% Households by Type
$50,000 to $74,999
$75,000 to $99,999 Family Non‐family
$100,000 to $149,999
18.20% 100%
$150,000 to $199,999 2,256 4,114
$200,000 or more 80%
22.30%
14.60% 60%
40% 10,682 15,545
20%
Figure 2.2: Household Income (2010 American Community Survey (ACS))
0%
The highest average household income earning residents are 2000 2010
concentrated in the equestrian preserve areas and the lower Figure 2.4: Household by type (2000 and 2010 U.S Census)
income is concentrated around the urbanized center (Map
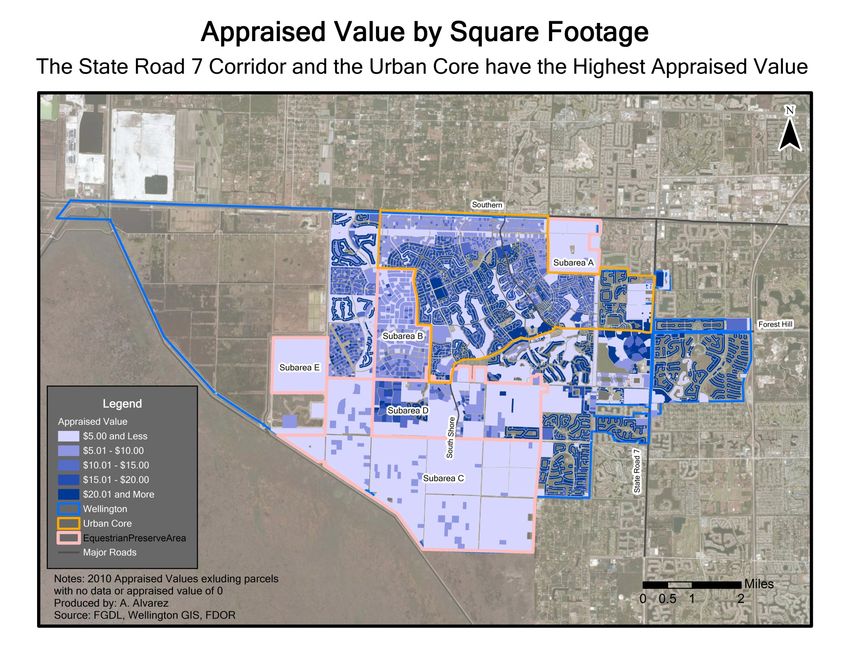
15 Wellington Economic Inventory AnalysisMap 2.1: Average Household Income in Wellington 16 Wellington Economic Inventory Analysis
Although Wellington has seen a 46.5 percent increase in                  had a Bachelor’s degree or higher and in 2008, this statistic
population since 2000, there is almost no change in the                  was around 37.8 percent.
proportions of the language characteristics (Table 2.2). Even
though the ethnic mix of the population has increased between
2000 and 2008, the primary language spoken at home did not                Persons 25 years or older by Educational Attainment of
change, which supports the aforementioned conclusion.                     Wellington, FL 2000-2008
Having a predominantly English speaking population, one can                                                                            Proportion
assume that the immigrant community moving into Wellington                               2000       2008       Absolute    Percent
                                                                          Categories                                                    Change
is capable of speaking fluent English. It is also possible that                         (Pop%)     (Pop%)      Change      Change
                                                                                                                                        (%Point)
this segment represents the second or third generation
decendents of immigrants.                                                 High          6,891      9,882
                                                                          School or                           2,991        43.40%     0.06%
 Language At Home of Wellington, FL 2000-2008                             less          28.69%     28.76%
                            2008                            Proportion    Some
                  2000               Absolute    Percent                                8,015      11,491
 Categories                 (Pop                             Change       College,                            3,476        43.37%     0.07%
                (Pop %)              Change      Change
                             %)                             (% Point)     Associate     33.37%     33.44%
                 29,035    40,818
 English                               11,783    33.17%        -0.20%                   5,812      8,155
                81.70%    81.50%                                          Bachelors                           2,343        40.31%     -0.47%
                  4,323      6,002                                                      24.20%     23.73%
 Spanish                                1,679     4.73%         0.08%
                11.90%    11.98%                                                        3,297      4,835
                                                                          Graduate
 Indo-            1,479      2,418                                                                            1,538        46.65%     0.34%
                                          939     2.64%         0.19%     Degrees
 European                                                                               13.73%     14.07%
                 4.10%      4.29%
 Asian /            495        714                                        Total         24,015     34,363     10,348       43.09%
 Pacific                                  219     0.62%         0.13%
                 1.30%      1.43%                                        Table 2.3: Educational Attainment (2000 U.S. Census, 2008 Claritas)
 Island
                    287        399
 Other                                    112     0.32%            0%
                  0.80%     0.80%
Table 2.2: Language spoken at home (2000 U.S. Census, 2008 Claritas)

Wellington’s population has maintained a high level of
education between the years of 2000-2008. As shown in Table
2.3, 37.9 percent of the 25 years or older population in 2000

           17   Wellington Economic Inventory Analysis
Box 1.1: Social Traits Country Squires
Upscale, Middle Age w/ Kids
The following classifications are from Nielsen Lifestyle Median HH Income: $107,442
Segmentation. Nielsen uses up-to-date census data and the
principles of "birds of a feather flock together" to distinguish
categories that will apply to an area or a neighborhood. The following
groups are considered to be the five most predominant lifestyle
segments in Wellington.
Beltway Boomers
Upper-Middle, Older w/ Kids Oasis for affluent Baby Boomers who have fled the city for the
Median HH Income: $80,026 charms of small-town living in sprawling properties, the families of
executives live in six-figure comfort. They can afford to spend on
consumer electronics, wireless and computer technology, luxury
cars, powerboats, books and magazines, children's toys, and
exercise equipment.
Upward Bound
Upscale, Middle Age w/ Kids
Median HH Income: $88,455
These Boomers are still raising children in comfortable suburban
subdivisions, and they're pursuing kid-centered lifestyles. As
consumers, these groups are big fans of health foods, computer
equipment, consumer electronics, and the full range of big-box
retailers.
More than any other segment, Upward Bound appears to be the
home of those legendary Soccer Moms and Dads. In these small
satellite cities, upscale families boast dual incomes, college degrees,
and new split-levels and colonials.
18 Wellington Economic Inventory AnalysisWhite Picket Fences
Who are Wellington’s competitors?
Upper-Middle, Younger w/ Kids
Median HH Income: $55,007Midpoint Due to the mobility of South Floridians, four cities were chosen
for their perceived similar qualities to Wellington. In Palm
Beach County, Royal Palm Beach and Jupiter were selected.
In Broward County, the cities of Coral Springs and Weston
were chosen. The purpose in this selection was to examine
cities that are seen as likely competitors for Wellington and try
to identify what makes Wellington stand out amongst these
cities.
Stereotypical American household of a generation ago: young,
upper-middle-class, and married with children. But the current
version is characterized by modest homes and ethnic diversity,
including a disproportionate number of Hispanics and African-
Americans.
Kids & Cul-de-sacs
Upper-Middle, Younger w/ Kids
Median HH Income: $76,379
Upper-middle class, suburban, married couples with children--that's Figure 2.5: Population density in Wellington and Comparable Cities (2008
the skinny on Kids & Cul-de-Sacs, an enviable lifestyle of large Claritas)
families in recently built subdivisions.
19 Wellington Economic Inventory AnalysisCoral Springs Wellington
2000: 117,549; 2010: 121,096 2000: 38,216; 2010: 56,508
Female 2010 Male 2010 Female 2000 Male 2000 Female 2010 Male 2010 Female 2000 Male 2000
65 and older 65 and older
50 to 64 years 50 to 64 years
35 to 49 years 35 to 49 years
20 to 34 years 20 to 34 years
5 to 19 years 5 to 19 years
Under 5 Under 5
20,000 15,000 10,000 5,000 0 5,000 10,000 15,000 20,000 8,000 6,000 4,000 2,000 0 2,000 4,000 6,000 8,000
Figure 2.6: Coral Spring Population Pyramid (2000 – 2010 U.S. Census) Figure 2.7: Wellington Population Pyramid (2000 – 2010 U.S, Census)
Weston Jupiter
2000: 49,286; 2010: 65,333 2000: 39,328; 2010: 55,156
Female 2010 Male 2010 Female 2000 Male 2000 Female 2010 Male 2010 Female 2000 Male 2000
65 and older 65 and older
50 to 64 years 50 to 64 years
35 to 49 years 35 to 49 years
20 to 34 years 20 to 34 years
5 to 19 years 5 to 19 years
Under 5 Under 5
15,000 10,000 5,000 0 5,000 10,000 15,000 8,000 6,000 4,000 2,000 0 2,000 4,000 6,000 8,000
Figure 2.8: Weston Population Pyramid (2000 – 2010 U.S. Census) Figure2.9: Jupiter Population Pyramid (2000 – 2010 U.S. Census)
20 Wellington Economic Inventory Analysisthe highest with $90,000. The median income for families is
Royal Palm Beach
virtually even for all the cities except Weston, which is almost
2000: 21,523; 2010: 34,140
$20,000 above the second highest city, Wellington. All of the
Female 2010 Male 2010 Female 2000 Male 2000 cities follow the trend that non-families earn less money than
families, and single female households earn significantly less
65 and older
than the median level. When the household income is
50 to 64 years
disseminated according to income levels, it becomes apparent
35 to 49 years that when Wellington is compared to other cities, Wellington
20 to 34 years has a strong middle class (Figure 2.13). Weston has more
5 to 19 years residents on the higher end of the income spectrum.
Under 5
The mean income by family size shows the expected trend of
6,000 4,000 2,000 0 2,000 4,000 6,000 more people working in a household, the higher the income
Figure 2.10: Royal Palm Beach Population Pyramid (2000 – 2010 U.S. (with the exception of Jupiter). In Jupiter there is a trend that
Census) fewer workers in a household bring in more money (Figure
2.11). This anomaly is likely due to Jupiter’s older population
After mapping the population densities of all cities, it is obvious
which consists of retirees collecting a pension, or earning a
that Wellington is unique with its urban core (Figure 2.5). The
wage at the top of the pay scale.
population pyramids of all five cities are roughly the same
shape. The population pyramids of these cities organized
Mean Income by Family Size
according to age and sex demographics are provided in Coral Springs Weston Wellington Jupiter Royal Palm Beach
Figures 2.6 through 2.10 with the data gathered from the U.S. $250,000
$200,000
Census.
$150,000
$100,000
Jupiter’s older population makes the pyramid much more top
$50,000
heavy. Coral Springs is denser in the middle of the pyramid, $0
but it also has double the population of Wellington. Of all the
No workers
1 worker
2 workers, husband
2 workers, other
3 or more workers,
3 or more workers,
husband and wife
and wife worked
All families
four comparable cities, Weston is the one most similar to
worked
other
Wellington with regard to the distribution of age. The
similarities mean that the other cities can serve as models to
Wellington with regard to age specific services and incentives.
Figure 2.11: Five comparable cities Mean Income by Family Size (2009
The median income for all five cities is above $60,000.
ACS)
Wellington is the second highest with $75,000, and Weston is
21 Wellington Economic Inventory AnalysisRace Demographics
Despite Jupiter’s older population, all of the cities have a Two or More Races:
similar dispersion of the age, and a very similar dispersion of Some Other Race alone
household income, with Weston residents earning the highest.
Native Hawaiian and Other Pacific Islander alone
Overall, all of the cities are very similar. Despite minor Asian alone
differences in various metrics, such as race (Figure 2.12), American Indian and Alaska Native alone
these cities are similar. The question to Wellington is, all things Black or African American alone
being equal, which they are, what makes them stand out? White alone
100%
In terms of educational attainment, Wellington has around 38 3% 2%
3%
3%
3%
2%
4%
3%
4% 2% 3%
percent of its over 25 year old population with Bachelor’s 90% 5%
5%
0%
4%
0%
1%
2% 4%
4% 0%
degree or higher. The educational attainment for the over 25 0%
10%
year old population of the four comparable cities shows that 80%
18% 23%
the cities of Coral Springs and Jupiter have roughly the same
70%
proportions as Wellington in terms of percent of the population
possessing a Bachelor’s degree or higher. Royal Palm Beach 60%
and Weston stood out for opposing reasons; Royal Palm
Beach has about a quarter of the population with a Bachelor’s 50%
degree or higher, and around 53 percent of Weston’s 86%
91%
40% 80%
population has earned a Bachelor’s degree or higher.
69% 67%
30%
20%
10%
0%
Coral Springs Weston
Coral Weston city, Wellington
Wellington Jupiter
Jupiter town, Royal
Royal Palm
Palm
city, Florida
Springs Florida village, Florida Florida Beach
Beachvillage,
Florida
Figure 2.12: Race Demographics (2009 ACS)
22 Wellington Economic Inventory AnalysisHousehold Income
Percent Earning Range
Coral Springs Weston Wellington Jupiter Royal Palm Beach
25.00%
Percentage of Households
20.00%
15.00%
10.00%
5.00%
0.00%
Less than $10,000 to $15,000 to $25,000 to $35,000 to $50,000 to $75,000 to $100,000 to $150,000 to $200,000 or
$10,000 $14,999 $24,999 $34,999 $49,999 $74,999 $99,999 $149,999 $199,999 more
Figure 2.13: Household Income, Percent Earning Range (2009 ACS)
What are their consumption habits?
variations. Wellington showed strong purchasing power across
Consumption habits are expected to show the spending
the board with food, consumed at and away from home, as the
patterns of Wellington’s residents, and based on these
strongest consumption group (Figure 2.15). This can be an
patterns, it will be possible to create expectations that can
opportunity for Wellington to establish a strong local market to
drive further opportunities for Wellington. As discussed
support this demand.
previously, these values were measured in Wellington as well
as in the four selected cities, Jupiter, Royal Palm Beach,
Wellington’s total consumption power for 2009 was estimated
Weston, and Coral Springs.
at $236,782,494 and with an average per household of
$12,044. Of all the comparable cities, including Wellington,
The study areas showed similar characteristics, which are also
Coral Springs was the only city that showed positive growth in
supported by the similarities found in the basic demographics.
consumption between 2002 and 2009 (Figure 2.14).
Not surprisingly, consumption habits do not show extreme
23 Wellington Economic Inventory AnalysisEven though Wellington attracted more households with an households increased 5.8 percent from 2000 to 2009, but
increase of 26.4% from 2000 to 2009, these household are households were able to grow their consumption power. The
spending less or they do not have the consumption power as, rest of the studied cities also had declining consumption
for example, the households from Coral Springs; this city’s power.
Consumption Habits (2002 ‐ 2009)
16,000
14,000
12,000
10,000
8,000
6,000
4,000
2,000
‐
Wellington
Wellington Wellington
Wellington Jupiter
Jupiter Jupiter
Jupiter Springs Coral Spring
Coral Spring Springs RoyalPalm
Royal Palm RoyalPalm
Royal Palm Weston
Weston Weston
Weston
(2002)
(2002) (2009-Inflation)
(2009 inflation (2002)
(2002) (2009-inflation
(2009 Inflation) (2002)
(2002) (2009-inflation
(2009 Inflation) Beach
Beach Beach
Beach (2002)
(2002) (2009-inflation
(2009 Inflation)
adjusted) adjusted) adjusted) (2002)
(2002) (2009-inflation
(2009 Inflation) adjusted)
adjusted)
Figure 2.14: Consumption Habits (2002 and 2009 U.S. Bureau of Labor Statistics)
24 Wellington Economic Inventory AnalysisConsumption Spending (2009 Inflation Adjsuted) Who can Wellington attract today and in the future?
Personal care products and services Wellington exists as part of the larger tri-county area of South
Apparel and services Florida. As such, like other municipalities around South
Household operations & maintenance Florida, Wellington is strongly influenced by regional
Food away from home conditions. In some areas, such as income and the apparent
economic wealth of a significant portion of its residents,
Food at home
Wellington differs from other cities in South Florida. For that
100%
6% 4% 3% 3% 3% 3% reason, Wellington not only contributes to, but also benefits
significantly from being part of a larger regional economy, and
90% 18% 15% 15% 15% 14%
15% therefore, plays an important role in the region’s economy.
80%
These characteristics highly influence the future residents of
Wellington; consequently, a detailed analysis was performed
70%
24% 29% 29% 29% 28% on the surrounding areas. These areas were defined creating a
33%
buffer around Wellington extended by a radius defined by
60%
heavy traffic conditions. The first study area includes the area
50%
defined by 30-minute HDR and the second area covers the
18% 16% 16% 16% 15% area in the 30 to 60-minute HDR.
18%
40%
By looking at the population and population density variables
in Census 2000 and 2010, we see that the area defined by 30-
30%
minute HDR around Wellington has grown tremendously in
20%
terms of population and has become increasingly diverse in
36% 37% 37% 37% 40%
39% the last 10 years. The population of this area has increased 28
10% percent in the last decade. We also find that the density of the
30-minute HDR area has increased from 1,858 per square mile
0% in 2000 to 2,390 per square mile in 2010 (Table 2.4).
Miami/Ft. Coral
Coral Weston Wellington Jupiter Royal Palm
Lauderdale Springs
Spring Beach
Area
Figure 2.15: Consumption Spending (2002 and 2009 U.S. Bureau of Labor
Statistics)
25 Wellington Economic Inventory Analysisthe 60-minute HDR of Wellington is becoming denser and
Population and Population Density of 30-Minute HDR around more populated.
Wellington, FL in 2000 and 2010
For the 30-minute HDR area, the male to female ratio stayed
Category 2000 2010 constant from 2000 to 2008 population totals. Median age for
males is 36.8 years and for females it is 39.8 years. For both
Area Population 329,897 424,353 2000 and 2008, the highest proportion age group consisted of
the 35-49 years age group. In this area, the data also shows
Area Density (per sq mile) 1,858.7 2,390.88
an extreme increase in the 50-64 year category by 2008
Table 2.4: Population & Population Density in the 30-Minute HDR (2000 and (Figure 2.16).
2010 U.S. Census)
Similarly, between 2000 and 2008, in the 30 to 60-minute HDR
The population of the 30 to 60-minute HDR area around area, the 50-64 age group had the highest increase by 30
Wellington has grown in the last ten years as well. The area’s percent (46,833 people). Persons from the 5-19 age group
population grew by 8.92 percent between 2000 and 2010. The also increased by 20 percent (34,138 people) (Figure 2.17).
area also became denser, with its population density rising
from 1,105.7 people per square mile in 2000 to 1,197.43
Population Pyramid
persons per square mile in 2010, or 91.73 more people per 30‐Minute HDR Area, 2000‐2008
square mile in 2010 than there were in 2000 (Table 2.5).
Male 2000 Male 2008 Female 2000 Female 2008
Population and Density Change in the 30 to 60-Minute Heavy
Traffic Drive Time Radius of Wellington, FL 2000-2010 65 and older
50 to 64
Category 2000 2010
35 to 49
Area Population 1,005,032 1,094,635 20 to 34
Area Density (Sq. Mile) 1,105.70 1,197.43 5 to 19
Table 2.5: Population & Population Density in the 30 to 60-Minute HDR Under 5
(2000 and 2010 U.S. Census)
60,000 40,000 20,000 0 20,000 40,000 60,000
Based on the upward trend of both the population count data Figure 2.16: Population Pyramid for the 30-Minute HDR Area around
and the population density data, it is clear that the area within Wellington, 2000-2008 (2000 U.S. Census and 2008 Claritas)
26 Wellington Economic Inventory AnalysisHousehold by Type in the 30‐Minute HDR Area
Population Pyramid around Wellington, 2000‐2008
30 to 60‐Minute HDR Area, 2000‐2008 2000 2008
Male 2000 Male 2008 125,000
Number of Households
100,000
65 and older
75,000
50 to 64
50,000
35 to 49
25,000
20 to 34
0
5 to 19 Family Households Non‐family Households
0 to 4
Figure 2.18: Household by Type in the 30-Minute HDR around Wellington,
‐150,000
150,000 100,000 ‐50,000
50,000 0 50,000100,000 150,000
50,000 150,000 2000-2008 (2000 U.S. Census and 2008 Claritas)
Figure 2.17: Population Pyramid for the 30 to 60-Minute HDR Area around A dissimilar trend of growth occurred in the 30 to 60-minute
Wellington, 2000-2008 (2000 U.S. Census and 2008 Claritas)
HDR area with the number of family households (22,431
Both the number of family households and non-family increase) having a higher net gain than the number of non-
households increased in the 30-minute HDR area around family households (18,509 increase). It is important to note
Wellington, although family households increased by a greater that with eight percent increase, family households grew at a
number (by 15,545; an 18 percent increase) than non-family slower rate than non-family households, which experienced 11
households (by 6,427; a 14 percent increase). Therefore, the percent increase between 2000 and 2008. This is the opposite
type of households containing families increased slightly in of the trend found in the 30-minute HDR area (Figure 2.19).
proportion. While the change in proportion may not be
significant, this finding could illustrate that the area around Household Type in the 30 to 60‐Minute HDR Area
Wellington may be attractive to families, especially when around Wellington, 2000‐2008
Number of Households
compared to the county distribution (Figure 2.18). 2000 2008
400,000
200,000
0
Family households Non‐family households
Figure 2.19: Household by Type in the 30-Minute HDR around Wellington,
2000-2008 (2000 U.S. Census and 2008 Claritas)
27 Wellington Economic Inventory AnalysisIn the 30-minute HDR area around Wellington, despite a
Annual Household Income in the 30‐Minute HDR Area
national economic recession, the number of families in each around Wellington, 2000‐2008
income group earning over $25,000 grew between 2000 and
2000 2008
2008. The greatest growth (in terms of percent change and
Number of Households
35,000
absolute change) occurred in the groups $75,000 to $99,999 30,000
25,000
and $100,000 or more). The number of families in the $15,000
20,000
to $24,999 group and the ‘less than $15,000’ group declined 15,000
between 2000 and 2008 (Figure 2.20). In this area, the median 10,000
5,000
household income increased by nearly 17 percent (to 0
Less 15,000 - 25,000 - 35,000 - 50,000 - 75,000 - 100,000
$47,853), and the average household income increased by 23 than 24,999 34,999 49,999 74,999 99,999 and
percent (to $63,907). It is important to note that the inflation 15,000 greater
Annual Income in Dollars
adjusted figures actually demonstrate a slight decline in 2008
in both median and average income compared to 2000. Figure 2.20: Annual Household Income in the 30 Minute Heavy Traffic Drive,
2000-2008 (2000 U.S. Census and 2008 Claritas)
While Palm Beach County had a higher median income
The estimated 2008 average income of the 30 to 60-minute
compared to the 30-minute HDR area around Wellington in
HDR area is higher than surrounding Broward County’s
2000, the median income in this area increased more than the
estimated average income of $71,771 and surrounding Palm
median income of the whole county by 2008 (both in terms of
Beach County’s average income of $80,537. This implies that
absolute amount and percent change).
the area is an affluent one in the region (Claritas, 2008; U.S
Incomes in the 30 to 60-minute HDR area around Wellington Census Bureau, 2000).
increased between 2000 and 2008. The average income by
As Figure 2.21 shows, the mid-point where annual incomes
household in 2000 for the area was $69,330 while in 2008, the
seemed to break even in the 30 to 60-minute HDR area is the
figure rose by 17.3 percent to $81,318. Likewise, the median
range from $35,000 to $49,999. There was a small increase of
income by household in 2000 was $45,047 while in 2008, the
3.3 percent from $68,672 in 2000 to $70,945 in 2008. The
figure rose by 21.3 percent to $54,637 (Claritas, 2008; U.S.
income range with the greatest number of wage earners in this
Census Bureau, 2000). Similar to the 30-minute HDR area, the
region during the year 2000 was $50,000 to $74,999 (18.4
inflation adjusted figures in 2008 demonstrate a slight decline
percent of total households). However, the income range with
in both median and average income compared to 2000 in the
the greatest number of households in 2008 was $100,000 and
30 to 60-minute HDR area.
greater (23.2 percent of total households) (Claritas, 2008; U.S.
Census, 2000).
28 Wellington Economic Inventory AnalysisYou can also read