BUILDING SAFE AND AFFORDABLE HOUSING DIGBY COUNTY - Housing: Now and Into the Future - Digby and Area ...
←
→
Page content transcription
If your browser does not render page correctly, please read the page content below
Housing: Now and Into the Future

BUILDING SAFE AND AFFORDABLE HOUSING
                        DIGBY COUNTY
                                                          Released May 2018

           Building Safe and Affordable Housing – Digby County   1
S h elbur n e Y a r m o u t h D i g b y A n n a p o l i s K i n g s W e s t H a n t s
R ep o r t P r ep a r ed b y : Den i s e Va c o n , N a n c y G r een , Jen n i f er L a mr o c k , L i s a S a l l y , N a n c y S t ew a r t
AN I NI T I AT I VE O F O U R LO CAL H O U S I NG FU ND E RS
CO ALI T I O NS AND S T AK E H O LD E RS
Canada Mortgage and Housing Corporation (CMHC)
Affordable Housing Association of Nova Scotia (AHANS)
Nova Scotia Advisory Council on the Status of Women
The following Town and Municipal Units
Municipality of Barrington
Town of Shelburne
Municipality of Shelburne
Town of Lockeport
Municipality of the District of Argyle
Municipality of the District of Yarmouth
Town of Digby
Municipality of the District Digby
Municipality of the District of Clare
Town of Annapolis Royal
Municipality of Annapolis
Municipality of Kings
Town of Wolfville
Town of Berwick
Town of Kentville
Including Women’s Place Resource Centre and Town of Windsor
Annapolis Valley Poverty Coalition Municipality of West Hants
ACK NO W LE D G M E NT S
We would like to acknowledge the collaborative efforts of all who supported the development and implementation of
Housing: Now and Into the Future. This project was made possible because of the commitment of our community
partners, the financial support of our funders, and the participation of all who completed the surveys and shared their
stories at community engagement sessions. Without the incredible response from our communities’ efforts to support
survey distribution through one-on-one supports, home visits, and dedication to giving voice to the housing challenges
our communities face, we would not have been able to achieve this success.
This project makes a significant contribution to our understanding of the diverse and complex housing needs of our
communities, and will support the ongoing efforts of our community coalitions and partners to bring attention to the
issues of affordable housing and poverty that impact many individuals across our rural communities. No single action is
needed to address the challenges facing our communities related to housing. It is our hope that the collaboration and
partnership demonstrated throughout this process will continue as we move towards action. As we have learned
through this process, we will move farther together!
Building Safe and Affordable Housing – Digby County 2
Table of Contents
List of Figures, Charts & Tables ......................................................................................................................5
Executive Summary: Building Safe and Affordable Housing ...........................................................................6
Housing Needs Assessment ..........................................................................................................................8
   The Purpose of the Housing Needs Assessment ..........................................................................................8
   The Expected Benefits ...............................................................................................................................8
   The Scope of the Project ............................................................................................................................8
   Needs Assessment Response .....................................................................................................................9
Introduction ............................................................................................................................................... 11
   Why Focus on Building Affordable Housing ............................................................................................... 12
Population Demographics (2016 Census Data) ............................................................................................ 14
   Population Distribution by Municipal Units ............................................................................................... 14
   Age Distribution of the Population ........................................................................................................... 15
   Population Projections ............................................................................................................................ 17
   Median Income ....................................................................................................................................... 19
Household Demographics (2016 Census Data) ............................................................................................. 20
   Size and Type .......................................................................................................................................... 20
Needs Assessment Results.......................................................................................................................... 21
   Finding Suitable Housing.......................................................................................................................... 21
   Planning To Move ................................................................................................................................... 23
   Age of Movers......................................................................................................................................... 24
   Household Size of Movers and Renters ..................................................................................................... 25
   Income of Movers and Renters ................................................................................................................ 26
   Housing Costs ......................................................................................................................................... 27
   Building and Maintaining Affordable Housing ........................................................................................... 29
   Social Housing Programs.......................................................................................................................... 32
   Emergency Housing ................................................................................................................................. 35
   Supportive Housing ................................................................................................................................. 35
   Additional Supports ................................................................................................................................. 37
   Ideal Next Residence ............................................................................................................................... 38
   Reason for Moving .................................................................................................................................. 41
   Important Rental Features – Number of Bedrooms ................................................................................... 42
   Important Rental Features - Amenities ..................................................................................................... 44

                                                                         Building Safe and Affordable Housing – Digby County                     3
Important Rental Features - Accessibility .................................................................................................. 46
Community Engagement Themes................................................................................................................ 47
   Financial ................................................................................................................................................. 47
   Societal Responsibilities........................................................................................................................... 48
   Rules and Regulations ............................................................................................................................. 49
   Other Considerations .............................................................................................................................. 50
Opportunities for Action; Conclusions and Recommendations ..................................................................... 51
   Housing as a Human Right ....................................................................................................................... 51
   Affordable Housing as Economic Development ......................................................................................... 55
   Creating Partnerships .............................................................................................................................. 56
   Planning Beyond Zoning .......................................................................................................................... 58
   Housing First Supports............................................................................................................................. 62
   The Big Picture ........................................................................................................................................ 63
Appendix 1: Grants and Programs ................................................................................................................ 64
References ................................................................................................................................................. 66

                                                                          Building Safe and Affordable Housing – Digby County                     4
List of Figures, Charts & Tables
Figure     1: Housing Continuum ............................................................................................................................................. 11
Figure     2: Average monthly cost of housing someone while homeless...................................................................... 13
Figure     3: Age Breakdown – Digby County........................................................................................................................ 15
Figure     4: Rental Availability ................................................................................................................................................. 20
Figure     5: Affordability Targets ............................................................................................................................................ 28
Figure     6: Housing and Health ............................................................................................................................................. 53
Figure     7: The Spectrum of Prevention .............................................................................................................................. 54
Figure     8: Healthy Built Environments .............................................................................................................................. 59
Figure     9: Ending Homelessness .......................................................................................................................................... 62

Chart 1: Age Breakdown by Municipal Unit .................................................................................................................... 14
Chart 2: Historical Change in Population from 2006-2016 .......................................................................................... 17
Chart 3: Population and Household Projections............................................................................................................. 17
Chart 4: Median Household Income ................................................................................................................................. 19
Chart 5: Percentage of Population by Income Bracket - Digby County ..................................................................... 19
Chart 6: Household Size....................................................................................................................................................... 20
Chart 7: Types of Dwellings................................................................................................................................................. 20
Chart 8: Ease of Finding Housing ....................................................................................................................................... 21
Chart 9: Desire to Stay Close to Current Community .................................................................................................... 22
Chart 10: Percent Planning to Move - Municipality of Clare ....................................................................................... 23
Chart 11: Percent Planning to Move – Digby Town & Municipality ........................................................................... 23
Chart 12: Age of Movers - Digby County .......................................................................................................................... 24
Chart 13: Dependants of Movers....................................................................................................................................... 24
Chart 14: Household Size of Movers and Renters ........................................................................................................ 25
Chart 15: Income Brackets of Renters and Movers ...................................................................................................... 26
Chart 16: Income Distribution Under $40,000................................................................................................................ 26
Chart 17: Importance of All-Inclusive Rents ................................................................................................................... 27
Chart 18: Additional Supports Needed to Stay at Home ............................................................................................. 37
Chart 19: Ideal Next Residence of Those Planning to Move ........................................................................................ 38
Chart 20: Ideal Next Residence for Youth ........................................................................................................................ 39
Chart 21: Ideal Next Residence for Adults ....................................................................................................................... 39
Chart 22: Ideal Next Residence for Seniors ..................................................................................................................... 40
Chart 23: Reason for Moving .............................................................................................................................................. 41
Chart 24: Number of Bedrooms Required ....................................................................................................................... 43
Chart 25: Number of Bedrooms by Group Affiliation .................................................................................................... 43
Chart 26: Requested Rental Features ............................................................................................................................... 44
Chart 27: Accessibility Units................................................................................................................................................ 46
Chart 28: Safety and Accessibility Features ..................................................................................................................... 46

Table 1: Target Affordability Based on Incomes ............................................................................................................. 28
Table 2: Waitlist for Social Housing by Municipal Unit ................................................................................................. 33

                                                                                       Building Safe and Affordable Housing – Digby County                                  5
EXECUTIVE SUMMARY
Executive Summary: Building Safe and Affordable Housing
Throughout the fall of 2017 and winter of 2018 the “Housing: Now and Into the Future” needs assessment was
conducted across Shelburne, Digby, Yarmouth, Annapolis, Kings and West Hants Counties in Nova Scotia. The
assessment was a collaborative effort among local housing coalitions, community partners and municipal units
with the purpose of:
Increasing knowledge of affordable and supportive housing needs and issues;
Engaging the community to better understand the local housing situation;
Generating reports with current data on housing needs relevant to our communities that can be used
for planning, service delivery, and funding proposals;
Documenting the housing needs of all citizens including vulnerable populations (women leaving
domestic violence, youth, seniors, LGBTQ, persons with disabilities, people experiencing homelessness) .
This report presents findings from the assessment which examines issues related to building safe and affordable
housing in our communities.
Affordable housing includes housing provided by the private, public and not-for-profit sectors as well as all forms
of housing tenure (i.e. rental, ownership and cooperative ownership). 2 Housing is a key element to the social and
economic sustainability of all communities.1,7 A diverse housing supply can cater to different types of residents
and offers a broad array of choices.1 Providing accessible, affordable and appropriate housing is essential to
community viability.
The information compiled in this report is intended to help communities better understand the current and
emerging housing needs and to provide municipalities and builders with relevant housing data for planning and
development purposes.
Key findings (Digby County)
53% of renters have difficulty finding housing that meets their needs.
80% of survey respondents indicated it was important to stay close to where they currently live.
34% of those surveyed indicated they were planning to move.
Most movers were adults, aged 26-49.
44% of movers indicated they had dependants, most of whom were children.
Average household size of those renting was estimated at 2.2 people per household.
90% of renter households indicated incomes under $40,000 per year.
90% of renters say all-inclusive rents are important.
Based on incomes, target rents to meet affordability criteria would range between: $300-$650 plus
utilities or $625-$1000 all-inclusive.
Building Safe and Affordable Housing – Digby County 6
64% of builders say having grants to build or renovate affordable units would be helpful.
Top 3 supports needed to help people stay housed: snow removal and lawn care, help with basic home
repairs, being able to be closer to family and friends.
Significant demand for rental accommodation across all age groups, current rental dwelling make up less
than 20% of housing tenure in Digby County.
66% of those planning to move indicate they require 2 or 3 bedrooms. The number of bedrooms
required is consistent across all groups, including seniors.
Top 5 rental features requested were; washer and dryer, high speed internet, storage space, pets
allowed, clothesline.
25% of movers require accessibility features.
Community residents need safe and affordable housing, and they need it in order to work, to continue to
contribute to the economy, and to avoid the risk of becoming homeless. 7 Alongside robust publically-owned
social housing supports, increased infrastructure funding, easy to access programs, legislative changes and
supportive policies that help the private and not-for-profit sectors fill market and non-market housing gaps could
benefit our rural communities. In addition, small rural municipalities often require assistance to recognize their
role and/or use their assets in creating affordable housing and often tenants require supports to stay
successfully housed as outlines in the Precarious Housing and Homelessness Report.6
Recommendation 1: Recognize affordable housing as Recommendation 4: Develop partnerships with
a critical component of a healthy community and builders and stakeholders to increase both
apply a human rights lens to housing challenges. affordable housing infrastructure and supportive
services that allow people to stay successfully
Recommendation 2: Use the Spectrum of Prevention
housed in their communities, close to their social
to address housing issues as a means to create
support networks.
healthy communities.
Recommendation 5: Determine how new and
Recommendation 3: Understand the economic and
existing policies and bylaws impact affordable
employment payoffs of affordable housing and
housing and identify ways to promote safe and
work collaboratively to actively promote the
affordable housing development through the design
benefits of economically diverse neighbourhoods
of healthy built environments.
and address identified gaps along the housing
continuum.
The proposed recommendations are achievable through
collaborative efforts from builders, municipal leaders, and
community stakeholders invested in creating healthy rural
communities. Together, with commitments from all levels of
government, everyone can have a safe and affordable place
to call home.
Building Safe and Affordable Housing – Digby County 7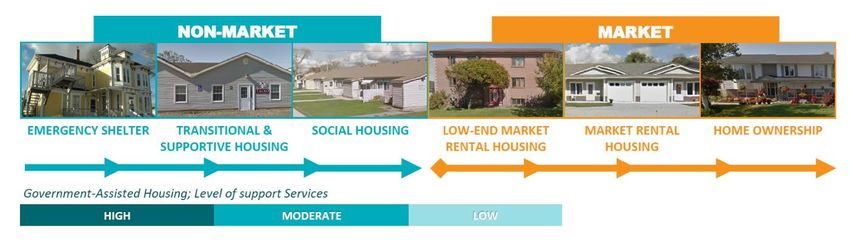
Housing Needs Assessment
In 2017, housing coalitions invited community stakeholders to explore interest in conducting a housing
needs assessment across Shelburne, Yarmouth, Digby, Annapolis and Kings Counties. The region of
West Hants later joined our efforts.
A steering committee comprised of members from each of the housing coalitions and other interested
community stakeholders co-developed the project proposal. Based on an analysis of available housing
data, known gaps in information and best practices/research, the project’s purpose, scope and
approach were developed.
The Purpose of the Housing Needs successfully housed in their community of
choice close to their social support
Assessment networks.
To increase our knowledge of affordable Support the community to meet the
and supportive housing needs and issues. housing needs of seniors, youth, single
To engage the community to better parents, women requiring second stage
understand the local housing situation. housing, persons with accessibility needs,
persons with mental health or addiction
To generate reports with current data on issues and persons with lower incomes.
housing needs relevant to our communities
Provide knowledge and research to support
that can be used for planning, service
delivery, and funding proposals. a shift from a crisis response to one that
emphasizes prevention.
To document the housing needs of all our
citizens including vulnerable populations The Scope of the Project
(women leaving domestic violence, youth,
seniors, LGBTQ, persons with disabilities, Survey the general public, service providers,
people experiencing homelessness). and stakeholders/developers to understand
current and emerging housing needs across
The Expected Benefits 20 municipal units.
Gain a better understanding of the housing Gather first voice stories and perspective
needs and challenges faced by people in regarding housing needs from the general
public, vulnerable populations, services
our community.
providers, stakeholders/developers though
Inform municipalities, builders, service community engagement sessions.
providers and others about what would
Analyse the collected housing data
help people find and keep the housing
they need. Make recommendations for action
Identify and document the supports needed Generate reports as needed
for vulnerable populations to be
Building Safe and Affordable Housing – Digby County 8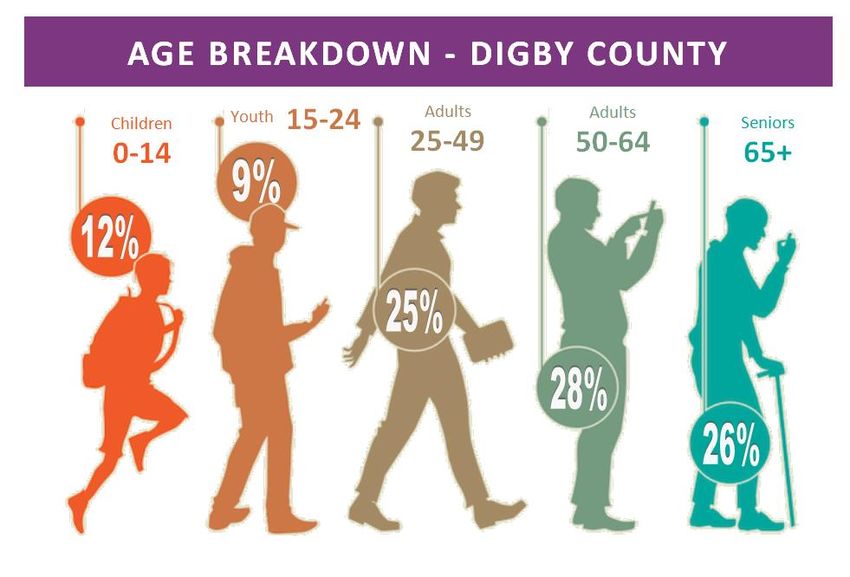
Needs Assessment Response
Three separate surveys were developed to collect                meet minimum population requirements for data
information, one for each of the three identified               analysis, as defined by the housing coalitions.
target audiences: the general public (any resident of
                                                                A total of 4,699 people responded to the housing
the needs assessment area); service providers and
                                                                needs assessment survey; 97.5% indicated where
community volunteers (anyone providing supports
                                                                they lived (n=4,581). Overall, 10% were youth under
and services to those facing housing challenges);
                                                                25, 72% were adults (26-64), and 18% were seniors
and stakeholders (includes property owners,
                                                                over 65. The majority of respondents were female
landlords, contractors, developers, real estate
                                                                (78%), with 21% identifying as male and the
agents and others). Both qualitative and
                                                                remaining 1% indicating they identified outside the
quantitative data was gathered.
                                                                gender binary (transgender, gender variant, non-
Community engagement sessions were also held to                 conforming, prefer not to say, or prefer to self-
gather additional qualitative data; One general                 describe).
community engagement session was held in each
                                                                A total of 36 Stakeholders (property owners,
county across the needs assessment area; Two
                                                                landlords, realtors, contractors or property
targeted community engagement sessions were
                                                                managers) responded to the stakeholder survey. A
held in each county across the needs assessment
                                                                total of 134 service providers responded to the
area; Two service provider / stakeholder community
                                                                service provider survey. Overall, 213 people
engagement sessions were held, one in the Valley
                                                                participated in 18 Community Engagement sessions
and one in the Tri-County area.
                                                                held across the 6 counties and provided feedback
The needs assessment target area covered 20                     on housing in their communities.
municipal units and 6 counties across Western Nova
                                                                The surveys are available for download from the
Scotia. Counties were grouped into Geographic
                                                                coalitions’ shared website:
Areas (Valley and Tri-County). Municipalities from
                                                                http://www.daashgroup.com. The report on
counties were grouped together into Geographic
                                                                Precarious Housing and Homelessness across our
Partnerships. Geographic Partnerships were formed
                                                                Rural Communities provides additional information
between some municipal units to share costs and
                                                                on methodology and limitation of this study and is
                                                                also available for download from the website.6

                                                        Building Safe and Affordable Housing – Digby County   9
Building Safe and Affordable Housing – Digby County 10
Building Safe and Affordable Housing – Digby Co.

Introduction
An efficient and well-functioning housing sector enables the marketplace to be the primary vehicle to
meet the shelter needs of Canadians. 1 However, not all members of society have the financial means to
compete effectively in the housing market, nor is the marketplace necessarily able to meet distinct
housing needs of some groups. For those households whose needs cannot be met by the marketplace,
governments, community organizations, non-profit cooperative groups and the private sector often
work together to provide affordable housing solutions.

In Canada, housing is considered affordable if shelter costs account for less than 30 per cent of before-
tax household income.2 The term "affordable housing" is often used interchangeably with "social
housing"; however, social housing is just one category of affordable housing and usually refers to rental
housing subsidized by the government.
Affordable housing is a much broader term and includes housing provided by the private, public and
not-for-profit sectors as well as all forms of housing tenure (i.e. rental, ownership and cooperative
ownership).2 It also includes temporary as well as permanent housing. In other words, the term
"affordable housing" can refer to any part of the housing continuum from temporary emergency
shelters through transition housing, supportive housing, subsidized housing, market rental housing or
market homeownership.
                                         Figure 1: Housing Continuum

Core housing need is the term used to determine the extent to which housing insecurity is an issue for
households in a community.1 This standard is defined by the Canadian Mortgage and Housing
Corporation (CMHC) and identifies a household as being in core housing need if it falls below at least
one of the adequacy, affordability or suitability standards and would have to spend 30% or more of its
before before-tax income to find alternative local housing that is accesptable.2

                                                 Building Safe and Affordable Housing – Digby County   11
• Adequate housing does not require any major repairs, as
reported by residents. Housing that is inadequate may have
excessive mold, inadequate heating or water supply, significant
ADEQUATE damage, etc.
AFFORDABLE • Affordable dwellings cost less than 30% of total before-tax
SUITABLE household income. Includes rent or mortgage and housing
related costs and expenses (e.g., heat, electricity, taxes, etc.).
• Suitable housing has enough bedrooms for the size and
composition of the resident household, according to National
Occupancy Standard (NOS) requirements.
Ensuring safe and affordable housing options along the housing continuum is crucial for an efficient
and well-functioning housing sector.1 To maintain healthy, livable and sustainable communities,
residents must have a selection of attainable housing options for all ages and needs. Communities that
promote integrated, affordable housing choices through the design of their built environments, by
encouraging safe and affordable housing development and promoting integrated rental, subsidized and
market housing options, can break down the social conditions that contribute to poor health and
economic outcomes.3,4,5
Why Focus on Building Affordable Housing
Housing is a key element to the social and economic sustainability of all communities. 1,7 A diverse
housing supply can cater to different types of residents and offers a range of accessible, affordable and
appropriate housing options across the lifespan. 1 The Housing Now and Into the Future needs
assessment has identified a number of the challenges our communities encounter with respect to
housing, including: unaffordable housing costs; aging housing stock; and changing housing needs. The
report on Precarious Housing and Homelessness across our Rural Communities indicated that 40% of
survey respondents experienced housing insecurity and that this, and core housing need, continues to
be an issue placing many residents at risk for homelessness. 6 This data indicates that housing costs are
more than many can afford.
When we grow housing we grow the economy. 7 The magic figure of 30 per cent of income is the
maximum people should be spending out of their income on housing needs in order to meet
affordability criteria. Spending more than this amount straps households; the necessities of food,
clothing, medication, transportation and the ability of residents to engage in the social and economic
lives of their community falls by the wayside. In addition to affordability, availability of suitable rental
housing to meet the needs of our changing demographics is a crucial component of the housing
market. For many rural communities, the availability of suitable rental accommodations is limited and
is forcing residents to move in order to find suitable housing.42
Building Safe and Affordable Housing – Digby County 12From an economic perspective, the reality of the labour market it that some people make lower wages
than others, yet are critical to our labour pool. 7 These workers and community residents need
affordable housing, and they need it in order to work, to continue to contribute to the economy, and to
avoid the risk of becoming homeless.
New affordable housing opportunities that increase and protect affordable housing stocks and aim to
create mixed, diverse communities are essential to our economy. 7 Partnerships that create
opportunities and conditions for affordable housing could include, unlocking land – with a look at
federal, provincial and municipal policies; removing barriers to change; exploring design and innovation
in mixed use or modular construction; keeping running costs for operation and maintenance affordable
and as low as possible; as well as, barrier-free financing.7,8
Overall, healthy neighbourhoods need a mixture of rental and ownership opportunities, as well as
market, non-market and social housing options.1 Municipal governments play a crucial role in what
housing is developed and how it is distributed across neighbourhoods. For example, planning, either
deliberate or inadvertent, which results in a concentration of low-income housing in certain areas
because it is effectively prohibited or discouraged elsewhere in the municipality can lead to
neighbourhoods that are stigmatized, resulting in social exclusion and instability. 8
There is also another side to addressing insecure housing and homelessness that has implications for
the economy: the expenditure of tax dollars to band-aid solve chronic problems.7, 42 The cost of social
services, of mental health interventions, in some cases prison, of emergency rooms, hospital stays, and
other physical and mental rehabilitation programs definitely adds up. 43 These are social tax dollars that
we all pay out to address the
problem of housing
insecurity and homelessness.
By shifting our focus to
prevention and solutions, we
build better communities,
re-direct tax dollars to more
effective programs that have
long-term impacts, and
overall, improve the business
and residential environment
for everyone.
An important first step in taking action is understanding the emerging and current housing needs of
our communities. This report provides local municipalities and builders with relevant housing data
from the Housing Now and Into the Future needs assessment survey, community engagement
sessions, and data from the 2016 Census of Canada, to support planning and development activities. A
similar report is available for each of the six counties that have participated in the Housing: Now and
Into the Future needs assessment.
Building Safe and Affordable Housing – Digby County 13Population Demographics (2016 Census Data)
Population Distribution by Municipal Units
Chart 1: Age Breakdown by Municipal Unit
2016 Census Data9
Municipality of Clare Municipality of Digby Town of Digby
35%
30%
25%
20%
15%
10%
5%
0%
Children 0-14 Youth 15-24 Adults 25-49 Adults 50-64 Seniors 65+
Building Safe and Affordable Housing – Digby County 14Age Distribution of the Population
Age trends impact housing demand.
Ensuring new housing construction
has the capacity to meet changing
needs will strengthen the housing
market and protect valuable
housing infrastructure.10 Building
sustainable housing means building
for the lifespan, not just a specific
group (e.g., seniors). Without
sufficient planning, building an
abundance of one-bedroom seniors’
apartments today is likely to result
in an overabundance of unsuitable
housing requiring major renovations
in 20 years when seniors no longer
make up such a large portion of the
population. In general, sustainable homes have three key elements:10
1. Environmental Sustainability: The house is designed to reduce greenhouse gas emissions, save
water and energy and reduce waste during construction and over the house’s lifetime.
2. Social Sustainability / Universal Design: The house is designed to prevent injuries through built-in
safety features. It has security elements to reduce crime and improve the occupants’ sense of
security. Features are also used to provide flexibility and comfort for people of varying abilities
and at different life stages, including children and people with limited mobility.
3. Economic Sustainability: The house is designed to save money during construction and over the
lifetime of the house. Careful planning avoids the need for major future renovations and
reduces costs associated with energy use, water use and maintenance.
Not so long ago, housing professionals thought almost exclusively about the housing needs and
preferences of families with children. 11 Now they need to understand the needs and preferences of
several different household types, not just for housing construction, but for refitting current homes to
meet changing needs. For example, addressing requirements for post-child-rearing household
configurations to avoid a move from a cherished home or valued neighborhood. One clear implication
is the need to build flexibility into new or existing housing construction to accommodate a variety of
uses. Some builders are already designing spaces that can serve equally well as home offices or foster
semi-independent living (for younger or older family members) before, after, or instead of housing
children.11 Doing this effectively requires adapting basic processes—for instance, thinking through
plumbing and other key structural features with an eye to potential modifications, either by the same
or subsequent residents.
Building Safe and Affordable Housing – Digby County 15The inability of today’s housing market to respond quickly to changing population demographics and
needs has resulted in a lack of suitable housing infrastructure across our rural communities. With
limited rental options available many, including seniors, are either staying in homes that are too big or
difficult for them to maintain or moving to more “urban or town” centers despite preferring to stay in
their community close to their family and friends. Similarly, without proper planning into the future,
meeting the immediate need could result in housing that is not suitable for the next generation.
An ongoing challenge for many communities relates to the lack of appropriate housing options for
seniors wanting to age in place. CMHC reports that about 85% of Canadians over 55 years old want to
remain in their present home for as long as possible, even if there are changes in their health. 12 Data
from the Housing Now and Into the Future needs assessment echoes this, with 80% of seniors
indicating that if they had to move it is important for them to stay housed close to the community
where they currently live.
Meeting the demand to keep seniors housed in their present homes means addressing common
barriers, and requires adaptations to existing housing, home maintenance, and support services
(including personal care) not only from family, friends and neighbours, but also from government and
private service providers.12 This preference, and the preference to stay in their current community, also
means providing a full continuum of housing choices in terms of location, forms of housing, types of
tenure, living arrangements and a range of support services that allow older adults to continue to live
independently and participate in their community for as long as possible.
A Special Senate Committee on Aging report outlined current barriers to aging in place, including the
cost of retrofitting seniors’ homes to install features such as grab bars and stair lifts. 13 Aging in place
may be inappropriate for seniors living in older structures that require extensive ongoing maintenance.
Newer forms of housing that do not require frequent repairs and that can easily be fitted with supports
as their residents age may be a more comfortable choice. Overall, the best way of looking at aging in
place is to consider that all housing providers are, in a sense, providing housing for seniors, if not
immediately, then in the long term. Ideally, all housing units should be adaptable as its’ residents age
or experience mobility challenges.12, 41
Smart technology is another area of consideration for housing providers. 12 Smart technologies for aging
are being development to provide everything from wireless home monitoring systems to assistive
robotics to support those who want to stay in their homes. Given that baby boomers and upcoming
generations are more comfortable with technology than previous generations of seniors, and have
higher expectations for smart technologies that offer convenience, safety and connectedness,
developers will benefit from staying abreast of growth in this area.
Building Safe and Affordable Housing – Digby County 16Population Projections
Chart 2: Historical Change in Population from 2006-2016
(Digby, Yarmouth and Shelburne Counties)
40%
30%
30%
20%
10%
4%
0%
-10% -7%
-20%
-23%
-26%
-30%
Total Change Under 20 yrs 20-44 yrs 45-64 yrs 65+ yrs
Chart 3: Population and Household Projections
Digby County - 2022, 2027
(Obtained from WREN March 2018)
1.0%
0.0%
2022 Total 2027 Total
-1.0% number of number of
Predicted Percent Change
households households
-2.0%
-3.0%
-4.0%
2022 Total
-5.0% population
-6.0%
-7.0%
-8.0%
2027 Total
-9.0% population
Building Safe and Affordable Housing – Digby County 17In terms of the overall population, Charts 2 and 3 illustrate that both historical and future population
predictions show an overall decrease in the total population for our surrounding communities.
Correspondingly, the total number of households is increasing as the types of households are changing.
The market for housing is influenced by many factors including: the demographic characteristics of the
population (such as age structure, patterns of family relationships; the spatial distribution of the
population); economic determinants (such as incomes and the prices of land, dwellings/structures,
transportation, and other factors); and institutional constraints (such as zoning restrictions). 11
Economic research suggests that households are a better predictor of changes in housing demand than
population and that age structure is changing household composition. 11 In particular, household size is
shrinking, as married couples without children (in the home) and single-person households begin to
outnumber “traditional family” households. Among other things, this trend is challenging old
assumptions about age-based choices for housing options.
These changes suggest a need for research to help housing professionals manage their response to
changing demographics and community needs.11 Specifically to:
1. Discover what the growing household segments—largely without children in the home— really
want from housing, and modify assumptions accordingly.
2. Understand the relationship between household composition and housing preferences of
specific groups.
3. Develop an understanding of the relationship between household income, household
composition, and housing, especially in relation to life stage, with particular attention to
ownership issues.
A review of additional Census Data on income and household demographics as well as the results of
the Housing: Now and Into the Future needs assessment survey should help to provide some context
on these issues as housing planning progresses across our rural communities.6,9
Building Safe and Affordable Housing – Digby County 18Median Income
Chart 5: Percentage of Population by Income Bracket - Digby County
(2016 Census Data: Annual Average Income of Individuals Age 15 and Over) 9
35%
34%
30%
Population Percentage
25% 27%
20%
15% 18%
14%
10%
5% 7%
1%
0%
Building Safe and Affordable Housing – Digby County 19Household Demographics (2016 Census Data)
Size and Type
Chart 6: Household Size
(2016 Census Data, Private Household by Size)9
1 person 2 or 3 persons 4 or more persons
100%
12% 9% 13% 12%
90% 16%
80%
70% 46%
60% 57% 57% 59%
54%
50%
40%
30%
45%
20%
30% 31% 30% 29%
10%
0%
NS Digby Co. Town Municipality Clare
Chart 7: Types of Dwellings
(2016 Census Data - Total Private Households)9
Movable Dwellings Semi-detached/Row/Duplex
Apartments Single Detached House
100%
7% 4%
10% 2%
90% 4%
27% 7% 34%
80%
70%
60% 18%
26%
50%
87% 92%
40% 81%
30%
52%
20% 40%
10%
0%
Building Safe and Affordable Housing – Digby County 20Needs Assessment Results
Finding Suitable Housing
Chart 8: Ease of Finding Housing
(Needs Assessment Data, Digby County)
Difficult Neutral Easy
100%
90%
25%
31%
80%
48%
70%
22%
60%
29%
50%
40% 25%
30%
53%
20% 40%
27%
10%
0%
Movers Renters Overall
More than half of those who rent indicated that they had difficulty finding a suitable home that met
needs. Similarly, movers (which could include renters and home buyers) also expressed difficulty
finding accommodations that met their needs. Of the 336 respondents in Digby County who indicated
having difficulty finding housing;
39% indicated that there were not enough rentals they could afford;
24% could not find a suitable place to rent;
20% indicated that there weren’t enough of the kind of housing they needed (e.g.,
accessible, seniors, co-op, assisted living, subsidized);
9% could not find a suitable house to buy
Affordability and availability challenges represented the main reasons respondents indicated that it was
hard for them to stay where they were or to find housing. 6 Rent, heat and lights, a down payment or
housing repairs comprised most of the indicated affordability challenges. Affordable rental availability
and finding suitable accommodations were identified as availability challenges. For almost a third of
respondents, suitability was a challenge, indicating that the size of their housing did not meet their
needs.
Building Safe and Affordable Housing – Digby County 21As indicated above in Chart 7: Types of
Dwellings, it is clear that rental availability
across Digby County is very limited. Only 7% of
current housing tenure are apartments and
overall, only 19% of dwellings are rented. The
greatest proportion of rentals are located in
the Town of Digby where 49% of dwellings
Chart 9: Desire to Stay Close to Current
are rented. Although this is often associated
Community (Digby County n=514)
positively with a need to be closer to services
it does mean that for anyone wanting to stay
in outlying communities their ability to do so
Not
is compromised due to availability. In important,
addition, safety and social connections were 19%
Very
identified as key supports that would help important,
people stay successfully housed in their 45%
community. Somewhat
important,
Survey respondents across all age groups 36%
expressed very clearly (80%) that if they had
to move, they wanted to stay close to where
they currently lived.
Increasing rental availability across Digby County
would provide opportunities for people to stay “There’s too much red tape. With bank
housed in their community of choice, close to criteria and then Housing criteria… why
social support networks, but may also require bother? It’s easier to just get a mortgage,
planning to ensure adequate access to have one criteria and then rent it to who
transportation and services (stores, medical, and you want to rent it to. And you can charge
grocery). With respect to transportation, for a rural what you want. There are enough seniors
community, Digby County has made significant out there that I can rent at $1000/month.
strides towards ensuring transportation access; Why wouldn’t I just do that?
King’s Transit and Transport de Clare offer Community Engagement and Survey Respondent Comments
significant coverage to residents of the area and
have a capacity not seen in other rural
communities. Ensuring rental units are in close proximity to these routes is a crucial part of planning.
The need to address the shortage for affordable rental housing options across the county is clear. In
some communities, success has been seen developing high-end (above-market rent) apartments
targeting an affluent segment of the population, with units filling up before construction has started.
However, many people in the community still require affordable rental housing options. Given the
demand on the market for more lucrative housing developments, it is unlikely that property owners
will choose to develop affordable rental options, without incentives or requirements. Thus, the market
Building Safe and Affordable Housing – Digby County 22is unlikely to meet the needs of its most vulnerable populations. As previously indicated, for the
economic health of our communities and the overall well-being of residents, conditions must be
created to ensure mixed and diverse neighbourhoods are developed for all.
Planning To Move
Chart 10: Percent Planning to Move Chart 11: Percent Planning to Move
Municipality of Clare Digby Town & Municipality
(Housing Needs Assessment Data, 2018 n=265) (Housing Needs Assessment Data, 2018 n=273)
I am looking for a place I am looking for a place
to live right now, 6% to live right now, 8%
I am not
In less than 1 planning to
move, 50% In less than 1
year, 5%
I am not year, 10%
planning to
move, 63% In 1 to 5
years, 18%
In 1 to 5 years,
21%
In 5 or more years, 8%
In 5 or more years, 11%
According to Statistics Canada, 2016 Census Mobility Data the estimated proportion of the population
having moved within one year of the reference data was 10%, this percentage rose to 24% when
referencing whether the person lived in the same residence over the last 5 years. 9 Although most
survey participants indicated that they did not plan to move, a greater proportion indicated they were
considering a move compared to the numbers reported in a 5 year period by Statistics Canada. Across
Digby County, approximately 34% of survey respondents indicated they were planning to move (235 of
701 respondents).
For the Municipality of Clare, 77% of survey respondents answered the question regarding their
intention to move. Most, 63% were not planning to move and 98 respondents (37%) indicated they
were considering a move. Seventy-nine individuals did not respond to the question and were excluded
from the calculation. Most people planning to move, thought they would do so within the next 1 to 5
years. For the Digby Area (Town of Digby and Municipality of Digby), 76% of survey respondents
answered the questions regarding their intention to move. Compared to Clare, a greater proportion of
people indicated they were planning to move, 50% (137 people). Eighty-four individuals did not
respond to the question and were excluded from the calculation.
One limitation of this data is that, people with housing related challenges may have been more
motivated to respond to the survey and more likely to be considering a move than would be the case
across the general population. In addition, given the limited availability of housing options, there is
discrepancy between wanting to move and actually being able to find a suitable place.
Building Safe and Affordable Housing – Digby County 23When housing security was considered, those respondents indicating they were securely housed were
most likely considering a move in 5 years or more. Insecurely housed individuals were almost always
looking for a place to live right now (91%, Digby / 93%, Clare).
Age of Movers
Survey respondents of all age groups
Chart 12: Age of Movers - Digby County
indicated an intention to move. Adults aged (Needs Assessment Data n=233)
26-49 represented the largest portion of
Youth (15-25) Adult (26-49) Adult (50-64) Senior (65+)
those surveyed who were considering a move.
Almost two thirds of movers are adults
between 26 and 64 years. Additional Senior (65+) Youth (15-25)
information on their moving needs is provided 20% 19%
further in the document under the section
“Ideal Next Residence”.
Adult (50-64)
23%
As household types change from preferences Adult (26-49)
38%
of families and children to accommodating
the needs of post-child-rearing households it
will be important to ensure a range of flexible
options. In Digby County, for those
respondents who indicated that they were
planning to move (235), 44% (104) indicated Chart 13: Dependants of Movers
Needs Assessment Data (n=104)
they have dependants living with them that
relied on them for support. The majority of
these dependants were children, 73%. Twenty Seniors
percent indicated they cared for adult 9%
dependants and 9% had senior dependants Adults
that relied on them for support. 18%
Children
73%
Building Safe and Affordable Housing – Digby County 24Household Size of Movers and Renters
The average number of people living in households is gradually decreasing. 9 Across the general
population, the average household size for Digby County is 2.1 people. When looking at renters and
movers across the county, the average number of people per household is slightly larger for these two
groups compared to the general population. The proportion of renters and movers by household size is
illustrated in Chart 14. Approximately 40% of renters are one-person households, however, as
indicated in the “Important Rental Features” subsection, this alone is not an indication of desired
bedrooms per unit required. Despite household size, most respondents indicated the need for 2 or
more bedrooms. Building to accommodate these needs and desires will help to ensure market
flexibility and responsiveness, now and into the future.
Overall, 65% of current rental households have 1 or 2 people. There was a slightly higher proportion of
3 to 4 people households in the Municipality of Clare.
Chart 14: Household Size of Movers and Renters
(Needs Assessment Data, Digby County)
MOVERS RENTERS
45%
40%
35% 39%
30% 33%
25%
26%
20% 24%
15% 17% 16% 18%
10%
11%
5% 8% 8%
0%
1 Person 2 People 3 People 4 People 5 People
Building Safe and Affordable Housing – Digby County 25Income of Movers and Renters
According to Census Data for Digby
Chart 15: Income Brackets of Renters and Movers
County on average, 80% of individuals, 15 (Needs Assessment Data)
years and over, make less than $40,000
per year. Renters Movers
100%
Among survey respondents who reported 90%
89%
on their total household incomes, a 80%
greater proportion of renters reported 70% 63%
incomes under $40,000 than movers. 60%
Almost 90% of renter households make 50%
40%
less than $40,000 per year.
30%
18%
Chart 16 summarizes the income 20%
10%
7%
10% 3% 4% 4%
distribution of renters who indicated they 0% 1%
0%
made less than $40,000. Of these, 43%
LessThan $40,000 to $70,000 to $100,000 to $150,00 or
indicated they make between $20,000 $39,999 $69,999 $99,999 $149,999 more
and $40,000. An additional 34% indicated
making between $10,000 and $20,000.
Approximately 23% indicated they are Chart 16: Income Distribution Under $40,000
(Needs Assessment Data, Renters n=177)
potentially living in conditions of extreme
poverty (under $10,000). No Income
1%
Of all survey respondents, 58% of those Less than
making less than $20,000 per year are $30,000-$39,999 $10,000
20% 22%
adults between 26-64 years. Youth
represent an additional 17% and seniors
25%. Similarly, approximately 88% of
those making less than $10,000 are either
adults (61%) or youth (27%). Seniors are $20,000-$29,999
somewhat protected from these extreme 23% $10,000-$19,999
34%
poverty situations as they are eligible to
receive a greater share of government
transfers, their poverty is often
characterized as “shallow”, meaning it wouldn’t take very much financial support to lift them out of
poverty.14 This is less the case for low-income working aged adults. Many poor working-age adults
experience deep poverty, and they would require substantial income increases to raise their income
levels to the poverty line.
For stakeholders interested in investing in rental properties as well as those interested in ensuring
housing affordability across their communities, this information provides additional insight on what
housing affordability and basic income threshold gaps might be for this group.
Building Safe and Affordable Housing – Digby County 26You can also read