Story County Water Monitoring & Interpretation Plan, 2021-2030
←
→
Page content transcription
If your browser does not render page correctly, please read the page content below
Story County Water Monitoring
    & Interpretation Plan,
         2021-2030

              1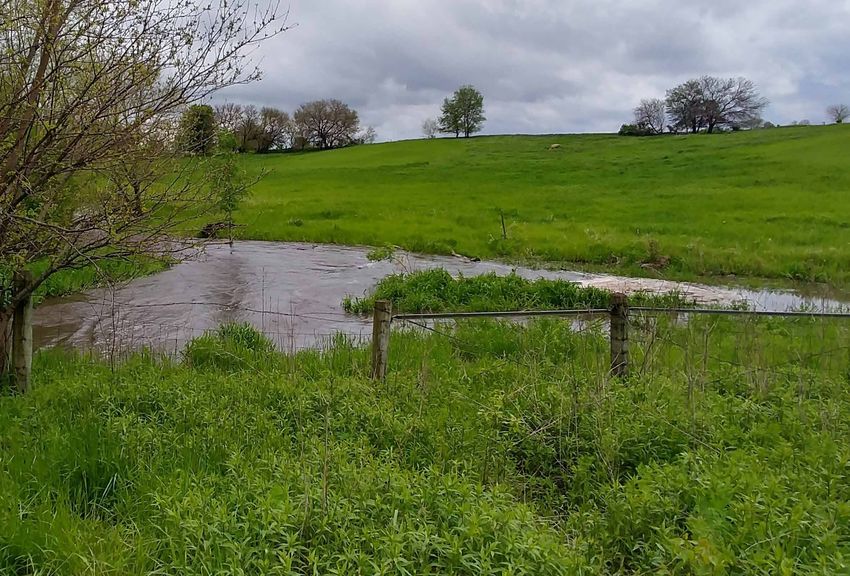
Squaw Creek Watershed Coalition conducts invertebrate sampling

           Purpose of the Plan
To collect and analyze water sampling data, to increase residents’
   knowledge and understandings and identify problems in our
        watersheds, to support and improve water quality.

                                2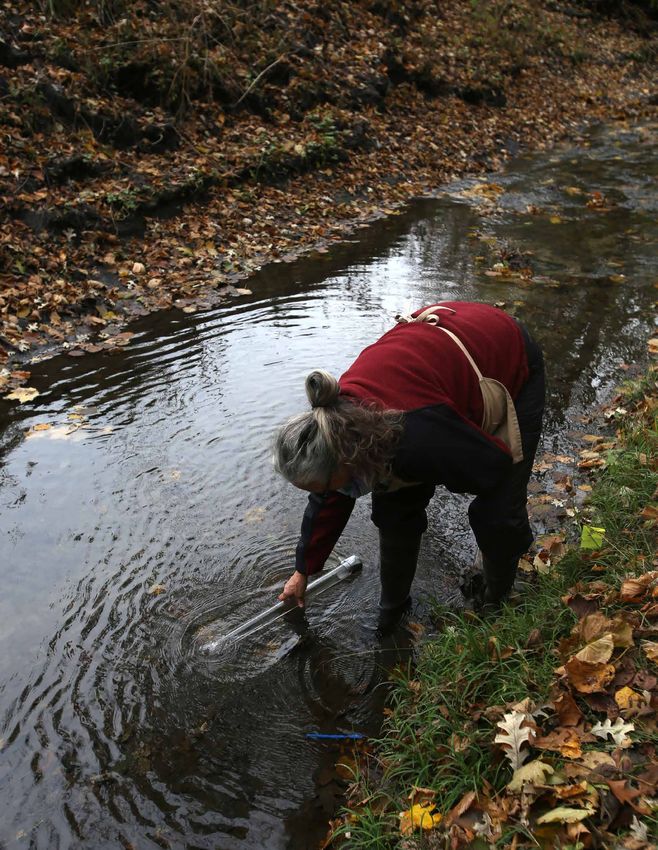
Acknowledgements
    This final report was achieved through the commitment of the Story County Water
   Monitoring Planning Team assembled during 2020. Despite the disruption of a global
pandemic, the planning team met monthly between April and December by utilizing ZOOM
 conferencing. In addition, the planning team broke into small topical areas to complete
work necessary for the plan. It was an effort of discussions and identifying solutions; and it
                       was an effort of good will and future thinking.

            We wish to recognize those who served on the Planning Team from:
                 Story County (Mike Cox, Jerry Keys and Margaret Jaynes),
 the City of Ames (Tracy Peterson, Liz Calhoun, Neil Weiss, Dustin Albrecht, Maryann Ryan
   and Ashley Geesman), the City of Nevada (Jordan Cook and Jeremy Rydl), the City of
 Gilbert (Sonia Arellano Sundberg, the City of Huxley (Rita Connor and Mark Kahler), Iowa
State University Leopold Center for Sustainable Agriculture (Mark Rasmussen), Izaak Walton
 League (Zack Moss and Paul Readhead), Story County Soil and Water Conservation District
     (Kayla Bergman), and the Story County Community Foundation (Jennifer Dieter).

              The Board and staff of Prairie Rivers of Iowa are grateful for
      the commitment of time and support each organization and its representatives
                              provided to this planning.

                                 Authors
            Prairie Rivers of Iowa is 501(c)(3) non-profit based in Ames, Iowa.
 Penny Brown Huber, Executive Director, facilitated meetings and the development of the
  Goals and Strategies by the Planning Team. The supporting chapters of the report were
 prepared by Daniel Haug, Watershed Educator, including maps and data analysis. Unless
  otherwise acknowledged, photos were provided by Prairie Rivers of Iowa staff including
              Mike Kellner and Daniel Haug. Graphic design by Katie Sailer.

                                     January, 2021

                                              3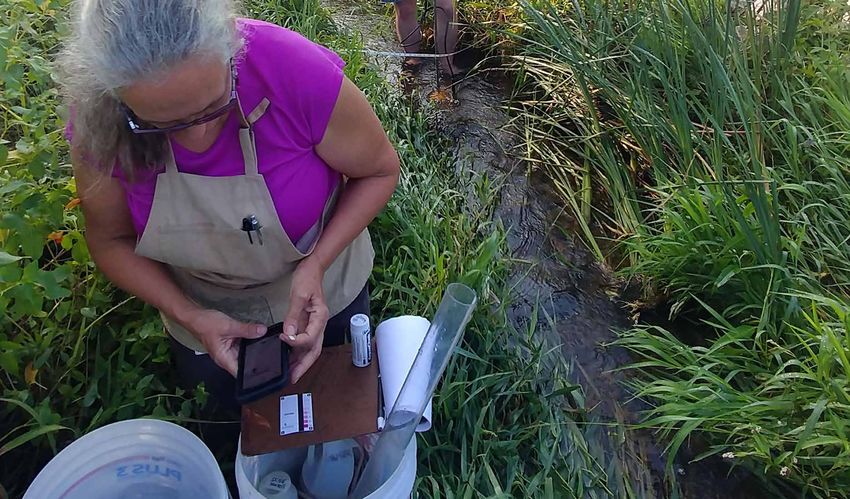
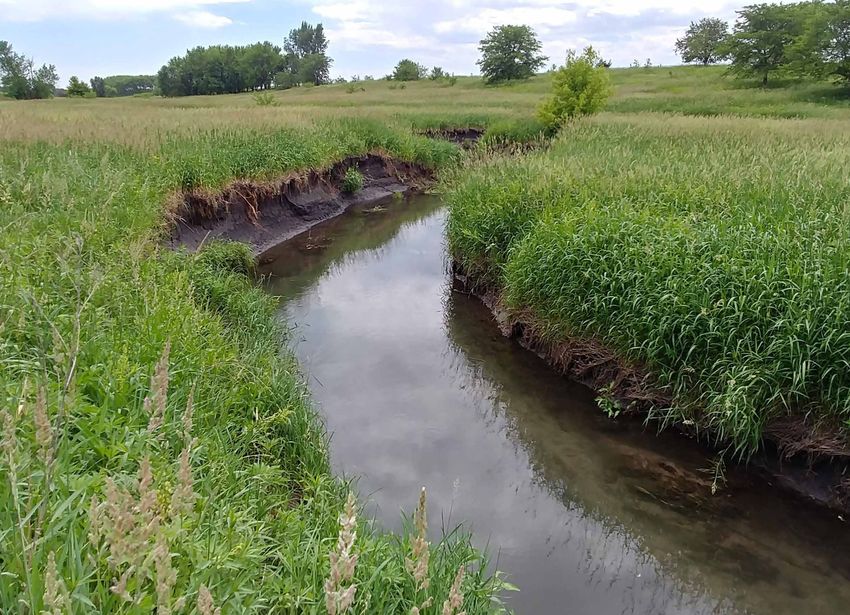
Onion Creek

                                Foreward
Planning for a locally-led water monitoring program in Story County was a process of
discovery that began before 2020 (see Chapter 1) and will continue to unfold over the next
10 years (see Chapter 6). We discovered:

• There are many stakeholders with an interest in improving water quality in lakes
and rivers and managing water to make our communities more resilient to extremes of
weather. By getting to know one another, we have opened up exciting new possibilities
for collaborating on projects and sharing knowledge and resources—both for understanding
water quality and improving it.

• More data was available than anyone had realized (Chapter 3). The City of Ames has
been monitoring the South Skunk River on a weekly basis for 18 years, a rich dataset that
we are already using to understand long-term and seasonal trends. The US Geological
Survey took over 3,700 measurements at a tributary of East Indian Creek near Zearing,
giving us a complete scorecard of the pressures on fish and other aquatic life. Over 61,000
measurements were collected from Walnut Creek near Kelley by the USDA Agricultural
Research Service as part of a study that can help us isolate and understand the influence of
specific land management practices in our part of Iowa.

• Guidelines for interpreting and using water quality data are sorely lacking (Chapters 2 and
4). State standards and criteria have not been developed for many of the pollutants we
monitor and issues we are concerned with. Where criteria exist, there are inconsistencies
in the databases and exceptions in the law that make it difficult to understand what
designated uses apply to a given water body, which criteria to refer to when evaluating the
data, and what can be done if water quality is impaired.

• Most rivers and streams in Story County either do not meet the recreation standard
or have not been officially assessed (Chapter 2). Based on the data collected by local
partners, there is widespread fecal bacteria contamination of our rivers.

                                             4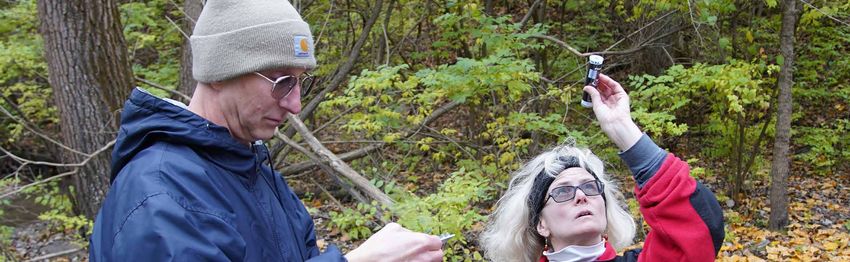
• Using water quality monitoring to track short-term progress toward the Iowa Nutrient
Reduction Strategy goals is virtually impossible (Chapter 4). While all of us had heard the
term “statistical significance” it was easy to dismiss it as an academic concern until we
saw a practical demonstration—sampling on a different day of the week or week of the
month can lead to different conclusions unless the trends are very large or we are diligent
in quantifying the uncertainty associated with water quality averages. This finding also
underscores the importance of sustaining water monitoring for the long-term.

Testing water quality is the easy part. Story County has a proud history of stream
monitoring by both volunteers and certified labs, and many people stepped up in 2020 to
ensure that it continued (Chapter 5).

Correctly interpreting the data is a challenge, as is using the data to guide conservation
efforts and evaluate their effectiveness. However the information and relationships we
have assembled through this effort put the government of Story County and its many
partners in as a good a position to tackle this challenge as anyone in Iowa.

                                              5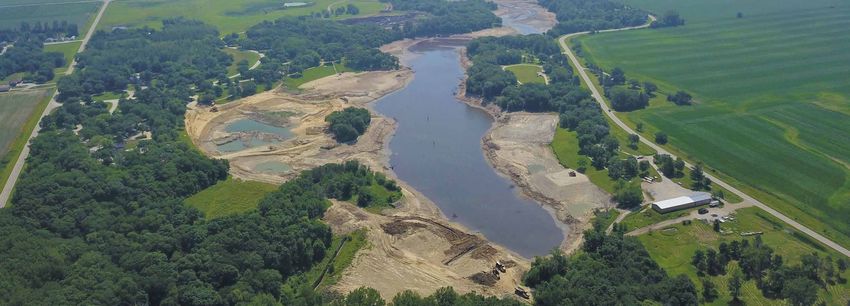
Table of Contents

7     Chapter 1: Why do we want data?

14    Chapter 2: Where do we want data?

29    Chapter 3: What data is already available?

47    Chapter 4: How do we interpret the data once we have it?

71    Chapter 5: How can we collect new data?

82    Chapter 6: Goals and Strategies for years 2021-2030

                      6
Why do we want data?

In December 2019, a cooperative agreement between Story County Conservation, the City of Ames, and
Prairie Rivers of Iowa (PRI) secured PRI’s services for conducting water quality monitoring and outreach
throughout the county. Additional funding for the project was provided by Story County Community
Foundation, the Iowa State University Leopold Center for Sustainable Agriculture, Outdoor Alliance of
Story County, and the Renewable Energy Group. Additional partners—the Izaak Walton League, City of
Gilbert, City of Nevada, City of Huxley, and Story County Soil & Water Conservation District—joined the
planning team by spring of 2020.

The results of that work are described in the report that follows: both the collaborative work of
building partnerships and setting goals, and the technical work necessary to understand existing data
and collect additional samples.

However, 2020 was by no means the first year that local partners had worked together on water
monitoring. The history and needs that motivated the development of this plan are described next.

                                                   7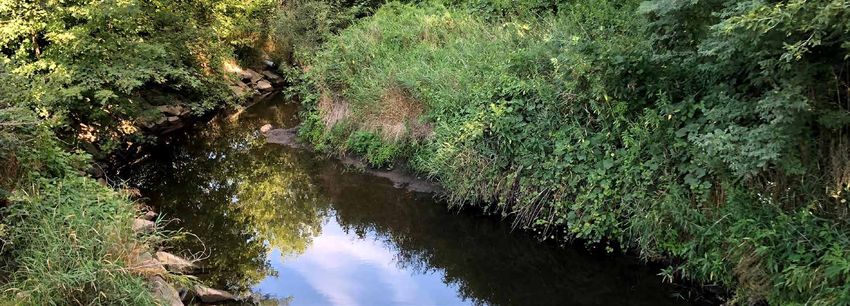
Need for Local Leadership for Volunteer Water Monitoring

The need for local leadership in water monitoring became apparent with the ending of the IOWATER
program. The IOWATER program, created by the Iowa Department of Natural Resources in 1998, had
provided volunteers with training and supplies to test water chemistry and survey invertebrates, as
well as managing an online database. The program was formally discontinued in January 2016, the
database was shut down in 2017, and departmental support for supplies were gradually scaled back
over the next few years. Reasons cited for the decision include budget cuts and a hiring freeze,
declining participation, and security concerns with the database—the site had been hacked in 2012
and was not compatible with new IT projects in the Department.

While the loss of state support presented a serious challenge to continued volunteer monitoring, it also
presented an opportunity for tighter feedback between water quality data and conservation efforts. As
the DNR put it:

          Volunteer water monitoring is best able to inform local water quality goals if the
          decision-making and coordination is locally-led. With the help of the DNR to get
          started, interested communities, watersheds, counties, and regions have an opportunity
          to take ownership and derive more value from their locally-led volunteer water
          monitoring programs.1

Who would provide local leadership for volunteer monitoring in Story County?

Prairie Rivers of Iowa was approached in 2018 by the Ioway (Squaw) Creek Watershed Coalition (SCWC),
an experienced and active group of IOWATER volunteers, for help in ordering supplies and recruiting
volunteers to support annual snapshot events in May and October, a tradition since 2006. The Outdoor
Alliance of Story County provided short-term funding to also support this. A formal M.O.U. between
SCWC and PRI was proposed but never completed.

Other than Ioway (Squaw) Creek watershed, volunteer monitoring across the county has fallen off in
the last decade. Story County Conservation (SCC) expressed interest in taking on a leadership role
in order to support assessments and new projects in other watersheds, beginning with mapping and
scouting of potential volunteer sites in 2017 by Environmental Education Coordinator Jerry Keys
and volunteers John and Gregg Hadish as part of the Master River Stewards Program. Story County
Conservation staff have experience managing volunteers and planning environmental education
programming. SCC also considered training and supplying staff to adopt a site for monthly or twice
monthly monitoring, following the approach taken by Polk County Conservation2.

At the state level, the Izaak Walton League organized an Iowa Water Quality Summit on July 20, 2019
to bring together various groups interested in water monitoring and discuss the role that both local
chapters and the national organization could play.

1 https://www.iowadnr.gov/Environmental-Protection/Water-Quality/Water-Monitoring/Volunteer-Water-Monitoring
2 https://www.polkcountyiowa.gov/conservation/water-quality/

                                                           8
Laura Merrick (Iowa State University)
                                                                          monitoring at S. Branch Worrell Creek

The Izaak Walton League’s Save Our Streams program for volunteer stream monitoring was a major
influence on the IOWATER program and uses almost identical protocols. The Izaak Walton League of
America hired an Iowa coordinator, Zach Moss, to train and support volunteers. It also developed a web
portal (The Clean Water Hub) that volunteers can use for data entry. Story County and Prairie Rivers of
Iowa also approached the Ames Chapter of the Izaak Walton League in 2019 to organize local training
events.

Iowa State University (ISU) also has supported volunteer monitoring. The University Translational
Research Network (U-TuRN) funded two mini-grants for an interdisciplinary research project that
included regular monitoring of the south branch of Worrell Creek by Laura Merrick, a faculty member in
the agronomy department and long-term volunteer with the Ioway (Squaw) Creek Watershed Coalition.
Story County Conservation restored this stream as part of a new county park within the City of Ames
and ISU Research Park, the Tedesco Environmental Learning Corridor. County-University partnerships
continued with water monitoring, with Story County Conservation and Iowa DNR providing supplies
and reimbursing the University for laboratory services, and the University covering staff time. Merrick
often recruited neighbors, high school students, and college students to become involved with the
project. The project is a good model for how lab testing, volunteer monitoring, research, education,
and outreach can be combined. While some of the monitoring was conducted using field kits, samples
collected by volunteers and processed by a certified lab narrowed down sources of E. coli bacteria in
the watershed and revealed phosphorus releases by an aging stormwater pond.

As these discussions evolved, we saw a need to bring in additional partners and discuss how volunteer
monitoring could be paired with lab testing and sensor technology.

                                                   9
Ballard Creek

Need for Data to Support New Watershed Projects

This Plan has a countywide scope because Story County is pursuing multiple watershed projects.

The Story County Board of Supervisors is an active participant in two watershed management authorities,
Ioway (formerly Squaw) Creek WMA and Fourmile Creek WMA, and took the lead in submitting a 28E
agreement to form the Headwaters of the South Skunk River WMA, approved in October of 2018.

In order to take a more comprehensive approach to water resources and lay the groundwork for
future watershed projects, the County commissioned an assessment of all its 12-digit hydrologic
units. (Abbreviated as HUC12s, these are small watersheds or parts of watersheds, on the order of
10,000-40,000 acres in size). Completed by Emmons & Olivier Resources in June 2018, the assessment
included GIS mapping, identification of suitable sites for best management practices using the
Agricultural Conservation Planning Framework and analysis of how these could be combined to meet
nutrient reduction goals, a watershed prioritization framework, and recommendations for changes to
county ordinances and operations to better protect water quality. The assessment did not include any
collection or analysis of water quality data, but did make recommendations for future monitoring.

Following this assessment, county staff from multiple departments (Board of Supervisors, Conservation,
Planning and Development, Secondary Roads, Environmental Health, etc.) began meeting to discuss
how to implement the recommendations in the report, including water quality monitoring. The
assessment was intended to be a living document and reviewed periodically to reassess its priorities
and findings. Story County developed an implementation plan to accompany the assessment. The
implementation plan calls for development of a water quality monitoring program.

                                                   10
Four participants in the Planning Team are active members of the Ioway (Squaw) Creek Watershed
Management Authority: the Story County Supervisors, the City of Ames, the City of Gilbert, and the
Story County Soil and Water Conservation District. Those who participated in either the development
or implementation of that watershed plan see the experience as a model for how water quality can be
improved in other rivers and lakes. Water quality monitoring plays an essential role in this conceptual
model, which looks something like this:
1. Water monitoring by volunteers raises awareness and public support to
address water quality issues in a local stream or lake, and strengthens grant
applications for watershed planning.
2. The watershed plan identifies the best opportunities for conservation in the watershed
that can lead to water quality improvement, brings together the stakeholders needed
to address the problem (formalized through a WMA), and supports grant applications
for funding to hire a watershed coordinator and make additional cost share available to
farmers and landowners in the watershed.
3. A watershed coordinator provides outreach and technical support to encourage adoption
of conservation practices by farmers and landowners in the watershed.
4. Water monitoring is used to track progress, as conservation practices in the watershed
gradually lead to water quality improvements.
Need for Better Planning and Coordination of Monitoring to Support
Existing Watershed Projects
In reality, the pathway for water quality improvement is not as straightforward as we imagined it to be.
“An intense monitoring effort over several years is recommended to adequately assess
pollutant loading and to detect trends.”
- Squaw Creek Watershed Management Plan, 2014
“It is very unlikely that nutrient reduction in a watershed of this size will be detected
within a few year period, especially when BMPs implementation is limited and gradual.”
- Law and Soupir, 2019
In the Ioway Creek Watershed (formerly Squaw Creek) volunteer monitoring did lead to successful grant
applications, and the data was included in the Watershed Management Plan. However, the data to date
has not influenced goal-setting or prioritization of conservation practices, and were not considered
to be of sufficiently high quality to characterize baseline nutrient loads. Ultimately, the nutrient
reduction goals in the watershed plan were taken directly from the Iowa Nutrient Reduction Strategy
(41% nitrogen reduction, 29% phosphorus reduction) per guidance from the Iowa Department of
Agriculture at that time. In order to determine when those goals have been met, Chapter 7 of the plan
recommended we start monitoring from scratch: at least 25 samples a year at a gaged site, including
flow-paced samples during storm events using an automated sampler, to be tested by a certified lab for
total phosphorus soluble reactive phosphorus, total suspended solids, and nitrate-nitrogen.
11This monitoring plan was put into effect once conservation efforts were underway. A Water Quality
Initiative (WQI) grant from the Iowa Department of Agriculture and Land Stewardship (IDALS) made
available additional cost share and funded a watershed coordinator, watershed educator, and outreach
efforts by Prairie Rivers of Iowa and partners in the Ioway (Squaw) Creek Watershed from April of 2015
to March of 2019. A second watershed, East Indian Creek, was included in the original grant application
but was not funded. Ioway Creek and East Indian Creek were monitored 2016, 2017, and 2018. The City
of Ames and Story County each purchased a Teledyne ISCO automated sampler for the project, which
was programmed to collect time-paced composite samples during storm events. The samplers were
usually deployed in the stream from April or May thru November. City and county staff retrieve the
storm samples and collected biweekly grab samples during that period, which were then processed by
the City of Ames Water and Pollution Control Laboratory.
However, even this level of effort proved to be insufficient to accurately estimate baseline phosphorus
loads. This was one conclusion of a March 2019 report3 by Michelle Soupir (ISU Professor of Ag and
Biosystems Engineering) and Ji Yeow Law. The report was commissioned by Prairie Rivers of Iowa at
the end of the grant period to provide an independent review of the data collected and the monitoring
design. For detecting changes over a shorter time-frame, the report recommended monitoring at the
catchment (small watershed) scale, using a paired watershed design. For detection of nitrogen trends
in Ioway Creek over the long-term, it recommended instead using the data from the nitrate sensor
installed by IIHR Hydroscience and Engineering in 2016. Short of an entirely different monitoring
program, it recommended collecting flow-weighted (rather than time-paced) composite samples during
and extending the monitoring season from March to November, but characterized the benefit of this as
more accurate loading estimate rather than detection of trends. A parallel analysis by PRI’s Dan Haug
found that continued monitoring at these sites may not be able to detect statistically significant trends
until goals are close to being met (see Chapter 4).
The monitoring from 2016-2018 did provide valuable information, revealing that E. coli levels are
consistently high. Based on our data, in the 2018 assessment cycle, Iowa DNR reclassified both
streams as “potentially impaired” waters “in need of further investigation.” The report does include a
calculation of nitrate load in Ioway Creek and discussion of seasonal and flow patterns in both creeks.
However water quality monitoring was not effective in achieving its stated goal of assessing pollutant
load during the grant period, and may not be effective for interim progress tracking or demonstration
purposes.
Learning from this experience, local partners saw the need to clarify goals, set realistic expectations
and timelines, and coordinate with other groups doing water monitoring prior to launching new
monitoring activities.
3 https://www.prrcd.org/wp-content/uploads/2020/07/Monitoring-Report-March-2019.pdf
12Need for Reuse of Existing Data
“Data should not be in search of a problem, but a problem should be in search of data.”
– from Building an Internet of Water4
In 2016, IIHR Hydroscience and Engineering (a research institute at the University of Iowa) installed
a nitrate sensor in Ioway (Squaw) Creek at Moore Park in Ames, capable of testing nitrate every 15
minutes. It tested nitrate from April or May through November during the same field seasons that our
local partnership was conducting biweekly grab samples at a nearby location. Had we been aware of
this earlier, we might have opted not to test for nitrate as part of our biweekly sampling. At the very
least, we could have coordinated our efforts, perhaps allowing IIHR to use our data for calibration and
making better use of IIHR’s data for education and outreach.
Water quality data is often collected for a specific purpose. The Iowa DNR monitors 51 streams across
the state, including the South Skunk River, as part of a statewide ambient stream network. The
City of Ames monitors above and below its wastewater treatment plant in order to meet its permit
conditions and ensure that treated wastewater is not causing problems in the stream. This can lead
to duplication—both agencies are monitoring the South Skunk River at the same location, just below
the wastewater treatment plant on 280th Street. It’s unclear whether this duplication is avoidable.
The City of Ames monitors weekly for fewer parameters, while the DNR monitors monthly for more
parameters.
“Wow this is such a treasure trove! Somehow I did not comprehend that you have 20 years
of almost weekly nitrate data!”
“Tell me about it. I’ve always thought it was a shame more use wasn’t made of all
this data.”
- email exchange between Dan Haug, Prairie Rivers of Iowa, and Maryann Ryan,
City of Ames Water and Pollution Control
However, we can certainly make sure to find out what data is available and reuse it for other
purposes. As part of this project, Prairie Rivers of Iowa has been analyzing the nitrate and phosphorus
data collected in the South Skunk River by the City of Ames, and finding it extremely useful for
understanding seasonal patterns and long-term trends.
4 Patterson, Lauren, Martin Doyle, and Greg Gerhuny. 2019. Building an Internet of Water – A Report from the 2017 to 2019
Internet of Water Roundtables. https://www.aspeninstitute.org/publications/internet-of-water-revisited
West Indian Creek in Nevada
13Where do we want data?
West Indian Creek at Carroll Prairie
“The map is not the territory.” – Alfred Korzybski
How many lakes and streams are there in Story County? Which streams usually flow year-round
(perennial) and which are dry for part of the year (intermittent)? Which streams have enough water
to float a kayak or host some good-sized fish? These are the types of questions we’d like to answer in
order to review and prioritize monitoring sites.
These types of questions should be answerable by looking at the Designated Uses for each water body
in DNR or EPA databases. Under the Clean Water Act, state agencies determine what activities should
be possible in a lake or stream, if water quality were protected. Criteria for interpreting water quality
data are also linked to Designated Uses. Unfortunately, there are enough special rules and missing data
to prevent straightforward interpretation of these categories.
Looking to GIS maps is equally complicated, because Iowa is still in the process of updating and
reconciling various maps of hydrography (water features). At present, our maps do not reliably show
where streams begin or which streams flow year round.
14Local Importance of Water Bodies
Fortunately, our local stakeholders have an abundance of experience and good sense that can help us
to understand and prioritize local lakes and streams for monitoring. The preliminary site selections in
Chapter 5 are based on discussions from the meetings as summarized below.
• Hickory Grove Lake is a “Significant Publicly Owned Lake” that is monitored by DNR and
is currently being improved under a cleanup plan, or Total Maximum Daily Load (TMDL).
However, Peterson Park Lake, Dakins Lake, Ada Hayden Lake, and McFarland Lake are
also valued for fishing, swimming, or boating and will need local leadership to ensure
continued monitoring.
• The distinction between perennial and intermittent streams is not clear-cut. Even our
largest rivers in Story County often go dry. However, it is clear that as watershed size
and streamflow increases, streams can support more kinds of recreation and a greater
variety of aquatic life.
• To protect recreation and fisheries in rivers, the focus should be on the South Skunk
River, which is a state water trail and supports a smallmouth bass fishery. Paddling and
fishing are common and encouraged. Swimming is also commonplace.
• Ioway (Squaw) Creek in Ames and lower Indian Creek near Maxwell have less flow and
more limited public access than the South Skunk River, but are used for paddling,
tubing, fishing, and children’s play.
• Tributary streams in Story County that can influence water quality and flows on the
water trail portion of the South Skunk River include Ballard Creek, Walnut Creek, Ioway
Creek, Keigley Branch, Bear Creek, and Long Dick Creek.
• Smaller streams might not have much potential for fishing or recreation, but monitoring
or learning about a backyard stream is a great way to educate and engage local
stakeholders in our larger water quality and conservation challenges, especially when
streams have public access and interpretive features, such as the South Branch of
Worrell Creek. Story County Conservation is guiding volunteers and staff to monitor
streams in almost every HUC12 watershed (see Chapter 5). This will ensure good
coverage of the county and tie into the county watershed assessment.
• Monitoring nitrogen and phosphorus at any scale—from tile outlets, to ditches, to
large rivers—can inform and support local implementation of Iowa’s Nutrient
Reduction Strategy.
• Water quality in Story County lakes and rivers is only tangentially connected to drinking
water. However, sourcewater protection around wells can tie into a watershed-scale
conservation effort.
15Maps of Lakes
Figure 1: Priority lakes, reproduced from Story Countywide Watershed Assessment (2018)
16Five high-priority lakes were discussed in the Countywide Watershed Assessment and will be the focus
of future monitoring. The map used in the assessment (Figure 1) was based on the National Wetland
Inventory, because Iowa does not have a current and complete GIS coverage showing lake shores.
• Ada Hayden Lake
• Dakins Lake
• Hickory Grove Lake
• McFarland Lake
• Peterson Park West Lake
The Iowa portion of the National Hydrographic Dataset in Iowa (Figure 2) is based on topographic maps
from the 1990s and early 2000s, so this map does not show the current shoreline or correct names for
Ada Hayden Lake or Peterson Park Lake, former gravel pits that are now valued for recreation. Ada
Hayden, Dakins, and Hickory Grove lakes are represented as points of interest in Iowa DNR’s fishing
atlas. McFarland, Dakins, and Hickory Grove lakes are represented as points of interest in DNR’s
Assessment Database, ADBNet, along with five Story County wetlands.
Grant Ditch #5
Figure 2: National Hydrographic Dataset lakes map
Hickory Grove Lake, during renovation in 2020.
Photo courtesy of Story County Conservation
17Maps of Streams
A. B.
C. D.
Figure 3: Iowa has multiple stream maps with major differences. A) LiDAR based stream centerlines, B) National Hydrographic
Dataset streams, perennial and intermittent, C) subset of NHD flowlines included in Iowa DNR’s assessment database, D) subset
of NHD flowlines for which a Use Attainability Analysis has been completed
(Figure 3A) The most accurate stream maps are based on LiDAR, flown across Iowa between 2006
and 2010. As part of Iowa’s Statewide Flood Plain Mapping Project, Iowa DNR used high resolution
digital elevation models to map stream centerlines⁵, or both banks of stream channels wider than 7
meters⁶. While the shapes on the map are complete, DNR is still in the process of adding the codes and
other attributes that allow various kinds of water data—designated uses, reports of spills, monitoring
⁵ Search for “Stream Centerlines” on geodata.iowa.gov
⁶ Search for “Stream Channels” on geodata.iowa.gov
18stations, permitted facilities, watersheds, etc.—to be matched to the appropriate section of stream.
These attributes will come from the National Hydrographic Dataset.
Together with the Watershed Boundary Dataset, the National Hydrographic Dataset (NHD) provides
a consistent framework for relating environmental data to the stream network. NHD started out as
a digital representation of the blue lines on a USGS topo map but has evolved into something more.
Applications built around the NHD have been used to identify water monitoring stations downstream
from spills, estimate streamflow at ungaged sites, and estimate nutrient loads⁷.
(Figure 3B) In Iowa, the NHD flowlines are currently based on 1:100,000 scale maps from the late 1990s
and early 2000s. At this mapping scale, 90% of well-defined features are within 167 feet of their true
geographic position⁸. This is good enough for many purposes but there are large enough discrepancies
between the NHD and higher resolution aerial photos and LiDAR to cause problems for some kinds of
analysis—like the identification of riparian buffer opportunities using the Agricultural Conservation
Planning Framework (ACPF).
DO NOT use National Hydrography Datasets (e.g., NHD+) to forcibly assign stream
locations. This is strongly discouraged for several reasons; the age (circa 1950s) and
coarser scales from which those datasets originate will negatively impact the accuracy
of flow routing, which will consequently impact results of the ACPF, particularly the
riparian assessment.
–ACPF User Manual, version 3.0
There is also a lot of inconsistency between GIS coverages as to where streams start and which streams
are treated as perennial or intermittent⁹. This poses a challenge for selecting monitoring sites and
interpreting the data, but also for any project where GIS is used to inventory or analyze streams. For
example, as part of Story County’s ambitious watershed and creek sign project10, Prairie Rivers of
Iowa used the NHD to identify locations where named creeks crossed a paved county road. One pair of
road signs that were ordered went unused when it became apparent that Mud Creek is not a perennial
stream where it crosses County Road E63, but rather a grassed waterway that is usually dry and has
no defined bed and banks (See Figure 4). The mapping error has been corrected in the most recent
version of the NHD but also appears in DNR’s assessment database and led to two conflicting sets of
recommendations for stream buffers in the Story County Watershed Assessment. Now that we are aware
of the issue, we can be sure to verify stream locations using aerial photos or field visits at an early
stage of future projects.
⁷ Moore, Richard B., and Thomas G. Dewald. 2016. “The Road to NHDPlus — Advancements in Digital Stream Networks and
Associated Catchments.” JAWRA Journal of the American Water Resources Association 52 (4): 890–900.
https://doi.org/10.1111/1752-1688.12389.
⁸ https://www.usgs.gov/faqs/what-positional-accuracy-national-hydrography-dataset-nhd?qt-news_science_products=0#qt-news_
science_products
⁹ Note that topographic maps in Iowa do not include a category for ephemeral streams, which flow only after rain and are no
longer considered jurisdiction Waters of the United States. It is unclear whether the concept is limited to arid regions.
10
https://www.prrcd.org/signage/ for more details on the project
19Figure 4: Inconsistency in stream mapping can affect road signs and stream buffer recommendations. A) Mud Creek was mapped
as a perennial stream in some versions of NHD, B) but there is no channel visible on the ground or aerial photos, C) buffers were
recommended for this section of Mud Creek based on GIS analysis of NHD lines and interpretation of DNR databases, D) but
buffers were not recommended for Mud Creek based on the Agricultural Conservation Planning Framework, which used LiDAR
and aerial photos.
20Iowa DNR plans to use the drainage area of each stream segment to classify new LiDAR based stream
centerlines in a consistent way11. Until this dataset is released, we can use a similar map prepared by
Prairie Rivers of Iowa using NHDPlus12 version 2.0, which combines NHD stream lines with watershed
information derived from medium-resolution elevation and landcover data from 2011. Prairie Rivers
of Iowa proposed adapting the categories and thresholds used by the Iowa DNR biological monitoring
program13 to help select monitoring sites and interpret data. The only streams for which benchmarks
have been developed for assessing fish and invertebrate surveys are “wadeable” streams draining a
watershed of between 10 and 700 square miles, as distinct from “headwater” streams sampled with a
slightly different protocol, or “non-wadeable” streams sampled with a boat. When Iowa DNR proposed
draft nutrient criteria in 2013, they were limited to “wadeable” streams which had clear biological
monitoring data for comparison.
Figure 5 and Table 1 show this classification. Headwater streams are less likely to sustain flow year
round and have sufficient water and habitat to sustain a large variety of aquatic life. A distinction
is not made between natural streams and drainage ditches. Place names aside, the distinction is not
always clear. For example, the lower part of Grant Ditch 5 is mapped as a creek on General Land
Office surveys from the nineteenth century, and the lower section still retains its natural meanders.
The headwater reaches of many named streams have been channelized. The legal distinction between
ditches and streams is also unclear. Numbered ditches have appeared in 305(b) assessments and on the
303(d) Impaired Waters List. Even after changes by the Trump administration, many ditches are still
considered jurisdictional Waters of the United States.
“The term ‘tributary’ includes a ditch that either relocates a tributary, is constructed
in a tributary, or is constructed in an adjacent wetland as long as the ditch is perennial
or intermittent and contributes surface water flow to a traditional navigable water or
territorial sea in a typical year.”
-Federal Register14, vol. 85, April 2020
11
Personal communication from Samuel McDeid, IDNR. Nov 21, 2019
12
https://www.epa.gov/waterdata/nhdplus-national-hydrography-dataset-plus
13
https://programs.iowadnr.gov/bionet/docs/about
14
https://www.epa.gov/sites/production/files/2020-01/documents/navigable_waters_protection_rule_prepbulication.pdf
Grant Ditch #5
21The South Branch of Worrell Creek,
a restored headwater stream
at the Tedesco Environmental Learning Corridor
Figure 5: Prairie Rivers of Iowa proposed stream classification, based on NHDPlus and watershed area. “Headwater streams”
(light blue) drain less than 10 square miles of land, and are less likely to flow year-round.
22Table 1: Prairie Rivers of Iowa proposed stream classification based on watershed area
Large Wadeable Streams
Headwater Streams
(part of creek has a watershed area
(watershed area less than 10 square miles)
between 10 and 700 square miles)
South Skunk River College Creek
Walnut Creek “South Branch of Worrell Creek”
Ioway (Squaw) Creek “Komar Creek”
Worrell Creek “Gilbert Creek”
Clear Creek (near Ames) Dry Creek
Onion Creek Rupple Creek
Keigley Branch and an unnamed tributary
Bear Creek Story County portions of:
Long Dick Creek Linn Creek
Indian Creek Fourmile Creek
Calamus Creek South Minerva Creek
Rock Creek Clear Creek (near Colo)
West Indian Creek Willow Creek
Grant Creek (Drainage Ditch 5) Mud Creek
Drainage Ditch 32
East Indian Creek
Drainage Ditch 81
Drainage Ditch 91
Dye Creek
Wolf Creek
Middle Minerva Creek
Minerva Creek
Ditch 1
The Iowa DNR uses subsets of the NHD to organize assessments and map impaired waters (Figure 3C)
and to keep track of waters for which a Use Attainability Assessment have been completed (Figure 3D).
These are described in the following section.
DNR Assessments and Impaired Waters List
Every two years, as required by Section 305(b) of the Clean Water Act, the Iowa DNR reviews available
data to assess whether Iowa waters are supporting their designated uses and report its findings to the
EPA. The data used is 2-4 years old for rivers, and 2-5 years old for lakes. Under Section 303d of the
Clean Water Act, waters that do not support their designated uses are added to the Impaired Waters
List. As time and resources allow, the DNR works through this list to prepare cleanup plans.
(Figure 3C) Iowa DNR’s Assessment Database15 includes all streams that were mapped as perennial in
a 1993 version of the NHD. As described above, these categories are not always reliable. Linn Creek is
15
ADBNet is DNR’s Assessment database. https://programs.iowadnr.gov/adbnet/
23Keigley Branch
mapped as extending into Story County even though closer inspection of aerial photos shows that the
stream channel begins in Marshall County. The database does not include several streams that have
since been reclassified as perennial, either through corrections in subsequent editions of the NHD (i.e.
Middle Minerva Creek near Zearing, Grant Ditch near Nevada) or by completion of a Use Attainability
Analysis (i.e. Gilbert Creek). It also excludes former gravel pits like Peterson Park Lake and Ada Hayden
Lake that are valued for recreation.
Figure 6: Stream segments in ADBNet
The stream segments and designated uses in ABDNet are generally not split apart and updated to match
Iowa’s official Surface Water Classification document, described in the next section. For example,
West Indian Creek is designated A2 (Secondary contact recreation) downstream Nevada Wastewater
Treatment Plant, but in ABDNet, the entire stream is treated as presumed A1 (primary contact
recreation).
24However DNR’s Assessment Database is still an essential starting point for understanding water quality
in Story County, and finding information about fish kills, water quality monitoring, and biological
monitoring for that water body. Table 2 summarizes the designated uses and 2020 assessment results.
Segment numbers can be referenced to the map (Figure 6).
• 3 lakes and 34 streams segments in Story County are included in ADBNet. Most have
never been monitored or assessed.
• Only 5 streams and 1 lake were assessed for recreational uses in 2020. None were
fully supporting.
• 18 streams and 2 lakes were assessed for aquatic life uses in 2020. Only 4 were
fully supporting.
• 6 stream segments were placed on Impaired Waters List in 2018 or previous cycles.
The 2020 draft Impaired Waters List did not include any additions or removals.
• 1 lake (Hickory Grove Lake) is impaired but a Total Maximum Daily Load (TMDL) was
completed to address algae and bacteria.
• 21 streams segments are only presumed to be capable of supporting gamefish and
primary contact recreation16. Since these are small streams, it is likely that the
designated use would be changed to A2 and B-WW2 when and if a Use Attainability
Analysis is completed.
• 8 headwater stream segments were placed on the Waters In Need of Further
Investigation list because of low invertebrate or fish scores. DNR has not calibrated
metrics for headwater streams with less than 10 square miles of drainage area, so is not
able to evaluate if these streams are supporting aquatic life to their full potential.
• As described in Chapter 4 and Chapter 5, local partners tested E. coli in two streams
between 2016 and 2018. After public comment by Prairie Rivers of Iowa, these were
placed on the Waters In Need of Further Investigation list.
• Hickory Grove Lake fully supports fish consumption (HH) use based on testing of fish
tissue for mercury, PCBs, and other chemicals. In previous cycles, the South Skunk River
supported fish consumption use, but the data is now over 10 years old. Other priority
lakes have not been tested.
16
See IDNR publication Assessing Iowa Stream Uses for an explanation of the “rebuttable presumption”: http://www.iowadnr.
gov/Portals/idnr/uploads/water/standards/files/UAA_factsheet_20132014_FINAL_ContactUDate.pdf
25Table 2: Story County lakes and streams in ADBNet, designated use and 2020 assessment results
Fully Supporting (◊), Partially Supporting (!), Not Supporting (!!)
ABDNet Fish 303d
HUC12 Segment Geographic Name Recreation17 Aquatic Life1⁸ Consumption List
070801050305 6295 Onion Creek * * !
070801050307 6286 Worrell Creek * * !
954 Squaw Creek A1 !! BWW2 !
955 College Creek * * !!
956 Clear Creek * *
070801050401 960 Long Dick Creek * BWW2 ! !
070801050403 958 Bear Creek (lower) A2 BWW2 ◊
959 Bear Creek * * !
070801050405 957 Keigley Branch (lower) * BWW2
1791 Keigley Branch * BWW2
070801050406 933 South Skunk River * BWW2
934 South Skunk River A1 ! BWW1 ! HH !
939 McFarland’s Pond - BLW HH
070801050502 949 West Indian Creek A2 BWW2
070801050602 6298 Drainage Ditch #81 * * !
6629 Unnamed Tributary * * ◊
to East Branch
Indian Creek
070801050603 6249 Unnamed Tributary * *
to Dye Creek
6466 Dye Creek * *
948 Dye Creek (lower) A1 BWW2
070801050604 947 East Indian Creek A1 ! BWW2
950 Hickory Grove Lake A1 ! BLW ◊ HH ◊ !
070801050701 6502 Clear Creek * *
6503 Willow Creek * *
6504 Unnamed Tributary * * !
to Willow Creek
070801050702 946 Mud Creek * * ◊
070801050801 943 Indian Creek A1 ! BWW2 ! !
070801050802 6626 Wolf Creek * * ! !
070801050901 953 Walnut Creek * BWW2 ! !
070801050902 952 Ballard Creek (lower) A3 BWW2 !
3053 Ballard Creek A2 BWW2 ! !
070801050903 932 South Skunk River A1 BWW2
931 South Skunk River A1 ! BWW2 ! !
070802070802 6284 South Minerva Creek * * !
070802070803 740 Dakin Lake - BLW HH
070802070804 739 Minerva Creek A2 BWW2
070802080101 733 Linn Creek * *
071000080101 3031 Fourmile Creek A2 BWW2 !
17
A1 – Primary contact recreation, A2-Secondary contact recreation, A3- Children’s recreation, * Presumed A1
18 BWW1 – Warmwater streams supporting gamefish, BWW2 Warmwater streams lacking flow and habitat for gamefish, BLW –
Lakes and wetlands, HH - Human Health / Fish Consumpion, * Presumed BWW1
26Designated Uses
(Figure 3D) Another subset of NHD flowlines was used to prioritize streams for the Story Countywide
Watershed Assessment. The source for this map was DNR’s Stream Use Assessment and Attainability
GIS coverage, sometimes called “Designated Streams.” This GIS coverage is used to keep track of
streams for which a Use Attainability Analysis (UAA) has been completed19. However, it is important to
understand that many other waters in Story County also have a presumed Designated Use and would be
subject to water quality standards that are the same, or stronger. Not all of them are mapped.
“All perennial rivers and streams as identified by the U.S. Geological Survey 1:100,000
DLG Hydrography Data Map (published July 1993) or intermittent streams with perennial
pools in Iowa not specifically listed in the surface water classification of 61.3(5) are
designated as Class B(WW-1) […and] Class A1 waters.”
Iowa Administrative Code 567—61.3 (455B) Surface water quality criteria.
A Use Attainability Analysis is necessary to reclassify designated uses. This often occurs as part of the
permitting process for sewage treatment plants and industry that discharge wastewater. DNR staff
evaluates the waters receiving the effluent, conducts fish surveys, and solicits public comment to
determine how the stream is being used and what uses it could potentially support, which then affects
water quality criteria are referred to in preparing the National Pollution Discharge Elimination System
(NPDES) permit. These determinations are subject to public comment and approval by the EPA.20
Figure 7: Electroshocking at “Gilbert Creek” for a Use Attainability Analysis, source: Iowa DNR
19
Search for “Stream Use Assessment and Attainability” on geodata.iowa.gov
20
For a complete explanation of the process, see “Assessing Iowa Stream Uses”, a DNR factsheet. http://www.iowadnr.gov/
Portals/idnr/uploads/water/standards/files/UAA_factsheet_20132014_FINAL_ContactUDate.pdf
27The following examples serve to illustrate the difficulty in interpreting UAAs and designated uses
outside of the context of permit applications for wastewater treatment plants (WWTPs) and industry.
• Sometimes called Gilbert Creek, an officially unnamed tributary of Ioway Creek was
surveyed below the Gilbert WWTP in 2016. While it is mapped as intermittent in the
NHD, DNR determined through field investigations that it was actually perennial.
Because water was shallow, access was limited and only non-game fish were captured,
DNR assigned it the lowest possible designated use: A2 (secondary contact recreation)
and B-WW2 (non-game fish and aquatic life).
• Middle Minerva Creek was surveyed at three locations below the Zearing WWTP in
2016. DNR staff found a variety of non-game fish and water deep enough to support
full contact recreation at the lower two locations, and designated part of the stream
as A1 and part as A2. The portion of Middle Minerva Creek that flows through Zearing is
undoubtedly perennial and shallow, but does not appear on the Designated Waters Map
or ADBNet, as it was mistakenly miscoded as intermittent in the 1993 NHD.
• College Creek is a tributary of Ioway Creek. Only a 46-foot length of the creek
downstream of the ISU Heating Plant and the unnamed tributary21 that connects it
were analyzed. DNR assigned this small segment a designated use of A3 (Children’s
Recreation), based on the possibility that children could wade in from Squaw Creek.
The remainder of the creek, which flows through the ISU campus and several city parks,
remains unassessed with a presumptive A1 (primary contact recreation) and B-WW1
(gamefish) uses.
• West Indian Creek was surveyed below the Nevada WWTP in 2006. DNR concluded that
although “West Indian Creek is too shallow to support primary contact recreational
uses, it does possess the potential of attracting Class A2 Secondary Contact
recreational uses particularly associated with recreational canoeing and kayaking,
fishing, trapping or hunting.” The portion of West Indian Creek upstream of the WWTP
that flows through the City of Nevada was not assessed, and remains presumptively
designated Class A1 for “full body immersion with prolonged and direct contact with
the water, such as swimming and water skiing.” The 160-foot long “effluent dominated
ditch” leading from the WWTP to the creek was designated A3—Children’s Recreational
Use based on the fact that it was in town and within walking distance of schools
and playing fields. Of the three designated recreational uses, Class A2 has the most
permissive E. coli criteria. The public may have difficulty understanding the difference
between these categories or why they were assigned.
Ultimately, Designated Uses may be an unnecessary complication for local partners when selecting sites
or interpreting data for non-regulatory purposes. When presenting E. coli data, it may be simplest to
reference both primary and secondary contact recreation criteria (See Chapter 4). The South Skunk
River is the only stream in Story County designated B-WW1 for warmwater game fish, but DNR Fisheries
Management Biologist Ben Dodd pointed out that Ioway Creek, Indian Creek, East Indian Creek, and
West Indian Creek have some limited potential to sustain a fishery and could be included in monitoring
focused on aquatic life.
21
This tributary of College Creek was monitored as part of Squaw Creek Watershed Coalition snapshots, where it as referred to as Cyride Creek.
28What Data is Already
Available?
“Your query [Story County, Iowa] returns 244,787 records from 428 stations.”
-Query results from the Water Quality Portal
29Types of Data
Tens of thousands of water quality measurements have been collected in Story County. Making use
of this data can improve our understanding of Story County lakes and rivers while saving us time and
money. However, the data is scattered across at least six different databases. Categorizing water data
by method of collection helps for understanding the types of data availailable and how it is structured.
• Water quality, tested in the field
• Water quality, tested in the laboratory
• Water quality, measured continuously in the field
• Biological monitoring
• Water quantity (flow) measured continuously at a gage
We will use nitrate as an example. Nitrate can be measured in the field with a test strip, recorded on a
clipboard, and entered in a database designed specifically for the volunteer program. Since there’s a set
protocol with a limited number of characteristics being measured, it’s easy enough to fit all the results
for one date on a single row.
Table 3: Example volunteer data in “wide” format, from the former IOWATER database
Date Nitrate-N (mg/L) Orthophosphate (mg/L) Transparency (cm) Chloride (mg/L)
2010-06-11 10 0.2 50Table 5: Example of continuous data from a probe, on the Iowa Water Quality Information System
Date Time Nitrate-N (mg/L)
2010-06-11 08:00 10
2010-06-11 09:00 9.9
2010-06-11 10:00 9.8
In order to calculate how many pounds or tons of nitrogen is making its way to downstream waters, we
would need to combine water quality data with water quantity data. Streamflow data is readily available
from the US Geological Survey for gages they monitor.
Table 6: Example of combining water quality data with water quantity (flow) data from the USGS
Date Nitrate as Nitrogen (mg/L) Discharge (cfs) Nitrogen Load (pounds/day)
2018-06-14 3.0 3,330 53,893
2017-05-24 17 509 46,680
2018-09-28 8 476 22,597
In order to determine how nutrients are affecting aquatic life in the stream, we might do a biological
survey, with counts of different groups of organisms.
Table 7: Example of biological monitoring data
Date Mayflies Stoneflies Caddisflies
2010-06-11 12 3 56
Software for Data Analysis
In order to make better use of the data we have and handle new data coming in, Prairie Rivers of Iowa
has been using the computer programming language R 24 and the integrated development environment
R Studio25.
R is a programming language and software environment for statistical computing and graphics. Unlike
point and click spreadsheet and database applications, it involves typing up a series of commands—a
script. Scripts can be embedded in a text document using a lightweight markup language (R Markdown)
and exported as a print (PDF) or web (HTML) document, so that a graph or table can be presented
alongside a discussion of the findings and the code used to produce it.
24
https://www.r-project.org/
25
https://rstudio.com/
31This approach has a steep learning curve when doing an analysis for the first time, but offers a number
of benefits moving forward.
• When new data becomes available or a mistake needs to be corrected, a report
containing multiple graphs or tables can be updated in minutes just by running
the script.
• There is potential to quickly produce multiple reports customized for a monitoring
station or date range.
• If there are questions about how the analysis was done, all the steps used in the
analysis are documented in the code.
• Since the software is free, anyone can reproduce and build on the results given the
source data and the script, a concept called reproducible research.
• Since R is used by scientists at the US Geological Survey, there are scripts and
packages available for retrieving flow data from USGS gages, and water quality
data from EPA databases.
• It can replace some of the functions of database software, manipulating and combining
large data tables.
• Since R is widely used for data science and statistics, there are scripts and packages
available for a number of advanced methods that are helpful for interpreting water
quality data, such as boxplots, trend analysis, power analysis, and tests for
statistical significance.
• It opens up the possibility of creating interactive web applications using R Shiny
platform (free for limited usage, with paid plans for higher traffic).
Sources of Data
AQuIA
The Iowa DNR maintains a public information portal26, AQuIA, for retrieving the results of water
monitoring conducted by the Water Quality Monitoring and Assessment section of Iowa DNR 27 or one
of its designees. The website includes tools for searching and downloading data by county, watershed,
program, and characteristics measured. Each monitoring station has a summary page with location
details and widgets for generating graphs. Data is typically uploaded within a month of collection.
26
https://programs.iowadnr.gov/aquia/
27
https://www.iowadnr.gov/Environmental-Protection/Water-Quality/Water-Monitoring
32Table 8: Story County data available on Iowa DNR AQuiA database, as of Dec 6, 2020
Facility (Program) Records Sites Analytes Date Range
Iowa DNR surface
water monitoring 23,0539 33 257 10/1998 - 10/2020
data
Iowa DNR
groundwater 998 8 173 08/2002 - 11/2019
monitoring data
Iowa snapshots 538 33 4 10/2006 - 05/2013
Fish tissue monitoring 983 5 165 08/1983 - 9/2013
(9376 records) Many of the records for Story County come from a single site, the South Skunk River near
Cambridge28. It is one of 60 sites in the Iowa DNR’s ambient stream monitoring network29 that help to
evaluate water quality status and trends statewide. This stream has been monitored monthly since
October 1998 for a wide variety of parameters, including:
• Field measurements, such as dissolved oxygen and flow
• Fecal indicator bacteria, such as E. coli
• Inorganic chemicals (naturally occurring but influenced by humans) such as chloride
• Nutrients, such as nitrogen
• Pesticides, such as carbonyl
• Volatile organic compounds such as trihalomethanes
• Metals, such as lead
Some additional sites in the ambient stream monitoring network are located outside the county, but
may be helpful for interpreting data from their tributaries in Story County (Figure 7). The nearest
downstream station from Indian Creek, Wolf Creek, and Clear Creek (draining the central and southeast
part of the county) is on Indian Creek near Colfax30. The nearest downstream station from Ballard Creek
(in the southwest) is the South Skunk River near Oskaloosa31. The nearest downstream station from
Minerva Creek (in northeast part of the county) is the Iowa River downstream of Marshalltown32.
28
https://programs.iowadnr.gov/aquia/Sites/10850002
29
https://www.iowadnr.gov/environmental-protection/water-quality/water-monitoring/streams The 2016-2021 ambient water
monitoring strategy is described here. http://publications.iowa.gov/23682/
30
https://programs.iowadnr.gov/aquia/sites/10500001
31
https://programs.iowadnr.gov/aquia/sites/10620001
32
https://programs.iowadnr.gov/aquia/sites/10640002
33Figure 8: Examples of 1999-2000 water quality data from ambient stream monitoring sites. Data from these sites can be
compared to tributaries monitored by local partners.
(8068 records) A second site on the South Skunk33, at Sleepy Hollow Access north of Ames, was formerly
part of the ambient stream monitoring network and a study on urban impacts to water quality, but is no
longer being monitored by the DNR. Sampled monthly from October 1999 to September 2014, it will be
a rich source of data to support the Headwaters of the South Skunk River WMA in watershed planning.
(1500 records) Hickory Grove Lake is one of 138 publicly owned lakes in the Ambient Lake Monitoring
Program. Lakes are tested three times a year between May and September for dozens of indicators of
trophic state and lake health, including nutrients, secchi depth, and chlorophyll (excluding the past
few years when the lake was drained for restoration). Additional testing of Hickory Grove Lake has
been done as part of Total Maximum Daily Load study.
33
https://programs.iowadnr.gov/aquia/Sites/10850003
34
South Skunk River at Sleepy Hollow AccessA screenshot of DNR’s interactive map of AQuIA sites is shown below. Some sites around the county have
been monitored once or infrequently for various purposes.
• Surface water is tested following reported fish kills to determine whether the stream
should be placed on the Impaired Waters List. For example, Long Dick Creek was tested
biweekly for the first half of 2009, while Walnut Creek was tested once in 2011.
• When fish or invertebrates are surveyed as part of the ambient biological monitoring
program, water quality is also tested, on that day only. For example, sites on Walnut
Creek, Ditch 81, Dye Creek, Bear Creek, Worrell Creek, Onion Creek, and Ballard Creek
each were tested once or twice for over 20 parameters as part of this program.
• Lab testing (E. coli, nitrate, phosphate, and ammonia) to support volunteer snapshot
events in the Ioway (Squaw) Creek watershed. This was done between 2006-2013 as a
partnership between the Iowa DNR’s IOWATER program, the Squaw Creek Watershed
Coalition, and the Iowa Geological Survey.
• Monitoring of fish tissue for mercury and other persistent contaminants. Despite
other water quality concerns, fish caught in most Iowa waters (including the South
Skunk River and Hickory Grove Lake in Story County) are safe to eat.34
Figure 9: Map of DNR monitoring sites from AQuIA database
34
https://iowadnr.gov/environmental-protection/water-quality/water-monitoring/fish-tissue
35You can also read