Measuring Coastal Acidification Using In Situ Sensors in the National Estuary Program - EPA
←
→
Page content transcription
If your browser does not render page correctly, please read the page content below

Measuring
  Coastal
  Acidification
  Using In Situ
  Sensors in
  the National
  Estuary
  Program

  2021
  EPA-842-R-21001

U.S. Environmental Protection Agency. 2021. Measuring
Coastal Acidification Using In Situ Sensors in the
National Estuary Program. Washington D.C., Document
No. EPA-842-R-21001.

Note: All photos credited to the National Estuary
Programs identified in this report, unless otherwise noted.
Co-Authors:
Holly Galavotti, U.S. EPA Office of Water
Barnegat Bay
   Jim Vasslides, Senior Program Scientist, Barnegat Bay Partnership
   Matthew Poach, NOAA NMFS Milford Laboratory
Casco Bay
  Curtis Bohlen, Director, Casco Bay Estuary Partnership
  Christopher W. Hunt, University of New Hampshire
  Matthew Liebman, U.S. EPA Region 1
Coastal Bend Bays
  Xinping Hu, Harte Research Institute for Gulf of Mexico Studies, Texas A&M University–Corpus Christi
  Melissa McCutcheon, Ph.D. Candidate, Harte Research Institute for Gulf of Mexico Studies, Texas A&M
  University–Corpus Christi
Long Island Sound Study
  Jim Ammerman, Long Island Sound Study Science Coordinator
  Jim O’Donnell, University of Connecticut
  Kay Howard-Strobel, University of Connecticut
Massachusetts Bays (MassBays)
  Prassede Vella, Staff Scientist, Massachusetts Bay National Estuary Partnership
Mobile Bay
  John Lehrter, University of South Alabama and Dauphin Island Sea Lab
San Francisco Bay
  Karina Nielsen, San Francisco State University, Estuary & Ocean Science Center
  John Largier, University of California Davis, Coastal and Marine Sciences Institute
Santa Monica Bay
  Tom Ford, Santa Monica Bay National Estuary Program
  Alex Steele, Los Angeles County Sanitation District (Retired)
Tampa Bay
  Kimberly K. Yates, U.S. Geological Survey, St. Petersburg Coastal and Marine Science Center
Tillamook Bay Estuary
    York Johnson, Water Quality Coordinator, Tillamook Estuaries Partnership
    Cheryl Brown, U.S. EPA ORD, Pacific Ecological Systems Division
    Stephen R. Pacella, U.S. EPA ORD, Pacific Ecological Systems Division
Reviewers:
Grace Robiou, U.S. EPA Office of Water
Nicholas Rosenau, U.S. EPA Office of Water
Bridget Cotti-Raush, 2019 Knauss Fellow
Nancy Laurson, U.S. EPA Office of Water
Alice Mayio, U.S. EPA Office of Water (retired)
Vince Bacalan, U.S. EPA Office of Water
Bill Fisher, U.S. EPA Office of Research and Development
Rochelle Labiosa, U.S. EPA Region 10
Patti Meeks, U.S. EPA Office of Research and Development

Any mention of trade names, products, or services does not imply an endorsement by the U.S. Government or EPA.
EPA does not endorse any commercial products, services, or enterprises.
The views expressed in this report are those of the authors and do not necessarily represent the views or policies of
the U.S. Environmental Protection Agency.
Table of Contents

Executive Summary.......................................................................................................... 1
Background on Coastal Acidification and its Impacts................................................... 4
   1.1 Description of Ocean and Coastal Acidification................................................................................. 4
   1.2 The Vulnerability of Nearshore and Estuarine Waters to Acidification................................................ 5
   1.3 A New Approach to Monitoring Coastal Acidification at National Estuary Program sites.................. 6

Estuary Characteristics, Monitoring Goals and Timeline............................................... 9
   2.1 Estuary Characteristics....................................................................................................................... 9
   2.2 Goals of Monitoring............................................................................................................................. 9
   2.3 Monitoring Timeline........................................................................................................................... 12

Monitoring Methods........................................................................................................ 13
   3.1 Water Chemistry Sensors (pCO2, pH)............................................................................................... 13
   3.2 Telemetry........................................................................................................................................... 15
   3.3 Deployment Locations...................................................................................................................... 15
   3.4 Discrete Sampling............................................................................................................................. 27
   3.5 Data Collection, Processing and Storage Methods.......................................................................... 30
   3.6 Cost Information and Funding Sources............................................................................................ 34

Deployment and Data Management Challenges and Lessons Learned..................... 36
   4.1 Deployment Challenges and Lessons Learned............................................................................... 36
   4.2 Data Management Challenges and Lessons Learned..................................................................... 43
   4.3 Data Interpretation Challenges and Lessons Learned..................................................................... 44
   4.4 Data Quality Challenges and Lessons Learned............................................................................... 45

Monitoring Partnerships and Public Outreach............................................................. 46
   5.1 National Estuary Program Monitoring Partnerships.......................................................................... 46
   5.2 Partnership Challenges and Lessons Learned................................................................................ 48
   5.3 Public Outreach Efforts..................................................................................................................... 50

Preliminary Monitoring Results...................................................................................... 52
Next Steps........................................................................................................................ 67
References....................................................................................................................... 71
Executive Summary
Estuaries and coastal areas are highly vulnerable            across the country through EPA’s National Estuary
to the impacts of acidification on shellfish, coral          Programs (NEP) and their partners. This approach
reefs, fisheries, and the commercial and recreational        captures the high-resolution data that are needed to
industries that they support. Yet, little is known about     understand variability associated with acidification
the extent of this vulnerability and the estuary-specific    and ultimately to inform trends and mitigation and
drivers that contribute to acidification, such as nutrient   adaptation strategies for these vulnerable systems.
enrichment from stormwater, agriculture and wastewater       This report details the plans and experiences of ten
discharges, upwelling of CO2-rich seawater, elevated         NEPs geographically distributed around the U.S. coast
atmospheric CO2 from urban and agricultural activities,      and their partners in conducting this monitoring over
benthic and marsh-driven processes, and alkalinity and       the last four years (2015 – 2019). The report illustrates
carbon content of freshwater flows. Comprehensive,           the monitoring goals, deployment methods, data
high resolution monitoring data are needed at varying        analysis, costs, preliminary results, and the role of
spatial and temporal scales to provide actionable            partnerships in their successes. The preliminary results
information tailored to each estuary. Because carbonate      have already improved our understanding of baseline
chemistry in the coastal environment can be affected by      carbonate chemistry conditions in these estuaries,
nutrient dynamics, understanding how nutrient inputs         the factors affecting spatial and temporal variability,
exacerbate acidification impacts is essential for the        and the drivers responsible for changes in pCO2 and
formulation of estuary-specific actions.                     associated acidification. The sensors are successfully
EPA supports coastal acidification monitoring and            capturing seasonal variability and finer temporal trends
research in various ways (Table 1). The purpose of this      that provide information on diel variability, physical
report is to share EPA’s approach to long-term coastal       processes (e.g., weather, tides), and biological activity
acidification monitoring in which it initiated the use of    which cannot be captured with discrete sampling alone.
autonomous monitoring sensors for dissolved carbon           The preliminary data indicate that there are regional
dioxide (pCO2) and pH deployed in situ in estuaries          differences in the drivers of acidification, particularly the

                                                                 Measuring Coastal Acidification Using In Situ Sensors
                                                                                                                             1
                                                                                    in the National Estuary Program
influence of upwelling events vs. land-based freshwater      EPA believes that sharing the methodologies and
    sources. Several of these NEPs have calculated               lessons learned in this report will lead to information
    aragonite saturation state, an indicator of conditions       sharing and technology transfer that will benefit the NEP
    in which mollusk shells begin to dissolve and have           community and other coastal monitoring groups, such
    identified certain vulnerable conditions for shellfish and   as NOAA’s 29 National Estuarine Research Reserves. In
    other economically-important species in their estuaries.     addition, this report provides useful information to a wide
    Important lessons have been learned from these               variety of stakeholders - from state legislators to shellfish
    deployments. Biofouling, which inhibits effective            growers to concerned citizens - who are interested in
    sensor operation, was a significant challenge. Other         advancing the understanding of acidification drivers
    challenges were difficult weather conditions, such           in order to protect their vulnerable estuaries from the
    as winter icing and hurricanes, and red tides that           impacts of acidification. The NEPs identified in this
    prohibit dive operations. These situations result in the     report have already begun integrating their monitoring
    temporary cessation of the sensor deployments and            results into actionable plans, such as their long-term
    consequently data gaps. Two NEPs avoided biofouling          Comprehensive Conservation and Management
    and inhospitable environmental conditions by deploying       Plans (CCMPs) and State of the Bay reports, to inform
    the instruments in weatherproof coolers with flow-           stakeholders and identify ways to address coastal
    through systems. The ability to incorporate telemetry        acidification vulnerabilities.
    to transmit real-time data was seen as a very valuable       Over the long term, as these NEPs and other groups
    asset to signal equipment failure or other reasons for       continue this monitoring, the monitoring data will help
    a lapse in data collection. To address several of the        further characterize the vulnerability of these estuaries
    challenges, these NEPs recommended purchasing                to acidification, detect potential impacts of acidification
    redundant sensors to minimize any gaps in data               on locally important industries, and quantify the relative
    collection but found it to be cost-prohibitive. They also    contribution of specific pollution sources. The state of
    stressed the importance of collecting in situ data for       the science of long-term coastal acidification monitoring,
    associated parameters so that acidification can be           including advancement of in situ autonomous pH and
    interpreted in the context of inshore processes, such as     pCO2 sensors, is rapidly evolving. The monitoring
    system hydrodynamics, mixing, and primary production.        community is encouraged to continue to share results
    This EPA report provides additional insights on the          and lessons learned to inform applications of these data
    challenges, lessons learned, and unique solutions            to guide mitigation and adaption strategies.
    regarding the use of these autonomous sensors in
    diverse estuarine environments.

2    Executive Summary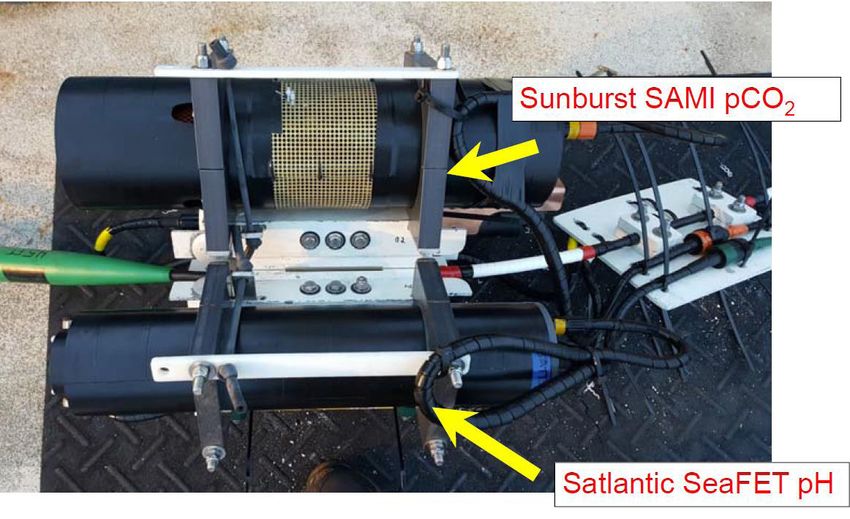
Table 1. EPA’s Coastal Acidification Activities

        ACTIVITY                                              DESCRIPTION

 Inter-Agency Working        EPA is an active member of the Inter-Agency Working Group on Ocean
 Group on Ocean              Acidification (IAG-OA) which develops and updates the Strategic Plan for Federal
 Acidification               Research and Monitoring of Ocean Acidification, provides Reports to Congress,
                             and conducts other activities. The IAG-OA also spearheaded the creation of the
                             Ocean Acidification Information Exchange in collaboration with the Northeastern
                             Regional Association for Coastal Ocean Observing Systems (NERACOOS) to
                             share resources, access up-to-date information, and interact across disciplines
                             and regions.

 NEP Coastal Acidification   In 2015 and 2016, EPA began funding coastal acidification monitoring equipment
 Monitoring                  for several NEPs and their partners identified in this report.

                             In 2018, EPA published Guidelines for Measuring Changes in Seawater pH and
                             Associated Carbonate Chemistry in Coastal Environments of the Eastern United
                             States (Pimenta and Grear, 2018).

                             EPA Region 1 (New England) increased the technical capacity of citizen scientists
                             monitoring coastal acidification in the Northeast by supporting Shell Day (2019).

                             EPA funded the Ocean to Plate to Ocean pilot study in Casco Bay that tests the
                             impact of shell material deposition on pH and shellfish recruitment in tidal flats
                             and demonstrates the feasibility and value of a shell collection program in Maine.

 EPA’s National Coastal      EPA added total alkalinity as a research parameter to the 2020 survey. These
 Condition Assessment        measurements will provide a baseline understanding for coastal acidification
 (NCCA)                      buffering capacity against the drivers of coastal acidification for 750 sites across
                             the contiguous U.S. and will improve models for predicting alkalinity from salinity
                             in under-sampled areas.

 EPA’s Office of Research    ORD’s Narragansett, RI Laboratory Research Facility and Pacific Ecological
 and Development (ORD)       Systems Division in Newport, OR conduct monitoring and research on the
 Coastal Acidification       ecological impacts of coastal acidification. Research is also being conducted to
 Research                    attribute coastal water quality impacts to local and global acidification drivers.

                                                                                               Executive Summary    3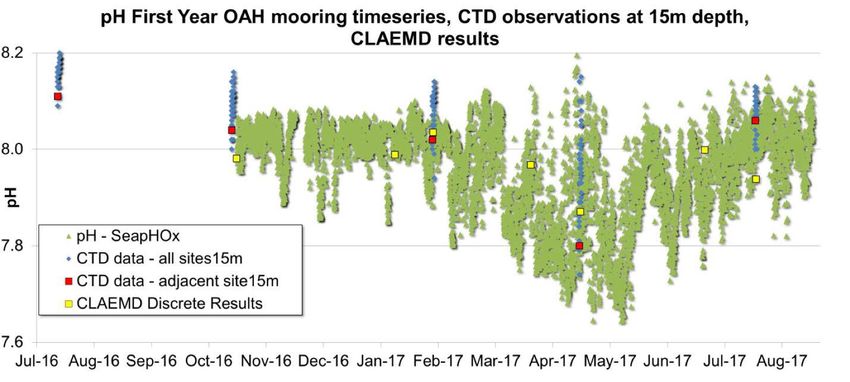
Background on Coastal
    Acidification and Its Impacts

    1.1
    Description of Ocean and Coastal Acidification
    The ocean is currently experiencing rapid rates of              Since preindustrial times, the average ocean surface
    acidification and carbonate ion reduction, which may            water pH has fallen by approximately 0.1 units (30%)
    exceed changes of the past 300 million years (Hönisch           globally, from approximately 8.21 to 8.10 (Royal Society,
    et al., 2012). Globally, one-third of anthropogenic CO2         2005). However, pH could decrease a further 0.3-0.4 pH
    released into the atmosphere is being absorbed by the           units globally by 2100 if atmospheric CO2 concentrations
    ocean every year (NRC, 2010). When CO2 dissolves in             reach 800 ppm (Orr et al, 2005). Biological effects of
    seawater, it lowers the pH and reduces the availability         acidification are occurring now and could become
    of carbonate ions, impairing the ability of marine              more severe. For example, pteropods, a pelagic sea
    organisms to form calcified shells or skeletons and             snail that is an important prey species for fish such as
    impacting other fundamental physiological processes             salmon, cod, and mackerel, are especially vulnerable to
    such as respiration, photosynthesis, and reproduction.          corrosive conditions. Mass mortality events in shellfish
    These impacts alter food webs and negatively affect             hatcheries have also been linked to ocean acidification.
    economies dependent on services ranging from coral              Coral reefs, which provide trillions of dollars in societal
    reef tourism to shellfish harvesting and fisheries.             services worldwide, are projected to experience
                                                                    decreased net calcification, a process necessary to
                                                                    maintain ecosystem function (Bushinsky et al, 2019).

                         Conceptual diagram comparing the state of carbonates in the oceans under the
                         lower-acid conditions of the late 1800s with the higher-acid conditions expected for
                         the year 2100. Image: Encyclopædia Britannica, Inc.

     Measuring Coastal Acidification Using In Situ Sensors
4
     in the National Estuary Program
1.2
The Vulnerability of Nearshore and Estuarine Waters to Acidification
In estuarine and coastal areas, the causes, magnitudes,      and decay, CO2 is respired by microbes and the gas is
and rates of acidification differ in complexity as           dissolved into seawater. As a result, local and regional
compared to the open ocean due to many natural and           “hot spots” of increases in pCO2 and declines in pH in
anthropogenic processes. In the coastal environment,         coastal areas can occur, which are likely to be magnified
in addition to atmospheric CO2 inputs, acidification         when combined with other stressors in coastal ocean
could be locally amplified by a complex array of factors,    (Kelly et al, 2011). In addition, many coastal organisms
including: the alkalinity and carbon content of freshwater   have sensitive estuarine and nearshore life stages
flows; direct acid deposition; elevated atmospheric          that coincide with mid and late summer extremes in
CO2 from urban and agricultural activities (Northcott        dissolved oxygen, pH, and other characteristics of the
et al, 2019); and changes in coastal circulation and         carbon system and are thus expected to be especially
upwelling of CO2-rich seawater from the ocean. In            vulnerable (Wallace et al, 2014). These complex
particular, direct nutrient enrichment from stormwater,      biochemical dynamics need further study to better
agriculture and wastewater discharges can contribute         understand the relative contribution of these drivers to
to coastal acidification. Excess nutrients fuel algae        help coastal communities mitigate or adapt to coastal
and phytoplankton growth. As the phytoplankton die           acidification.

                        Kelley et al. 2011

                         Kelly et al. 2011

                                                                 Background on Coastal Acidification and its Impacts     5
1.3
    A New Approach to Monitoring Coastal Acidification at NEP sites
    On the national scale, several agencies conduct                have been used extensively in the open ocean to
    ocean acidification monitoring. For example, NOAA’s            monitor ocean acidification, however, their deployment
    Ocean Acidification Monitoring Program’s monitoring            in situ in nearshore and estuarine waters is new and
    network includes repeat hydrographic surveys, ship-            challenging due to rapid variation over large ranges
    based surface observations, and time series stations           in salinity and chemical composition, accuracy issues
    (mooring and ship-based) in the open ocean waters              such as biofouling and sensor drift, and other factors
    of the Atlantic, Pacific and Arctic, and the Gulf of           (Sastri et al., 2019). In 2018, EPA published “Guidelines
    Mexico. The development of new long-term monitoring            for Measuring Changes in Seawater pH and Associated
    systems is critical for filling the existing knowledge gaps    Carbonate Chemistry in Coastal Environments of the
    and advancing the current technology, especially in            Eastern United States” which includes a discussion
    highly vulnerable areas such as high-latitude regions,         of these autonomous sensors (Pimenta and Grear,
    upwelling regions, warm and cold-water coral reefs,            2018). Typically, as part of quality control, in addition
    and in coastal regions and estuaries where less is             to in situ measurement of pCO2 and pH, discrete water
    understood about the temporal and spatial variability of       samples are collected by the monitoring programs to
    acidification.                                                 be analyzed in the laboratory for total alkalinity (TA) and
    The carbonate chemistry of estuaries is controlled by          dissolved inorganic carbon (DIC). Any two of the four
    multiple co-occurring chemical, biological, and physical       parameters (pH, pCO2, DIC and TA) can be used to
    processes operating at various rates (from sub-hourly to       measure aragonite state. Currently, pH and pCO2 are
    inter-annual time scales). Because coastal environments        the two parameters that are routinely measured using
    have greater pH variability than the open ocean, the           deployed sensors, but extensive research is currently
    ability to detect real trends in coastal acidification and     underway to develop the technology that will permit
    distinguish these from background variability requires         development of sensors to measure DIC (e.g. at Woods
    high-quality, long term, high resolution monitoring. In        Hole Oceanographic Institution).
    addition, continuous monitoring of multiple parameters         EPA and the National Estuary Program (NEP) play
    at a high temporal and spatial scale is vital in order to      an important role in understanding the impact of
    distinguish the relative influence of the drivers of coastal   coastal acidification on water quality and living
    acidification, particularly nutrient-enhanced acidification.   marine resources. The NEP is a place-based program
    There are a small number of sites capturing long-term,         established by Section 320 of the Clean Water Act with
    decadal, coastal pH data useful for understanding              the mission to protect and restore the water quality and
    short-term and spatial variation in coastal acidification,     ecological integrity of estuaries of national significance.
    including NOAA’s National Estuarine Research                   The 28 NEPs are located in coastal watersheds along
    Reserves. However, the tools and approaches that are           the Atlantic, Gulf, and Pacific coastlines, and in Puerto
    used are not consistent with those needed to detect            Rico. Each NEP focuses on the restoration of a study
    climate scale trends and changes associated with               area that includes the estuary and a portion of the
    anthropogenic changes in atmospheric CO2. The use of           surrounding watershed. The NEPs are administered in
    autonomous pCO2 and pH sensors for high-resolution             a variety of institutional settings, including state and
    monitoring in the estuarine environment is a new,              local agencies, universities and individual nonprofit
    innovative approach that will complement the existing          organizations. Of the 28 NEPs, 19 have identified coastal
    long-term pH measurements to provide climate level             acidification as an emerging threat to their coastal
    measurements. These types of autonomous sensors                resources in their Comprehensive Conservation and

6     Background on Coastal Acidification and its Impacts
Management Plans (CCMPs, 2003-2019), which contain The NEPs have demonstrated their leadership on this
actions to address water quality and living resource issue by expanding the use of autonomous pCO2 and
challenges and priorities (Figure 1). The CCMPs pH sensors deployed in situ in estuarine and nearshore
are long-term plans developed through a unique, environments. Beginning in 2015, EPA funded nine NEPs
consensus-based approach, and implemented with a to purchase autonomous pCO2 and pH sensors to better
variety of local partners. Many of these NEPs highlight characterize carbonate conditions and thus obtain a
the need for more data to improve understanding of better understanding of coastal acidification in their
acidification trends, the causes of low pH in their study respective estuaries (Figure 1). Mobile Bay also recently
areas, and effects of acidification on living resources. purchased these sensors to conduct this monitoring.
They also describe the need for local monitoring and EPA’s Office of Research and Development (ORD)
research to develop acidification adaptation and Pacific Ecological Systems Division is also conducting
management strategies. For example, in estuaries in this monitoring in Tillamook Estuary. Over the past four
which more acidic conditions are driven by upwelling years, monitoring at eight1 of these ten NEPs has been
events, strategies could include alerts to shellfish conducted through the collection of sub-hourly data
hatcheries warning of highly acidic conditions and (pCO2 and pH) and optimization of monitoring methods
implementing aquaculture techniques to buffer hatchery and data analysis procedures. The monitoring at these
systems. In estuaries where acidic conditions are driven ten NEPs are the subject of this report. The Puget
by eutrophic conditions, nutrient management strategies Sound Partnership, primarily through the Washington
ranging from source reduction to seagrass restoration Department of Ecology, also conducts coastal
can be used to reduce acidification in vulnerable areas. acidification monitoring using autonomous, in situ pH
Several NEPs link acidification to their nutrient action and pCO2 sensors and the regular collection of discrete
plans as a potential outcome of nutrient enrichment. In water samples. Although this data is not included in
addition, 13 of the 28 NEPs have referenced the issue this report, more information can be found here: https://
of acidification in their State of the Bay reports and cite ecology.wa.gov/Water-Shorelines/Puget-Sound/Issues-
the need for more monitoring data to establish baselines problems/Acidification.
and develop models to better understand long-term
trends in their estuaries (Figure 1).
1
MassBays and Mobile Bay are developing their monitoring methods but have not yet deployed their sensors.
Background on Coastal Acidification and its Impacts 71 Casco Bay
Estuary
2
Partnership
3
Puget Sound Long Island 7 4 Massachusetts
Partnership 28 Sound Study 8 5 Bays NEP
6
Tillamook 26 27 10 9 Barnegat Bay
Estuaries Partnership
Partnerships 11
12
San 25
Francisco
Estuary
Program 24
13
Santa Monica 23
Bay Restoration
Foundation
Mobile Bay NEP
19
18 Tampa Bay
21 20
Coastal Bend Bays Estuary Program
22 17 14
and Estuaries Program 16
15
NEP references acidification in NEP addresses acidification NEP conducts acidification monitoring
latest State of the Bay report in their CCMP using autonomous pH and pCO2 sensors
1 Casco Bay Estuary Partnership 10 Partnership for the Delaware 21 Galveston Bay Estuary Program
2 Piscataqua Region Estuaries Estuary 22 Coastal Bend Bays and Estuaries
Partnership 11 Delaware Center for the Inland Bays Program
3 Buzzards Bay NEP 12 Maryland Coastal Bays Program 23 Santa Monica Bay Restoration
4 Massachusetts Bays NEP 13 Albemarle-Pamlico NEP Foundation
5 Narragansett Bay Estuary 14 Indian River Lagoon NEP 24 Morro Bay NEP
Program 15 San Juan Bay Estuary Program 25 San Francisco Estuary Partnership
6 Peconic Estuary Partnership 16 Coastal and Heartland NEP 26 Tillamook Estuaries Partnerships
7 Long Island Sound Study 17 Sarasota Bay Estuary Program 27 Lower Columbia Estuary
8 New York-New Jersey Harbor Partnership
18 Tampa Bay Estuary Program
Estuary Program 28 Puget Sound Partnership
19 Mobile Bay NEP
9 Barnegat Bay Partnership
20 Barataria-Terrebonne NEP
Figure 1. National Estuary Programs Addressing Coastal Acidification
8 Background on Coastal Acidification and its ImpactsEstuary Characteristics,
Monitoring Goals and Timeline
2.1 2.2
Estuary Characteristics Goals of Monitoring
The ten NEPs, along with their partners, that are The ten NEPs share many of the same coastal
conducting coastal acidification monitoring using the acidification monitoring goals. These goals are centered
continuous sensors include the following: on understanding the existing conditions of carbonate
• East Coast chemistry in the estuaries and how it is impacted by
terrestrial and oceanic inputs.
▪ Casco Bay Estuary Partnership, ME
Common Goals:
▪ Massachusetts Bay National Estuary Partnership,
MA (MassBays) • Establish carbonate chemistry baseline data to
determine background conditions.
▪ Long Island Sound Study, NY & CT
• Better characterize the variability of carbonate
▪ Barnegat Bay Partnership, NJ conditions (daily, seasonal, and annual fluctuations)
• Gulf of Mexico at a “continuous” time scale.
▪ Tampa Bay Estuary Program, FL • Improve the understanding of land-based inputs
▪ Mobile Bay National Estuary Program, AL (nutrient loading, freshwater flows) versus oceanic
influence (upwelling) on the carbonate chemistry and
▪ Coastal Bend Bays and Estuaries Program, TX oxygen dynamics.
• West Coast • Determine how carbonate chemistry patterns are
▪ San Francisco Bay Estuary Partnership, CA changing.
▪ Santa Monica Bay National Estuary Program, CA • Determine the effect of coastal acidification on
▪ EPA ORD/Tillamook Estuaries Partnership, OR plankton, shellfish and other species and the
potential economic impacts to the bays and
These ten NEPs vary in geographic location, size, estuaries.
environmental stressors, coastal dynamics and
processes, and local economic interests. Santa Monica • Understand the relationship of alkalinity and salinity
Bay is unique among these estuaries as the only deep, and inform our understanding of carbon dynamics.
open coastal site as compared to the other more • Build confidence in the performance of the sensors.
shallow, enclosed estuaries.
Based on their defining physical, hydrologic and living
• Watershed Size: Small (663 mi2–Barnegat Bay) to resource characteristics, these NEPs also have regional
large (12,580 mi2–Coastal Bend Bays) and estuary-specific monitoring goals, which are
• Land Use: Urbanized (Barnegat Bay) versus rural presented below.
and agricultural (Tillamook Estuary) East Coast Regional Goals:
• Watershed Population: 25,000 (Tillamook Estuary) to The four NEPs in the East Coast are characterized by
9,000,000 (Long Island Sound) cool waters, with some coastal upwelling. Two of the
• Estuary Depth: Shallow (Tillamook Estuary, NEPs (Casco Bay and MassBays) are characterized
San Francisco Bay) versus deep and open coast by large tidal influence, ranging up to 9-14 ft. These
(Santa Monica Bay) NEPs have numerous priorities, including protecting and
restoring shellfish habitat. Their goals are to understand
• Acidification Drivers: Freshwater inputs
the impact of coastal acidification on shellfish resources/
(Coastal Bend Bays) versus ocean upwelling
industry in the estuaries, as well as shellfish restoration
(Santa Monica Bay)
and aquaculture efforts that are occurring in the area.
Measuring Coastal Acidification Using In Situ Sensors
9
in the National Estuary Program• Casco Bay: The Maine legislature created a • Barnegat Bay: Understand the interaction of
bipartisan ocean acidification panel. They produced multiple acidification enhancers in the Bay including
the report “Commission to Study the Effects of eutrophication, localized seasonal coastal upwelling
Coastal and Ocean Acidification on Commercially and extremely low pH freshwater sources.
Harvested and Grown Species” and described Gulf of Mexico Regional Goals:
acidification as a major stressor for lobster and
clam fisheries in Maine and the importance of The three NEPs in the Gulf of Mexico region are in a
understanding calcification to protect the aquaculture transition zone between warm-temperate and tropical
industry. This monitoring will help understand the biogeographic provinces, and are characterized by
impact of coastal acidification on Maine’s shellfish warm, productive waters. These NEPs described their
resources and other living resources. goals as the following.
• MassBays: The overall objective is to identify • Tampa Bay:
coastal acidification conditions and to determine ▪ Assess the contribution of seagrass, mangrove
the potential impacts of acidification on aquaculture forest and salt marsh habitats to sequestration
practices of the eastern oyster, Crassostrea virginica of CO2 as blue carbon, and the role of seagrass
that would serve to inform the shellfish industry in protecting Tampa Bay’s marine species from
and other stakeholders. With the convening of the harmful effects of climate change and coastal and
Massachusetts Ocean Acidification Commission ocean acidification.
(2018) by the Massachusetts legislature and the ▪ Understand the seasonal and diurnal variations in
establishment of the Massachusetts Shellfish carbonate chemistry in the bay, and the influence
Initiative, this project will provide baseline information of Gulf of Mexico waters.
for informed decision-making.
• Mobile Bay:
• Barnegat Bay: The objective is to determine if
coastal acidification is negatively impacting the ▪ Understand trends and variability in carbonate
shellfish restoration and aquaculture efforts that chemistry related to river discharge and mixing
are happening in the area. Hard clams (Mercenaria with Gulf of Mexico waters.
mercenaria) are the subject of both wild harvest and ▪ Develop predictive models of acidification and
aquaculture, while eastern oysters are an expanding hypoxia and impacts to economically important
aquaculture product in the estuary. Both clams and shellfish and finfish populations.
oysters are the focus of restoration efforts due to
• Coastal Bend Bays: Examine the role of freshwater
reduced wild populations compared to historic levels. inflow from rivers on the recently observed trends in
• Long Island Sound: Understand the why, how, the carbonate system changes in Aransas Bay.
and what controls the distribution of oxygen and
the extent and duration of hypoxia within the
Sound, which occurs annually in the summer and
the potential overlap of acidification. They use
buoys to observe daily fluctuations and long-term
improvements in hypoxia due to reductions in
nutrients.
10 Estuary Characteristics, Monitoring Goals and TimelineWest Coast Regional Goals: ▪ Understand the potential role of submerged
aquatic vegetation (eelgrass and algal
The NEPs in the West Coast region are characterized
macrophytes) and wetlands in modifying
as having cooler, deeper waters with prominent coastal
carbonate chemistry of shallow water habitats.
upwelling. These NEPs described their goals as:
▪ Understand the influence of coastal acidification
• Santa Monica Bay:
on restoration and health of the native shellfish, the
▪ Observe the impact of deep, colder water off the Olympia oyster and nursery habitat for Dungeness
California coast on acidification and hypoxia. crab fishery.
Capture the signal of upwelling events at 60m
▪ Understand the potential influence of coastal
depth and determine whether the narrowness of
acidification on migrating salmonid and other
the continental shelf plays a role.
endangered fish species in the estuary.
▪ Establish a baseline dataset to assess and track
• Tillamook Estuaries:
ocean acidification and hypoxia in the Bay,
which receives significant nutrient loading from ▪ In 2017, the Oregon Senate created the Oregon
anthropogenic activities. Coordinating Council on Ocean Acidification
and Hypoxia (OAH Council) to provide
▪ Develop expertise in operation and maintenance
recommendations and guidance for the State on
of the next generation of acidification monitoring
how to respond to this issue. The OAH Council
sensors.
developed a six-year Ocean Acidification
▪ Provide data for validation of model simulations, & Hypoxia Plan in 2019 in recognition that
and to inform restoration efforts by Santa Monica acidification and hypoxia events are undermining
Bay National Estuary Program. the state’s rich ocean ecosystem food web.
▪ Provide final quality assurance (QA)/quality control This monitoring will help to determine the role of
(QC) data to the West Coast-wide California watershed land use and eutrophication drivers
Current Acidification Network (C-CAN) that will be versus coastal ocean conditions on occurrence of
served publicly through the U.S. Integrated Ocean estuarine acidification and hypoxia.
Observing System (IOOS) network. ▪ Identify sources of nutrients, bacteria, and organic
• San Francisco: material using stable isotopes and microbial
source tracking upstream and downstream of
▪ Enhance understanding of how climate change
areas with high human land use modification.
and watershed modifications and activities
contribute to coastal acidification. ▪ Develop models to predict the impacts of climate
change and watershed activities on water quality.
▪ Detect low-pH waters intruding from the ocean,
especially during upwelling events in the spring
and summer, in contrast to freshwater inflow
events.
▪ Understand “natural cycles” within the Bay.
Agricultural runoff leads to eutrophication, but the
bay is not usually in a eutrophic state (no dense
algal blooms).
Estuary Characteristics, Monitoring Goals and Timeline 112.3
Monitoring Timeline
Monitoring of coastal acidification by the NEPs identified data (pCO2 and pH). MassBays deployed and tested
in this report began on the East Coast in 2015 in Casco equipment in 2020 and Mobile Bay plans to deploy
Bay and in many places continues today (Figure equipment in 2021. Coastal Bend Bays’ research pier
2). Over the past four years, these NEPs have been was destroyed in 2017 and the sensors could no longer
collecting hourly and sub-hourly coastal acidification be deployed.
2015 2016 2017 2018 2019 2020
East Coast
Casco Bay
pH 4/15 – 1/16 6/16 – 3/17 6/17 – 2/19
pCO2 4/15 – 1/16 6/16 – 3/17 4/17 – Present
Long Island Sound
12/16 – 2/17
pH 4/17 – 12/18 4/18 – 12/18 5/19 – Present
pCO2 4/17 – 12/18 4/18 – 12/18 5/19 – Present
12/16 – 2/17
Barnegat Bay
11/16 – 1/17 6/17 – 8/17 12/17 – 1/8
pH 7/19 – Present
pCO2 7/19 – Present
11/16 – 1/17 6/17 – 8/17 12/17 – 1/8
Gulf of Mexico
Tampa Bay
pH/pCO2 12/17 – Present
Coastal Bend Bays
pH/pCO2 11/16 – 8/17
West Coast
Santa Monica Bay
pH 11/16 – 9/17 1/18 – 1/19
pCO2 7/16 – 7/17 1/18 – 1/19
San Francisco Bay
3/20 – 10/20
pH/pCO2 2/18 – 11/19
Tillamook Bay
pH/pCO2 – EPA ORD 8/17 – Present
pCO2–Tillamook Estuaries Partnership 7/19 – Present
Figure 2. Timeline of pH and pCO2 Autonomous Sensor Deployments of eight NEPs.
12 Estuary Characteristics, Monitoring Goals and TimelineMonitoring Methods
3.1
Water Chemistry Sensors (pCO2, pH)
Two of the following four chemical parameters are chemistry. All ten of the NEPs are collecting in situ
needed to describe the seawater carbonate system measurements of temperature and salinity. Eight of the
–pCO2, pH, dissolved inorganic carbon (DIC) and NEPs are also measuring DO, and six are collecting
alkalinity–along with contemporaneous measures of in situ chlorophyll a data (also measured as in situ
temperature and salinity. To record pH and pCO2 data, fluorescence and photosynthetically active radiation
autonomous sensors are being used in the ten NEPs (PAR)). One NEP, San Francisco Bay is also measuring
(Table 2). Table 3 provides the specifications for these atmospheric CO2. These supporting data are measured
sensors including the accuracy, precision, resolution, using a variety of Seabird, YSI, Aanderaa and other
and range. For measurement of pH, five of the NEPs instruments (Table 2).
use the Satlantic SeaFET and five use the SeapHOx. The magnitude and timing of changes in temperature,
The SeaFET pH sensor is an ion-sensitive field effect pCO2 and pH allows for a determination of the diurnal
transistor (ISFET), which is shown to be more precise and seasonal control. Salinity data provides information
and stable over time and more durable compared to pH about the influence of tides and to distinguish between
sensors that use a glass electrode. The pH range for watershed and oceanic influences. Temperature data
the SeaFET is 6.5 to 9.0 pH. The SeapHOX integrates a are used in conjunction with pCO2, salinity, and pH
SeaFET pH sensor with additional Seabird sensors that data to assess, among other things, the timing and
measure temperature, salinity, and dissolved oxygen magnitude of oceanic upwelling and its associated
(DO). The SeapHOX also includes an internal water effects on estuarine water chemistry. Dissolved oxygen
pump and anti-fouling technology. Both the SeaFET and paired with pCO2 can provide information about
SeapHOX have internal battery power and data logging biological activity. Measurements of chlorophyll a
capabilities. MassBays’ acidification system includes a and in situ fluorescence and photosynthetically
Sunburst Sensors SAMI-pH, which measures pH using active radiation (PAR) can provide an estimate of the
a colorimetric reagent method. The pH range for the abundance of phytoplankton which is an indicator of
SAMI-pH is 7 to 9. All pH data reported by the NEPs are the eutrophic condition of the estuary which can inform
on the “total” hydrogen ion concentration scale (pHT). an understanding of the impact of nutrient enrichment
For measurement of pCO2, six of the NEPs use the on the coastal carbonate chemistry. Turbidity provides
Sunburst Submersed Automated Monitoring Instrument information about the amount of suspended sediment in
(SAMI-CO2) and the remaining NEPs use a Sunburst water which can block light to aquatic plants and carry
Shipboard Underway pCO2 Environmental Recorder pathogens. Coupling the monitoring information with
(SuperCO2), Pro-Oceanus CO2-Pro, or Moored runoff or other watershed data allows for assessment of
Autonomous pCO2 (MAPCO2). The Sunburst SAMI‑CO2 oceanic versus watershed controls and may allow for
uses a colorimetric reagent method to measure the greater insight into local versus regional drivers.
partial pressure of CO2 from 200 to 600 µatm. The This monitoring data can also inform calculations of the
Sunburst Sensors SUPER-CO2, Pro-Oceanus CO2-Pro, aragonite saturation state of water. Aragonite saturation
and Moored Autonomous pCO2 (MAPCO2) all measure state is commonly used to track ocean and coastal
pCO2 using an infrared CO2 detector. However, the acidification because it is a measure of carbonate ion
Sunburst Sensors SUPER-CO2 is designed for shipboard concentration. As aragonite saturation state decreases,
analysis (not in situ deployment) and uses a Windows- it is more difficult for organisms to build and maintain
based computer for analysis control and data collection calcified structures. Calculating aragonite saturation
and display. requires that, in addition to temperature and salinity,
Additional parameters allow for the analysis and at least two of the carbonate parameters (pCO2, total
identification of the drivers of estuarine carbonate alkalinity, DIC, pH) be known. However, pCO2 and
Measuring Coastal Acidification Using In Situ Sensors
13
in the National Estuary ProgrampH data from the sensors are not an ideal set of input or pCO2 to calculate aragonite saturation states and act
parameters for calculating aragonite saturation (i.e. as validation data for the in-situ sensors, but many of
using the CO2SYS software package) because they these NEPs do not yet have the required discrete data
carry the most uncertainty (Orr et al, 2018). Discrete available to make these calculations and therefore do
samples analyzed for dissolved inorganic carbon (DIC) not yet report time series of calcium carbonate
and/or alkalinity can be used in conjunction with pH and/ saturation states.
Table 2. Continuous Monitoring Sensors for pH and pCO2 and other parameters.
OTHER SENSOR
NEP pH SENSOR pCO2 SENSOR
MEASUREMENTS1
Casco Bay Sea-Bird SeaFET Sunburst SAMI-CO2 Aanderaa Oxygen Optode (DO)
Seabird CTD (T, S, depth)
MassBays Sunburst AFT pH Sunburst SUPER-CO2 Turner Designs Cyclops C7
(Turbidity, CDOM)
Seabird SB45 (T, S)
YSI (chlorophyll a, DO)
Long Island Sea-Bird SeaFET Sunburst SAMI-CO2 Sea-Bird Hydrocat EP X2 (DO)
Sound YSI (T, S, Turbidity, chlorophyll a)
Barnegat Bay Sea-Bird SeaFET Pro-Oceanus CO2 Pro-CV YSI Exo2 Sonde
(T, S, DO, Turbidity)
Tampa Bay Sea-Bird SeapHOx Pro-Oceanus CO2-Pro SeapHOx (T, S, DO)
Wetlabs EcoPAR
Mobile Bay Sea-Bird SeapHOx Sunburst SAMI-CO2 YSI (T, S, DO, chlorophyll a)
Coastal Bend Sea-Bird SeaFET Sunburst SAMI-CO2 YSI (T, S)
Bays
Santa Monica Sea-Bird SeapHOx Sunburst SAMI-CO2 Sea-Bird SeapHOx (T, S, DO)
Bay
San Francisco Sea-Bird SeaFET Moored Autonomous Sea-Bird SeaFET & CTD
Estuary (surface) pCO2 (MAPCO2) (T, S, DO, chlorophyll a)
Sea-Bird SeapHOx Sea-Bird SeapHOX (T, S, DO)
(deep)
Tillamook Sea-Bird SeaFET & Sunburst SAMI-CO2 YSI (T, S, DO, chlorophyll a)
Estuary Sea-Bird SeapHOx
1
Temperature (T), Salinity (S), Dissolved oxygen (DO), Colored Dissolved Organic Matter (CDOM)
14 Monitoring MethodsTable 3. Sensor Specifications.
INSTRUMENT PARAMETER ACCURACY PRECISION RESOLUTION RANGE
SunBurst SAMI-CO2 pCO2 +/- 3 μatm ± 0.5–1 μatm 150–700a
Pro-Oceanus CO2- pCO2 ±0.5% of 0.01 ppm 0–10,000
Pro CV meas. val.
MAPCO2b pCO2 +/- 2 μatm 0.7 ppm 0–800
pH ± 0.05 ± 0.004 6.5–9
DO ± 0.1 mg L-1 0.2 µmol kg-1 120% of
Sea-Bird SeapHOx surf. sat.
Temp ± 0.002 °Cc 0.0001°C −5 to 45 °C
± 0.01°C d
Satlantic SeaFET pH ± 0.02 ± 0.004 6.5–9
Aanderaa Oxygen DO• Hydrodynamics within the estuary:
In 2015, Tampa Bay initiated a pilot study ▪ Freshwater versus ocean signals
to examine the potential role of seagrass (Tillamook Estuary)
recovery in buffering Tampa Bay from ocean ▪ Capture bay-wide mixing in a major inter-island
acidification. Discrete and autonomous tidal channel between the inner and outer bay
water chemistry measurements were (Casco Bay)
collected and used to calculate carbon ▪ Shallow water eutrophic versus deeper water
speciation, pCO2, and the saturation state aphotic contributions
of aragonite. The spatial and temporal (Santa Monica Bay, San Francisco Estuary).
heterogeneity and the water flow effects
observed in Upper and Lower Tampa Bay
informed the selection of the location and
appropriate sampling times and constraints
for the coastal acidification monitoring.
3.3
Deployment Locations
The deployment locations for the coastal acidification
monitoring equipment vary from fixed, land- based Buoy (Long Island Sound Mooring (Diver connects
structures (such as docks, piers, and pilings) to water- ARTG Buoy) SeapHOx sensor to pCO2)
Credit: Sanitation Districts of
based buoys and moorings. The following factors were Los Angeles County
considered when determining on the location of the
deployments:
• Presence of submerged aquatic vegetation, which
• Accessibility of the site (legal access, secure
may help mitigate acidification effects
location, accessible from shore or by boat).
(Tampa Bay, Tillamook Estuary).
• Availability of historic or present data monitoring
• Presence of resources that could be negatively
efforts at that location, which may be used to
impacted by acidification (shellfishing areas,
augment the NEP’s data collection effort or to
aquaculture, or shellfish restoration areas)
hindcast past pCO2 levels using historically
(MassBays, Barnegat Bay, Mobile Bay, San
available data.
Francisco Estuary, Tillamook Estuary).
• Existing piers, moorings or buoys from which to
deploy instrumentation. This can result in significant
cost savings (Long Island Sound, MassBays,
Tampa Bay, Mobile Bay, Santa Monica Bay,
Tillamook Estuary).
• Presence of point source, non-point source, or deep-
water upwelling inputs to study the influence of these
sources on coastal acidification (Tillamook Estuary).
Cooler (Coastal Bend Bays)
16 Monitoring MethodsCASCO BAY ESTUARY PARTNERSHIP
The Casco Bay acidification instrument array is located at a pier at Southern Maine Community College in South
Portland. The pier, which is over two-hundred feet long, is located in the Portland Channel, an important southern
outlet of Casco Bay, and near outlets of the Fore and Presumpscot Rivers in a relatively urban area of Casco Bay.
This location was selected because it is nearshore, accessible, and has historic nutrient data collected by the
Friends of Casco Bay.
The sensors are housed in a cage that is attached via a davit within a secure box at the pier in about 1 to 5
meters of water (depending on tide). The cage rests on the bottom, and the sensors are about 0.5 meter off the
bottom and always submerged. The metal frame with the instrument array is lowered through a trap door in the
pier. A hoist system and crank are used to raise the frame up for servicing.
Casco Bay instrument array Lowering instrument array through door in Southern Maine
Community College pier, Portland Channel, ME
Monitoring Methods 17MASSBAYS
In spring 2020 MassBays deployed a flow-through pumped system that incorporates pH and pCO2, temperature,
salinity and CDOM. The system will be mounted on a fixed pier in Duxbury Harbor, an estuarine embayment
where extensive oyster aquaculture takes place. Designed and constructed by the Center for Coastal
Environmental Sensing Networks (CESN) at UMass Boston, the system is built specifically to collect data year-
round as it will be minimally impacted by biofouling. Initial lab tests suggest pCO2 sensor is consistent with
calibration gases. The sampling chamber has been modified to reduce interference from bubbles. The pumping
system with mounting pole, float, and internal plumbing has been designed and constructed to minimize
bubbles. The mounting pole was deployed experimentally in early 2019 and has survived the winter (with 7 days
of below -12ºC temperatures) with minor warping resulting from sea ice.
MassBays’ instrument array in cooler Sensor deployment, town pier in Duxbury Bay, MA
Schematic diagram of the system being deployed in Mounting pole at Duxbury Harbor Town Pier for pumping
Duxbury Harbor (CESN, UMass Boston) seawater to the coastal acidification monitoring system
18 Monitoring MethodsLONG ISLAND SOUND
Long Island Sound is using an existing series of Long Island Sound Integrated Coastal Observing System
(LISICOS) buoys to measure coastal acidification. The buoy locations were chosen to observe daily fluctuations
and the expectation to observe long-term improvement associated with nutrient reduction in the sound. The
Western Long Island Sound (WLIS) buoy is the main buoy (south of Greenwich, Connecticut) and has pCO2 and
pH sensors at the bottom depth (approximately 70 feet deep). The ARTG buoy, 13.6 nm east of the WLIS Buoy, is
located at the edge of the hypoxia zone and has a pH sensor at the bottom depth (79 feet). If changes to hypoxia
were to occur over time due to management practices, they would be observed first at the ARTG buoy. These
buoys also collect DO, temperature, salinity, and current data. Sensors for meteorological (wind, air temperature,
pressure) are also mounted to the buoys.
Long Island Sound instrument array
WLIS buoy, south of Greenwich, CT
Monitoring Methods 19BARNEGAT BAY
Barnegat Bay maintains three continuous water quality monitoring stations in the Barnegat Bay-Little Egg
Harbor estuary. The northern two stations have been operating for over 10 years, while the southernmost station
was developed in 2016 specifically as a coastal acidification monitoring station. The BB-LEH estuary system
experiences several local amplifiers for acidification, which makes it ideal for monitoring carbonate chemistry.
There is an upwelling center off Little Egg Inlet, and Little Egg Harbor is also fed by low pH and alkalinity water.
Upper Barnegat Bay, meanwhile, is highly eutrophic. Finally, there are a number of shellfish aquaculture and
restoration projects ongoing throughout the watershed, in addition to the historic hard clam fishery.
The coastal acidification deployment is located on a piling at Morrison’s Marina in Beach Haven, New Jersey.
The deployment is powered by a rechargeable 12-volt battery and solar panel. In the original build, the three
instruments were separated, with the SeaFET deployed vertically in its own tube, and the CO2Pro-CV mounted
horizontally with the Sea-bird pump. After deploying it for some time with that layout and speaking with the
technical staff at Satlantic and Pro-Oceanus, the devices were collocated together in a horizontal layout. The
Seabird pump now pushes the water through the SeaFET and then the CO2Pro-CV. The YSI EXO2 data sonde is
deployed in a vertical tube.
Barnegat Bay instrument array
Pilling with solar panel at Morrison’s Marina,
Beach Haven, NJ
20 Monitoring MethodsTAMPA BAY
Tampa Bay currently has two deployments. The Tampa Bay Ocean Carbon System (OCSv2) is deployed in mid-
water column (2.5 m depth) on an existing University of South Florida (USF) piling (Middle Tampa Bay Physical
Oceanographic Real-Time System (PORTS) station), in collaboration with Dr. Mark Luther, USF. This system is
powered by a solar panel with rechargeable battery. The USF station provides meteorological parameters and is
also located near a National Oceanic and Atmospheric Administration (NOAA)/USF PORTS currents/tide station.
This location provides pre-existing infrastructure for cost savings to the NEP and is within a mixing area of the
bay, which will help determine the net impact of acidification on Tampa Bay.
A new array (OCSv3) was deployed in the Gulf of Mexico, 60 miles offshore from Tampa Bay, on October 25,
2018. The OCSv3 is a surface mount system on the existing USF Coastal Ocean Monitoring and Prediction
System (COMPS) C12 buoy in collaboration with Dr. Robert Weisberg. The acidification sensors were integrated
into the existing buoy using custom brackets and were programmed to measure and telemeter hourly data.
OCSv2 on USF piling, Middle Tampa Bay station OCSv3 buoy, 60 miles offshore, Gulf of Mexico
Monitoring Methods 21MOBILE BAY
The Mobile Bay instruments will be deployed in 2021 at the Middle Bay Lighthouse (30º 26.2 N, 88º 00.7 W) at
a depth of approximately 4 m, which is about 1-m above the bottom. This site has been continuously monitored
for T, S, and DO since 2005 as part of the Alabama Real-time Coastal Observing System (ARCOS), which is
maintained by the Dauphin Island Sea Lab (https://arcos.disl.org). Waves and currents have also been monitored
at this site since 2012. Geographically, the site is in the middle of the Bay and is broadly representative of the
river influenced and highly productive Mobile Bay.
Middle Bay Light Station in the center of Mobile Bay
Alabama’s Real-Time Coastal Observing System
(ARCOS) stations
22 Monitoring MethodsCOASTAL BEND BAYS
The Coastal Bend Bays deployment was located at the research pier of the University of Texas Marine Science
Institute, in the Port Aransas Ship Channel. In 2017, the pier was destroyed by a post Hurricane Harvey accident.
The ship channel (i.e., Aransas Pass tidal inlet), connects estuarine water with water in the northwestern Gulf of
Mexico. The 300-ft pier had a 1200 ft2 lab at its base and a 150 ft2 instrument room on the end (Hu et al., 2018).
The terminus of the pier and instrument room housed a weather station, tide gauge, current meter, and sensors
for water temperature and salinity. Gauges and sensors were all located at approximately 5 m underwater. The
Mission Aransas National Estuarine Research Reserve (MANERR) maintained the salinity and temperature
sensors, and data were being recorded every 15 minutes. The SAMI-CO2 and SeaFET pH sensors were housed
inside a 100-quart cooler, with surface water pumped directly from the ship channel (at approximately 3 ft depth
below the surface) into the cooler housing the sensors. Sensor measurements were made on the hour, after
20 minutes of pumping fresh seawater into the cooler prior to the measurement. The YSI sonde was deployed
directly into the ship channel at 3 ft depth. Coastal Bend Bays hopes that the research pier will be rebuilt, and the
sensors redeployed; however, they are also seeking to deploy at another site in productive waters.
Coastal Bend Bays cooler system housing sensors University of Texas Marine Science Institute Research pier,
Port Aransas Ship Channel
Monitoring Methods 23SANTA MONICA BAY
Santa Monica Bay’s instrument package consists of a Sunburst SAMI-pCO2 and a Sea-Bird SeapHOx in a
custom-built frame. During Year 1, the sensors were suspended at 50 ft below the water surface at an existing
thermistor string mooring located offshore of Palos Verdes Point, where the water depth is approximately 75
ft. This location was chosen to characterize ocean acidification and hypoxia (OAH) in shallower water within
the surface mixed layer, and within a few hundred meters of established kelp beds. The depth and location of
the sensors were expected to minimize effects from point discharges to Santa Monica Bay. During the Year 2
deployment, the same sensor array was relocated on a new mooring further south near the outer edge of the
Palos Verdes shelf, where the water depth is 230 ft. The sensors were deployed at a depth of 197 ft. The location
for the second deployment was chosen to characterize the deeper water and to determine if the signals are
different than those picked up during the deployment in shallower waters, particularly during strong upwelling
events. Because both mooring locations were located near existing Sanitation Districts of Los Angeles County
water quality stations quarterly CTD casts were collected for comparison.
Santa Monica Bay instruments with custom cage Instrument deployment mooring diagram, deployed offshore
of the Palos Verdes Point (Year 1) and the outer edge of the
Palos Verdes shelf (Year 2)
24 Monitoring MethodsYou can also read