Towards Smart City Governance. Case Study: Improving the Interpretation of Quantitative Traffic Measurement Data through Citizen Participation - MDPI

Page created by Philip Reyes
 
CONTINUE READING
Towards Smart City Governance. Case Study: Improving the Interpretation of Quantitative Traffic Measurement Data through Citizen Participation - MDPI
sensors
Article
Towards Smart City Governance. Case Study: Improving the
Interpretation of Quantitative Traffic Measurement Data
through Citizen Participation
David Fonseca * , Monica Sanchez-Sepulveda * , Silvia Necchi                                and Enric Peña

                                           Department of Architecture, Universitat Ramon Llull (URL), La Salle, 08022 Barcelona, Spain;
                                           silvia.necchi@salle.url.edu (S.N.); enric.pc@salle.url.edu (E.P.)
                                           * Correspondence: david.fonseca@salle.url.edu (D.F.); monica.sanchez@salle.url.edu (M.S.-S.);
                                              Tel.: +34-602-092-052 (D.F.)

                                           Abstract: Citizens play a core role in sustainable cities as users of the services delivered by cities and as
                                           active participants in initiatives aimed at making cities more sustainable. This paper considers the role
                                           of citizens as information providers and discusses the conditions under which citizens can participate
                                           in the development of sustainable cities. The objective of this study is to document the sustainability of
                                           an urban transit system and evaluate its compliance, with citizen participation as a major contributor.
                                           The methodology used is intensive field visits, interviews, and a mixed analysis of Sant Andreu de
                                           Palomar District in Barcelona city. The circulating vehicles are quantitatively monitored, qualitative
                                 problems are detected, and the typology of vehicles and other aspects identified and detailed in the
         
                                           study are indicated. All this information is contrasted with that of the technological sensors in the
Citation: Fonseca, D.;
                                           sectors. The results indicate that vehicles in the current pattern of urban density planned under
Sanchez-Sepulveda, M.; Necchi, S.;
                                           incorrect sensor operation influence sustainable behavior through agglomerative clustering. This
Peña, E. Towards Smart City
                                           paper provides recommendations for future urban sustainability assessment research, including
Governance. Case Study: Improving
the Interpretation of Quantitative
                                           the employment of mixed-methods research, among other strategies. This article is intended to
Traffic Measurement Data through           assist policymakers and traffic engineers in evaluating the sustainability of urban transportation
Citizen Participation. Sensors 2021, 21,   infrastructure projects considering citizens as sensors.
5321. https://doi.org/10.3390/
s21165321                                  Keywords: urban sustainability; transport system; traffic sensors; traffic flow; participatory processes;
                                           quantitative and qualitative data; mixed method
Academic Editors: Enrique Alba and
Zakaria Abdelmoiz Dahi

Received: 3 June 2021                      1. Introduction
Accepted: 3 August 2021
                                                 Sustainability in cities is a trend worldwide. As the world urbanizes, achieving
Published: 6 August 2021
                                           sustainability in cities is quickly becoming a global concern [1,2]. Citizen participation
                                           is one of the most used terms in the sustainable city literature, showing that sustainable
Publisher’s Note: MDPI stays neutral
                                           city initiatives need to create a community where citizens can engage more easily and
with regard to jurisdictional claims in
published maps and institutional affil-
                                           effectively, thus developing citizens’ sense of ownership of their city, enhancing the local
iations.
                                           authorities’ awareness of their needs, and ultimately reshaping the citizen–government
                                           relationship [3]. Participation is a central concept in the public policy discourse and more
                                           generally in contemporary culture, and it has become one of the common threads of the
                                           digital age [4].
                                                 Citizen participation plays an important role in urbanism and a variety of mobility-
Copyright: © 2021 by the authors.
                                           related activities, including planning, policymaking, program and service design, and
Licensee MDPI, Basel, Switzerland.
                                           evaluation [5]. The involvement and participation of citizens in the sustainable urban
This article is an open access article
                                           mobility planning process is necessary to satisfy the needs of people and considerations that
distributed under the terms and
conditions of the Creative Commons
                                           technological sensors do not detect. Citizen participation includes the valuing of non-expert
Attribution (CC BY) license (https://
                                           or nonmainstream knowledge brought into the creative problem-solving development of
creativecommons.org/licenses/by/           planning [6].
4.0/).

Sensors 2021, 21, 5321. https://doi.org/10.3390/s21165321                                                     https://www.mdpi.com/journal/sensors
Towards Smart City Governance. Case Study: Improving the Interpretation of Quantitative Traffic Measurement Data through Citizen Participation - MDPI
Sensors 2021, 21, 5321                                                                                             2 of 34

                               Citizen participation is the act of generating new knowledge, adding new perspectives
                         to the planning process, and disseminating knowledge to others in the process [6,7]. Van
                         Herzle [6,8] found that the inclusion of non-expert knowledge was valuable in the planning
                         process in general since the viewpoints of individuals external to the professional circle of
                         urban planning can uncover creative solutions that could work in a specific local context.
                         Corburn [6,9] stresses that local knowledge should never be ignored by planners seeking to
                         improve the lives of communities, especially those facing the greatest risks. We are going
                         through a period of some uncertainty about the urban reality and its evolution, with cities
                         that, in their renewed territorial dimension, concentrate and intensify the problems and
                         opportunities presented by the already evident changes of the time in which we are living.
                         It is necessary to revise the urbanistic theories developed during the past decades that are
                         adapted to the current reality [10].
                               The pacification of a city, understood as the processes that reduce traffic and make the
                         coexistence of all the actors in the city more environmentally sustainable, is a priority for
                         city councils and administrations at a global level. In the case of Barcelona, the aim is to
                         advance towards the pacification of the urban space by focusing on having higher-quality
                         air, more meeting spaces and fewer accidents and noise [11–14]. Decision making for action
                         at any scale (streets, neighborhoods, or entire cities) requires not only detailed studies
                         with sensors and direct observations but also the contextualization of the current society,
                         the types of its interactions and the precise characterization of the particular and global
                         needs of all its stakeholders. However, not all studies that propose feasible changes on a
                         macro-scale are applicable to specific areas, and will depend in many cases on the design
                         of each area [15].
                               Barcelona, as a typically urban case of study, is a useful or appropriate case study from
                         the point of view of scientific approaches on how to make decisions towards a smart city
                         of the future, especially in aspects involving urban mobility [16–23]. Barcelona’s location,
                         limited by the Mediterranean Sea on the east, the mountains (Collserola Hills) on the west,
                         the Besos River on the north, and the Llobregat River on the south, makes it impossible
                         to grow, and amplifies the problem of traffic and urban mobility. Barcelona has a large
                         central core with a grid design [24–26], surrounded by neighborhoods with old-village
                         structures, assimilated by the growth of the city throughout the 20th century (Barceloneta,
                         Sants, Gracia, Sant Andreu, etc.).
                               In this sense, helping traffic measures also make it easier for citizens to opt for public
                         transport and mobility on foot and by bicycle in their daily commutes. In addition to being
                         sustainable, non-invasive, safe, efficient and accessible, greater mobility on foot makes it
                         possible to fight against pollution and reclaim public space, which must once again belong
                         to the neighborhood to improve quality of life. Due to its collective benefits and solidarity
                         with the rest of society, mobility on foot, by public transport and by bicycle, is the mobility
                         of the future [27].
                               Our study examines the nature and effects of participation in the planning of transit-
                         oriented developments that are designed according to technological sensors. The aim is to
                         validate the quantitative data provided by some different sensors through neighborhood
                         visual qualitative samples, which can not only provide specific information that allows for a
                         more sustainable redistribution of traffic, but also offers a low-cost solution for monitoring
                         and characterizing traffic in specific urban areas with very specific mobility typologies.
                               We document inner-city spatial transit mobility and its effects, as well as the significant
                         effect of street networks on traffic performance in a larger area. By considering the role
                         of citizens as sensors and information providers, this article will discuss how citizens
                         can influence the success or failure of smart city initiatives by providing the information
                         necessary for their implementation.
                               Our approach is based on previous work that has shown how the creation of a
                         participatory ecosystem in which citizens interact with public authorities is a key aspect
                         for the design of spaces in a more satisfactory way [28]. This collaborative interaction leads
                         to improved services as it is based on co-design and focuses on the user while identifying
Towards Smart City Governance. Case Study: Improving the Interpretation of Quantitative Traffic Measurement Data through Citizen Participation - MDPI
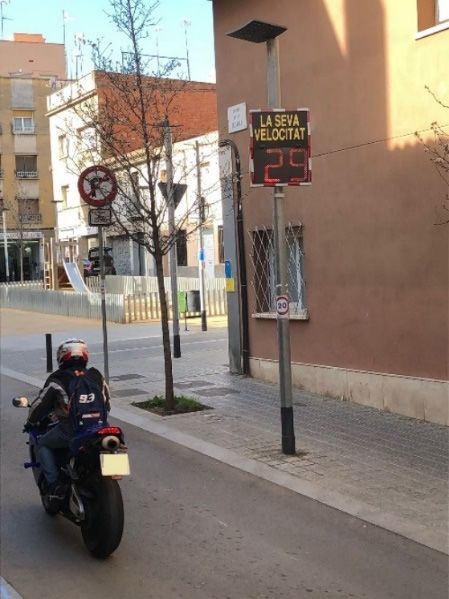
Sensors 2021, 21, 5321                                                                                               3 of 34

                         new governance models. Urban transformation in which citizens are the main “drivers of
                         change” through their empowerment and motivation ensures that major city challenges,
                         including sustainable behavioral transformations, can be addressed. Furthermore, these
                         studies argue that city challenges can be addressed more effectively on a neighborhood
                         scale and provide examples and experiences that demonstrate the feasibility, relevance and
                         impact of such an approach, on which this study is based.
                               The current study is carried out based on the following research questions:
                               RQ1: Is the pedagogical radar installed by the municipality correctly measuring the
                         existing traffic volume?
                               RQ2: Given that an optical/laser or mechanical sensor does not pick up the type of
                         vehicles circulating, what is the current typology of the traffic circulating on the pacified,
                         pedestrian and non-commercial streets at present?
                               RQ3: In case of the restoration of the direction of Gran Street between Joan Torres and
                         Malats, what would be the percentage reduction of commercial traffic in the pedestrian
                         areas of the neighborhood?
                               RQ4: Why qualitative observations can improve quantitative sensor’s data?
                               In the next section, the objective is to identify the role of strategic traffic planning as a
                         sustainable tool for developing an adequate and effective strategic model. In Section 3, the
                         materials and methods used are described for a microscale traffic model of the traffic sensor
                         data collected along the arterial historical center of Sant Andreu de Palomar in Barcelona
                         city. In Section 4, we show and discuss the results of traffic data analysis, and we conclude
                         in Section 5 with observations from our research considering the functions of economic,
                         environmental, and social effects that increase the potential and benefit for a local area.

                         2. Context
                               At present, we can define cities as an entity with a life of its own and multiple agents
                         that interact with this entity for its constant transformation. Undoubtedly, the citizen is the
                         main transforming agent of the city, especially due to the use he/she makes of it and how
                         he/she moves through it.
                               The city as its own entity seeks its own sustainability and in a certain way its adapta-
                         tion to all kinds of intelligent environments that are being implemented, while, on the other
                         hand, its user, the citizen, seeks to improve his quality of life as an intrinsic aspect of the
                         human being. That is, we could identify the need to establish a dialogue between the city
                         and its inhabitants, a need that is established from the relationship between citizens and
                         city administrations and the interaction with all kinds of mechanisms and technological
                         systems of data exchange for decision making.
                               Along with citizen participation, to optimize urban processes and improve citizens’
                         quality of life and the sustainability of the city, urban design requires resources and data to
                         develop innovative, sustainable, and intelligent solutions. The concept of a ‘sensor city’
                         has appeared as an answer to the future challenges of growing urbanization and “datafi-
                         cation” [29,30]. Urban dashboards and platforms incorporating sensors [31], real-time
                         monitoring stations [32], digital cameras [33], real-time tracking systems [34,35], big data
                         analytical techniques [36–38], information and communication technology (ICT) [39,40],
                         smart grids [41,42], and other digital appliances [43] with physical objects that indicate the
                         urban context improve the efficiency of resource usage.
                               These data contain visual, graphical and dynamic analyses able to holistically integrate,
                         view and communicate real-time information on performance, trends, and future urban
                         scenarios [44,45]. Their implementation is meant to facilitate the understanding of urban
                         issues and provide a sense of accountability and engagement in smart urban governance
                         activities.
                               Smart governance is based on principles such as transparency, accountability, collabo-
                         ration (i.e., involvement of all stakeholders) and participation (i.e., citizen participation).
                         Previous studies on the type of governance being implemented in smart cities [46,47]
                         have identified that all initiatives rely heavily on technologies and there is some mix of
Towards Smart City Governance. Case Study: Improving the Interpretation of Quantitative Traffic Measurement Data through Citizen Participation - MDPI
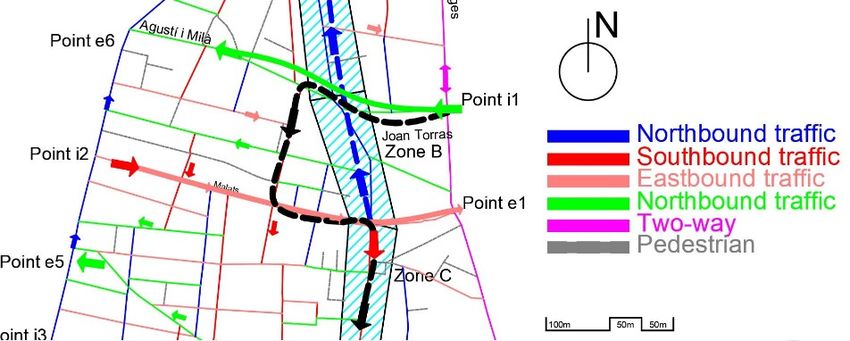
Sensors 2021, 21, 5321                                                                                            4 of 34

                         collaborative, open and participatory governance. In this sense, it is clear to state that
                         advanced technologies, innovation and smart governance are essential requirements for
                         developing smart, creative, innovative and sustainable cities.

                         2.1. Urban Traffic Infrastructure
                               Smart cities have the potential to make complete use of ICT to analyze, sense, and
                         incorporate the principal systems of urban operations. This promotes the creation of a
                         better urban life for citizens by making intelligent responses to factors such as people’s
                         lives, public safety, environmental protection, and urban services [48,49]. The concept of
                         the smart city, derived from the smart earth concept proposed in [49,50], consists of the
                         insertion of sensors in every corner of a city, incorporating pertinent information through
                         cloud computing and supercomputers. Smart cities promise to achieve a deep integration of
                         informatization, industrialization, and urbanization, alleviate urban problems, strengthen
                         urban management, and enhance the quality of urban life. Since the establishment of this
                         concept, scholars have been exploring the theoretical and practical implications of the smart
                         city [49]. Smart cities use advanced ICT to intelligently transform urban infrastructure to
                         interconnect and integrate different parts of urban infrastructure and manage them more
                         effectively [51].
                               Sustainability assessment and sustainability indicators are terms that have gained
                         significant importance [52]. Noncompliance between sustainable development principles
                         and transportation infrastructure is changing the appearance of historic cities from a livable
                         and vibrant atmosphere into car-oriented conditions, causing environmental and social
                         problems. Returning to pacifying the streets of a historical center when car culture has
                         already been incorporated can bring difficulty in establishing a balance.
                               Efficient methods and tools for road network planning and traffic management are
                         critically important in the increasingly urbanized world [53]. The balance between the
                         redistribution of traffic and internal mobility that is currently produced is necessary to
                         achieve a sustainable urban development model. The growth of transport, which prioritizes
                         cars, is associated with damaging effects on our environment, atmosphere and quality of life.
                         To maintain the standard of transit that is required for society and the economy to function
                         efficiently and not place pressure on the environment, it is necessary for governments to
                         devise a policy that will take these factors into account. In this context, previous studies and
                         research have identified different perspectives on motivating decision makers to balance
                         citizens, industry and administration goals and wishes [54,55].
                               The main scientific approaches so far have focused on monitoring and counting
                         traffic volume to obtain relationships between density and effects such as air and noise
                         pollution. For this purpose, and with the objective of working as predictive systems of
                         mobility and its associated variables (such as speed, vehicle flow or accident prevention),
                         we can find proposals that make use of algorithms based on vehicle identification, deep
                         learning algorithms, hybrid models or the combination of multiple data sources, such
                         as loop detectors, travel time readings, and GPS location samples [56–61]. However, all
                         these approaches have been used in macroscopic approximations of traffic (wide areas,
                         intersections of large streets, highways, etc.), making an approximation by the typology
                         of neighborhood, streets and traffic not approachable in our study as we have previously
                         justified.
                               Focusing on the identification of the type of vehicle, a fundamental aspect in the
                         motivation of our proposal, we found proposals that use magnetic sensor networks to
                         measure traffic, occupancy, speed, as well as the type of vehicle [62]. Based on samples
                         of 2 h measurements, it has been possible to identify more than 99% of vehicles, with a
                         positive identification of the type of vehicles of about 60%, and with the potential to reach
                         between 80 and 90% if algorithms based on the calculation of the wheelbase of the vehicles
                         are applied. One of the limitations of this type of approach is that it is based on stable
                         measurement points for both light conditions and measurement spaces, conditions that, in
                         neighborhoods with narrow streets and high light variation depending on solar movement,
Towards Smart City Governance. Case Study: Improving the Interpretation of Quantitative Traffic Measurement Data through Citizen Participation - MDPI
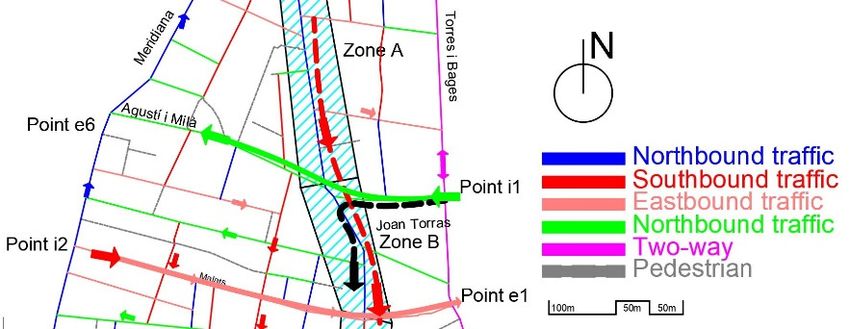
Sensors 2021, 21, 5321                                                                                                  5 of 34

                         are not applicable, in addition to the costs of implementation and configuration as other
                         aspects that limit their use.

                         2.2. Citizens’ Participation in Urban Decision Making
                               People play a central role in cities as the direct or indirect beneficiaries of city activities.
                         In addition to the view of citizens as passive recipients of the services delivered to them by
                         the city, there is a different view when citizens assume an active role in the achievement of
                         sustainable city objectives. The interests and concerns of citizens are coming to the forefront
                         with the consciousness that a livable city not only consists of good infrastructure but also
                         citizen input and feedback. The city as an objective reality and as a represented image
                         plays an important role in the organization of space. However, the urban phenomenon that
                         completes the urban structure is its representation as a social product, the result of human
                         action [63].
                               Every human is able to act as an intelligent sensor equipped with a simple smartphone,
                         a GPS (Geographic Positioning System)-based system, or even other means necessary to
                         make measurements of environmental variables [64]. These voluntary data collection
                         contributions have been standardized at all levels, especially those linked to GIS (Geo-
                         graphic Information Systems) applications, with data collection and mapping of all types
                         of services, geographic features, sounds, pollution, valuations and even traffic-related
                         aspects [65–68]. These approaches can enhance current e-government practices by enabling
                         citizens to actively participate in urban decision making and service delivery, justifying the
                         term “Citizen Science” which is often used to describe communities or networks of citizens
                         who act as observers in certain domains of science [69].
                               Since sensor networks have not grown as fast as expected, and in addition to having a
                         cost in which not all administrations are willing to invest, it is easy to find errors in their
                         configuration and placement, making it necessary to find new alternative data sources. In
                         the subjective field, we find studies assessing the capability of humans acting as a sensors,
                         based on data collected from a wide range of social networks, the cell phone network or
                         microblogs, to complement geo-sensor networks [70]. Current literature in the field of
                         user-centric sensing often mixes different approaches on how data are generated, used
                         and analyzed [71]. These measurements can be either subjective sensations, perceptions or
                         personal observations, which identify the following terms:
                         •    People as Sensors defines a measurement model, in which measurements are not
                              only taken by calibrated hardware sensors, but in which also humans can contribute
                              with their subjective “measurements”, such as their individual sensations, current
                              perceptions or personal observations [71]. Measurements are not created in an ab-
                              solute, reproducible way by calibrated sensors, but through personal and subjective
                              observations. Such observations could be air quality impressions, street damages,
                              traffic flow, weather observations, or statements on public safety.
                         •    Collective Sensing does not exploit the measurements and data of a single person, but
                              analyzes aggregated and anonymized data from collective sources, such as Twitter,
                              Flickr, Instagram or the mobile phone network. This is a term related to People as
                              Sensors, and we can find it as Participatory Sensing. Both terms, Participatory Sensing
                              and People as Sensors, are very similar, but in this case, their definition is a little more
                              restricted in terms of input devices, data acquisition and information processing [72].
                         •    Citizen Science represents a human-based approach to science, in which citizens bring
                              semi-expert knowledge and observations to specific research topics.
                               Previous works have studied how citizen networks have been initiated in the Nether-
                         lands, where official government control and business organizations leave gaps. The
                         citizen-sensor networks formed collect information on issues that affect the local com-
                         munity in their quality of life, such as noise pollution and earthquakes induced by gas
                         extraction [71]. These studies deal with monitoring systems that are established bottom-up,
                         by citizens for citizens, to serve as “information power” in dialogue with government
                         institutions. We find that these networks gain strength by joining efforts and activities in
Towards Smart City Governance. Case Study: Improving the Interpretation of Quantitative Traffic Measurement Data through Citizen Participation - MDPI
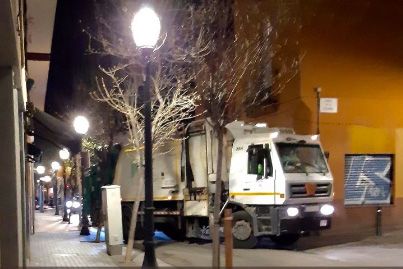
Sensors 2021, 21, 5321                                                                                              6 of 34

                         crowdsourcing data, providing objectified data or evidence of the situation on the ground
                         on an issue of interest to the entire local community. By satisfying a local community need
                         for information, a process of “collective sense-making” can grow combined with citizen
                         empowerment, influencing social discourse and challenging the truth claims prevalent in
                         public institutions.
                               Berntzen and Johannessen [73] introduced the term “citizens as sensors” as part of
                         a discussion of the role of citizens in a smart city. Gil, Cortés-Cediel and Cantador [74]
                         also discussed different forms of citizen participation in smart cities, with examples where
                         citizens gather data to inform their government. Citizens as sensors encourage public
                         participation in collective action, including taking inventories, making observations, and
                         obtaining measurements that describe the urban environment [75]. Citizens can act as
                         sensors by using their perceptions to detect and report problems [76]. Villatoro and Nin [77]
                         refer to the citizen-sensor network as an interconnected network of people who actively
                         observe, collect, analyze, report and disseminate information via different media such as
                         text, audio, or video [78]. Citizens can participate in the development of smart cities and, as
                         participants, can be (at least implicitly) considered responsible for this objective [4,79,80].
                               We consider citizens to play the role of qualitative sensors and information providers,
                         following previous studies that have addressed this approach. For example, in [62], the
                         authors present an urban traffic monitoring system based on participatory sensing, leaving
                         the traffic detection tasks to the cell phones of bus users. Other approaches describe
                         how citizens can serve as human sensors in providing supplementary, alternate, and
                         complementary sources of information for smart cities, by collecting, communicating and
                         sharing data with the corresponding administrations, through interviews, questionnaires,
                         or simply using geo-tagged tweets [81,82].
                               In this sense, we can talk about the concept of Smart Communities with the idea of
                         not just involving citizens in city governance, but rather to make them participate in the
                         co-production of public services, and to help plan more effective engagement strategies for
                         citizens, building users and stakeholders [83,84].
                               On the one hand, by having control over their user-generated data, citizens can
                         contribute to public and nonpublic sectors to lead initiatives that can deliver public value.
                         The example considered in this paper shows how looking at citizen participation in smart
                         city initiatives through the lens of coproduction can allow cities to exploit the citizens’ active
                         contributions to become smarter and can allow the public sector to be more productive
                         and effective in creating public goods. However, this confronts the public sector with a
                         serious challenge, forcing it to undergo a deep transformation to fully embrace the reality
                         of participation and not only the rhetoric of participation.

                         2.3. Choosing an Approach: Qualitative Samples
                              In general, quantitative methods aim to provide summaries of data that help to
                         validate generalizations about the studied phenomenon. To this end, they usually work
                         with a small number of variables, automatic or semi-automatic collection, and rely on
                         validation procedures to ensure the reliability of the results, which often requires statistical
                         analysis. Quantitative results are limited because they provide numerical descriptions
                         rather than details about the perceptions or motivations of the sample.
                              Qualitative studies, on the other hand, begin with the broad goal of better understand-
                         ing the human perspectives of the sample and end with a detailed description of a specific
                         event or phenomenon of the experiment being evaluated. Their results are more difficult
                         to compare, since their essence is precisely to obtain singularities in the responses. Thus,
                         qualitative approaches make it possible to identify the main positive characteristics to be
                         enhanced or the main weaknesses to be resolved in the sample studied.
                              In the case of qualitative samples, the main criticisms are based on their “system-
                         atization”, or on the presumed lack of rigor derived from working with small samples,
                         which is usually the result of a misinterpretation of the objectives of the study and/or
                         of the responses obtained [85,86]. However, both quantitative and qualitative methods
Towards Smart City Governance. Case Study: Improving the Interpretation of Quantitative Traffic Measurement Data through Citizen Participation - MDPI
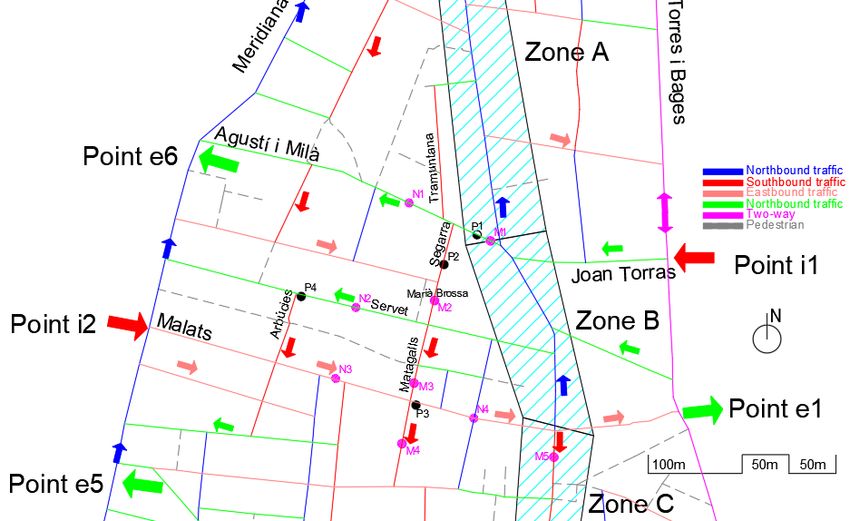
Sensors 2021, 21, 5321                                                                                                  7 of 34

                         yield scientifically valid results. Their use and validity have been studied and compared in
                         previous works and no significant differences in their scientific citation as valid supporting
                         references are apparent [87].
                               For each qualitative method, Patton defines up to 10 types of characteristics with their
                         function and the quantitative equivalent [85,88]. In ethnographic studies, the collection
                         of observations, interviews and/or focus group work and organized documentary work
                         are considered essential. These methods are particularly interesting and demonstrate their
                         credibility [89], not only with small samples that can generate deviations in quantitative
                         approaches, but also when, due to the typology of the users, it is necessary to obtain more
                         personal information [90].
                               People play a central role in cities as the direct or indirect beneficiaries of city activities.
                         In addition to the view of citizens as passive recipients of the services delivered to them by
                         the city, there is a different view when citizens assume an active role in the achievement of
                         sustainable city objectives.
                               Observations from the affected population can be an important source of informa-
                         tion due to their motivation. The volunteers in the study areas allow for an exhaustive
                         collection of scientifically valuable data that provide explanatory insight to mechani-
                         cally/automatically collected data. Data acquisition has always been a very expensive
                         part of geospatial projects, and one of the areas where citizens can help. In this regard
                         Goodchild (2007) coined the term Volunteered Geographic Information (VGI) [69], which
                         conceptualizes the use of human power, knowledge, expertise and ubiquity in general
                         in spatial data acquisition. VGI refers to “a series of geo-collaborative projects in which
                         individuals voluntarily collect, maintain, and visualize information” [91].
                               VGI is also an implicit source of expertise of its users: the exploitation of information
                         collected by a group of expert users in a specific spatial action can provide better solutions
                         to other users, enabling them to perform that same action in the way an expert would [92].
                         If the effort to obtain these data goes from being a simple informative action to a service to
                         support future actions, we find ourselves with the so-called voluntary geographic services
                         (VGS), which use voluntary geographic information to aggregate, correlate and present
                         information in a useful way for specific services [93].
                               Citizen involvement in social changes is often valuable in its own right because it
                         makes the development of solutions to societal problems more transparent to the people
                         affected by them. There are also other common reasons for citizen engagement: citizens
                         bring local knowledge about the problem and their needs; they can generate new solutions
                         informed by their knowledge; and they bring different points of view, leading to more
                         diverse perspectives on the problem. When involved in the process, citizens are also more
                         likely to accept the solutions [93].

                         3. Materials and Methods
                               Active design feedback from citizens is a fundamental component in making a respon-
                         sive city. Therefore, we argue that implementing sensor networks is a necessary but not
                         sufficient approach for improving urban living [94].
                               This research focuses on citizens as an active member to collect qualitative data for
                         urban decisions. The active position of the citizen helps in collecting data about their
                         surroundings; they observe and report [76]. Information obtained from citizens as passive
                         entities helps in understanding and optimizing smart city functions, and citizens as active
                         entities motivated by their common sense communicate the sensed samples.
                               The present study is developed in the area of Sant Andreu del Palomar, which is the
                         oldest part of the Sant Andreu district in Barcelona (see Figure 1). This district remains
                         compact, with more than 57,961 inhabitants [95]. Although the extension of the district is
                         larger, the nucleus or old town is small, with narrow streets, private homes, and some basic
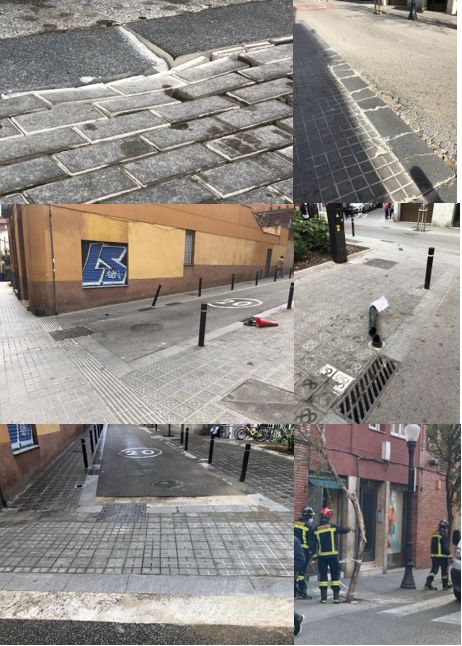
                         commercial sites.
notable increase in traffic on the surrounding streets. This increase is critical, since these
              streets are mostly single-platform streets previously pacified, narrower than the main
              street, with no commercial uses and mostly used mainly for housing and private homes.
              As a result of this situation, the neighborhood platform FemCrida (@Transitstandreu) was 8 of 34
Sensors 2021, 21, 5321
              formed in 2019, which conveyed to the Barcelona City Council the need to institute a dis-
              tribution of traffic that truly pacifies the streets of the neighborhood equally.

         Figure 1. Location of Sant1.Andreu
                            Figure    Locationdel  Palomar
                                               of Sant      indel
                                                       Andreu  Barcelona  City.
                                                                  Palomar in Barcelona City.

                                  The problem
              This district remains      compact,  of the studied
                                                       with    morecase   starts
                                                                       than       with inhabitants
                                                                               57,961   the pacification    andAlthough
                                                                                                        [95].    change of the
                                                                                                                             thetraffic
                            direction of the Gran de Sant Andreu Street (as we can see in detail in the Method section).
         extension of the district is larger, the nucleus or old town is small, with narrow streets,
                            With the current change in the direction of traffic on the main street, there has been a notable
         private homes, and      someinbasic
                            increase      trafficcommercial        sites. The
                                                   on the surrounding             problem
                                                                            streets.           of theisstudied
                                                                                      This increase                 case these
                                                                                                         critical, since  startsstreets
         with the pacification    and change
                            are mostly              of the traffic
                                         single-platform     streets direction
                                                                      previouslyof    the Gran
                                                                                    pacified,      de Sant
                                                                                              narrower    thanAndreu
                                                                                                                the mainStreet
                                                                                                                           street, with
         (as we can see in nodetail   in the Method
                                commercial      uses and section).
                                                           mostly used mainly for housing and private homes. As a result
                            of thischange
              With the current       situation,inthe
                                                   theneighborhood
                                                        direction ofplatform
                                                                         traffic onFemCrida
                                                                                       the main (@Transitstandreu)
                                                                                                    street, there has  wasbeen
                                                                                                                            formed in
         a notable increase in traffic on the surrounding streets. This increase is critical, since these of
                            2019,  which   conveyed     to the  Barcelona    City  Council  the  need  to  institute a distribution
                            traffic that truly pacifies the streets of the neighborhood equally.
         streets are mostly single-platform            streets previously pacified, narrower than the main
                                  This district remains compact, with more than 57,961 inhabitants [95]. Although the
         street, with no commercial
                            extension of the districtmostly
                                           uses    and            used
                                                           is larger, the mainly
                                                                           nucleus or forold
                                                                                          housing
                                                                                              town isand
                                                                                                       small,private   homes.streets,
                                                                                                                with narrow
         As a result of thisprivate
                             situation,    theand
                                      homes,     neighborhood        platform FemCrida
                                                     some basic commercial                       (@Transitstandreu)
                                                                                   sites. The problem     of the studied wascase starts
         formed in 2019, which conveyed to the Barcelona City Council the need to institute a dis- Street
                            with  the  pacification   and   change  of  the  traffic direction  of the Gran   de  Sant Andreu
                            (asthat
         tribution of traffic   we can   seepacifies
                                     truly   in detail the
                                                         in the  Method
                                                              streets   of section).
                                                                           the neighborhood equally.
                                  With the current change in the direction of traffic on the main street, there has been a
              Sant Andreu del Palomar is experiencing a new episode in the debate on road traffic
                            notable increase in traffic on the surrounding streets. This increase is critical, since these
         on Gran Street, the     neighborhood’s historic artery and commercial epicenter. This main
                            streets are mostly single-platform streets previously pacified, narrower than the main street,
         axis of the town with
                             has nochanged
                                       commercialits traffic
                                                       uses anddirection,
                                                                  mostly used nowmainly
                                                                                     takingforcars,  delivery
                                                                                                 housing           truckshomes.
                                                                                                            and private     and As
                               a result of this situation, the neighborhood platform FemCrida (@Transitstandreu) was
                               formed in 2019, which conveyed to the Barcelona City Council the need to institute a
                               distribution of traffic that truly pacifies the streets of the neighborhood equally.
                                    Sant Andreu del Palomar is experiencing a new episode in the debate on road traffic
                               on Gran Street, the neighborhood’s historic artery and commercial epicenter. This main
                               axis of the town has changed its traffic direction, now taking cars, delivery trucks and buses
                               that circulate in the surrounding lanes in the direction of the city center, which creates
                               inconvenience in part of the neighborhood. In the past, the town of Sant Andreu was
Sensors 2021, 21, 5321                                                                                             9 of 34

                         characterized by being a small town where proximity was the pattern that governed daily
                         life. One could walk to the main points of the city, such as the town hall, church, artisans,
                         shops, services, fields and other places of work [96].
                               This means that work, recreation, meals, discussions and social contacts were inter-
                         laced. Once the town started to grow, so did its infrastructure. We note that the historic
                         centers that have managed to preserve their old and renovated commercial infrastructure,
                         as is the case in Sant Andreu, are important driving forces of urban life. The question is how
                         to reduce traffic on this street without completely blocking it, since there are many private
                         garages in the area and stores need to carry out loading and unloading tasks every day.
                               The present study is based on the data provided by the Barcelona City Council
                         collected by the pedagogical radar installed to justify the change of directions in the streets
                         of the Sant Andreu neighborhood. Because the data supplied to the neighbors did not
                         correspond to their perception, a qualitative sample collection was designed under the
                         following premises:
                         •    Given the limited technical, temporal and economic possibilities of the platform, we
                              opted for a qualitative approach (averaged individual samples). Given that different
                              types of vehicles (taking into account business hours) can be found in terms of sample
                              collection schedules, this is a stratified sample within the typology of mixed studies
                              defined in [97].
                         •    These samples were designed to capture 10 m periods of traffic in order to complete
                              2 h cycles throughout different daily slots, both on weekdays and weekends. The
                              objective of this process was to start from a common basis of comparison between the
                              different measurement points with a significant sample, following the example of [62].
                         •    There are different approaches that can guide the design of sampling strategies for
                              open space or environmental monitoring, based on the use of different numbers of
                              individual or pooled samples. Previous work [98], shows that these are appropriate
                              depending on cost and sample variance. However, when analyzing new sites, the
                              recommended approach is to initially use individual samples in time series, which
                              allows for better refinement and detection of sample variance.
                         •    Four measurement points, one at the entrance to the conflict zone (P1), another after
                              the first possible detour (P2), the third at one of the most complicated streets and turns
                              technically prohibited for commercial vehicles and which is also an exit point of this
                              new route (P3) and finally one at the exit of the study area (P4).
                               Although the initial objective was to monitor and compare the diversity of traffic
                         throughout the day at the measurement points, thanks to the data provided by the Barcelona
                         City Council, the study goes to a higher level, positioning itself as a complementary tool to
                         the mechanical quantitative approaches carried out by the City Council. As we will see
                         later, a data sharing process has been initiated between the City Council and the platform
                         that exemplifies how citizen collaboration and participation (smart governance) improves
                         smart cities and the technological processes applied to its monitoring.

                         3.1. Location, Motivation and Project Description: The Problem
                              The main nucleus of the old town can be defined by the limits that form Palomar
                         Street in the north; in the east, the axis is formed by the Streets of Torres i Bages and Segre,
                         in the south by the Ramblas de Once de Setembre and Fabra i Puig, and in the west by
                         Meridiana Avenue, as seen in Figure 2. This forms an area of approximately 826,983 m2
                         and a perimeter of 4170 m.
Sensors
1, x FOR PEER     2021, 21, 5321
               REVIEW                                                                                                    10 of 35     10 of 34

                        Figure 2. Historic center
                                         Figure 2. of the Sant
                                                   Historic    Andreu
                                                            center of the del
                                                                          SantPalomar neighborhood.
                                                                               Andreu del Palomar neighborhood.

                             The pacification ofThethepacification
                                                        main streetof the main street
                                                                       (shaded          (shaded and
                                                                                  and identified    byidentified
                                                                                                        areas A, by
                                                                                                                  B, areas
                                                                                                                     C, andA,DB, in
                                                                                                                                  C, and D in
                        Figure 2; also known as Gran Street) and the change of direction in the cycle (now the N (now the
                                           Figure  2; also  known   as  Gran  Street) and  the  change   of direction in the cycle
                                           N direction) from Malats Street to Palomar Street (historically, it was completely in the S
                        direction) from Malats Street to Palomar Street (historically, it was completely in the S
                                           direction, like the rest of the street) constitute the starting point of the problem that affects
                        direction, like theother
                                            rest of the street)
                                                 streets. The newconstitute
                                                                     directionthe  starting
                                                                               of traffic by point  ofshown
                                                                                             street is the problem    that
                                                                                                              in Figure 3. affects
                        other streets. The new direction of traffic by street is shown in Figure 3.
Sensors 2021, 21, 5321                                                                                                 11 of 34
   Sensors 2021, 21, x FOR PEER REVIEW                                                                              11 of 35

                              Figure 3. Direction of the traffic by street after the pacification of Gran Street.
                             Figure 3. Direction of the traffic by street after the pacification of Gran Street.
FOR PEER REVIEW                                                                                                                     12 of 35

       Sensors 2021, 21, 5321                                                                                                                   12 of 34

                        Thechange
                      The     changein  indirection
                                            directiondescribed
                                                          describednotably
                                                                        notablyaffected
                                                                                     affectedthe   theinternal
                                                                                                        internaltraffic
                                                                                                                     trafficofofthe
                                                                                                                                  theneigh-
                                                                                                                                       neigh-
                  borhood,since
                 borhood,      sincethe
                                      thevast
                                           vastmajority
                                                   majorityof  ofvehicles
                                                                   vehiclesthat thatcomecomefrom fromnorthern
                                                                                                          northernBarcelona
                                                                                                                        Barcelona andits      its
                                               The change in    direction described       notably affected      the internal trafficand
                                                                                                                                      of the neighbor-
                  ringroads
                 ring  roadspasspassthrough
                                      through     InputPoint
                                         hood, Input
                                                 since the
                                                           Point  1(i1),
                                                                    (i1),which
                                                             vast1majority
                                                                          which    isisadjacent
                                                                             of vehicles
                                                                                        adjacent      toSant
                                                                                                     to
                                                                                              that come
                                                                                                          Sant
                                                                                                           from
                                                                                                                 Andreu
                                                                                                               Andreu
                                                                                                                  northern
                                                                                                                            ofBarcelona
                                                                                                                           of  thePalomar
                                                                                                                              the    Palomar
                                                                                                                                           and its ring
                  neighborhood.       The   other
                                         roads      main
                                                 pass        entry
                                                       through       points
                                                                  Input  Point to1 the
                                                                                    (i1), neighborhood
                                                                                           which    is adjacent
                 neighborhood. The other main entry points to the neighborhood are identified as i2, i3,         are
                                                                                                                  to  identified
                                                                                                                      Sant  Andreu   as
                                                                                                                                      ofi2,
                                                                                                                                          the i3,
                                                                                                                                                Palomar
                  and  i4 (access   from   the   city  center)   as  well  as  i5  and     i6  (east   access,   from
                 and i4 (access from the city center) as well as i5 and i6 (east access, from the coastal area). i3, and
                                         neighborhood.      The  other main   entry    points   to the  neighborhood     the
                                                                                                                          are coastal
                                                                                                                              identifiedarea).
                                                                                                                                           as i2,
                        Initially,the    i4 (access from the
                                   theconfiguration
                                         configuration          city
                                                             ofthe   center)
                                                                thestreets    as
                                                                     streets(as  well
                                                                               (as   weas    i5 and
                                                                                           can   seei6 in(east  access,
                                                                                                           Figure       from
                                                                                                                     4),made
                                                                                                                         made  theitcoastal
                                                                                                                                     possiblearea).
                      Initially,                            of
                                               Initially, the configuration
                                                                                   we     can   see
                                                                              of the streets (aszones
                                                                                                      in  Figure
                                                                                                      we canB-C-D,
                                                                                                                    4),
                                                                                                               see in Figure
                                                                                                                                 it possible
                                                                                                                               4), made from
                                                                                                                                          it possible to
                  toreach
                 to  reachthethemost
                                  mostcommercial
                                          commercial        area  ofthe
                                                                      theneighborhood,
                                                                           neighborhood,                                byentering
                                                                                                                             entering
                                         reach the mostarea      of
                                                            commercial    area of the neighborhood,zones B-C-D,        by
                                                                                                             zones B-C-D,               from
                                                                                                                              by entering    from zone
                  zoneAA(red
                 zone      (reddashed
                                  dashedline lineofofFigure
                                                       Figure4),4),and
                                                                     anddriving
                                                                           drivingsouth,south,or   orbybyentering
                                                                                                           enteringfrom frompoint
                                                                                                                                point 1 and
                                         A (red dashed     line of Figure  4), and driving south,        or by entering    from point11and and turning
                  turningonto
                 turning    ontozone
                                  zoneB   B(black
                                         onto(black   dashed
                                               zonedashed
                                                      B          lineof
                                                        (black line
                                                                dashed ofFigure
                                                                          Figure
                                                                         line         4). 4).
                                                                                    4).
                                                                               of Figure

                  Figure 4. Initial street configuration before the pacification.
                 Figure 4. Initial street configuration     before
                                            Figure 4. Initial        the pacification.
                                                              street configuration before the pacification.

                      Thenew
                     The  newconfiguration
                               configuration
                                        The new ofconfiguration
                                               of  GranStreet,
                                                  Gran   Street,ofafter
                                                                   after
                                                                    Granthe  pacification
                                                                         Street,
                                                                        the                  bythe
                                                                                                 theCity
                                                                                                      City
                                                                                 after the pacification
                                                                            pacification    by             Council,
                                                                                                        by the
                                                                                                          Council,   isis
                                                                                                               City Council, is
                  shownin
                        inFigure    shown
                           Figure5.5.     in Figure 5.
                 shown

                  Figure  5. Street
                    5. Street       configuration
                              configuration after theafter the pacification,
                                                       pacification,          where incan
                                                                     where in black     black we route
                                                                                                  can see  the route   tocenter
                                                                                                                          arriveofatthe
             Figure
                 Figure  5. Street configuration    after the pacification,  wherewe      see the
                                                                                    in black we can  seetothe
                                                                                                           arrive at the
                                                                                                               route  to arrive at
                  the center
             neighborhood.    of the neighborhood     .
                 the center of the neighborhood.
                                                 As seen from Figure 5, vehicles that enter through i1 (Joan Torras Street) to reach the
                        Asseen
                       As   seenfrom
                                  fromFigure
                                          Figure 5,vehicles
                                                       vehiclesthat
                                                                  thatenter
                                                                        enterthrough
                                                                                 throughi1i1(Joan
                                                                                                (JoanTorras
                                                                                                        TorrasStreet)
                                                                                                                  Street)totoreach
                                                                                                                              reachthethe
                                         center of5,the   neighborhood    (zones B, C and       D), which    has the highest   commercial and
                  center   of the  neighborhood
                 center of the neighborhood             (zones
                                                       (zones B,
                                         residential density,     B, C  and
                                                                     C and
                                                                 cannot        D),
                                                                         turnD),     which
                                                                                    which
                                                                                along         has
                                                                                        Granhas     the   highest
                                                                                                   the(zone
                                                                                               Street   highest      commercial
                                                                                                                    commercial
                                                                                                               B, with a length ofandand
                                                                                                                                     190 m) and
                  residential   density,
                 residential density,must   cannot    turn
                                               travelturn
                                           cannot      throughalong   Gran
                                                                 pedestrian
                                                             along            Street   (zone
                                                                              streets (zone
                                                                     Gran Street                B,  with
                                                                                       and previously      a  length
                                                                                               B, with pacified
                                                                                                          a length     of
                                                                                                                   areas,   190 m)
                                                                                                                           suchm)
                                                                                                                      of 190         and i Milà,
                                                                                                                                as Agustí
                                                                                                                                    and
                  must travel
                 must    travel through
                                 through      pedestrian
                                         Segarra,             streets
                                                   Marià Brossa,
                                             pedestrian      streets   and previously
                                                                    Matagalls,
                                                                      and     previously
                                                                                  and Malats,pacified
                                                                                                and then areas,
                                                                                              pacified     turn onto
                                                                                                          areas,    such
                                                                                                                   suchGranasStreet
                                                                                                                               Agustí
                                                                                                                           as Agustí     ii
                                                                                                                                    (to complete
                  Milà,  Segarra,   Mariàa path  of approximately
                                              Brossa,     Matagalls,   500
                                                                        and m Malats,
                                                                                and rejoin   thethen
                                                                                           and    targetturn
                                                                                                          route;  see the
                                                                                                               onto   Gran dashed
                                                                                                                              Streetblack
                                                                                                                                       (to  line in
                 Milà, Segarra, Marià        Brossa,
                                         Figure  5). In
                                                        Matagalls,
                                                        addition,
                                                                       and
                                                                   there is a
                                                                             Malats,
                                                                              growing
                                                                                          and
                                                                                          volume
                                                                                                then
                                                                                                   of
                                                                                                       turn onto
                                                                                                      vehicles  that
                                                                                                                     Gran
                                                                                                                     use  the
                                                                                                                             Street
                                                                                                                              bypass
                                                                                                                                      (to
                                                                                                                                       by  Servet  i
                  completeaapath
                 complete       pathof ofapproximately
                                           approximately500     500m mand
                                                                        andrejoin
                                                                               rejointhethetarget
                                                                                             targetroute;
                                                                                                      route;seeseethe
                                                                                                                    thedashed
                                                                                                                         dashedblack
                                                                                                                                   black
                  linein
                 line  inFigure
                          Figure5).5).In
                                       Inaddition,
                                           addition,therethereisisaagrowing
                                                                     growingvolume volumeof  ofvehicles
                                                                                                 vehiclesthatthatuse
                                                                                                                   usethe
                                                                                                                        thebypass
                                                                                                                             bypassby   by
                  Servet  i Arbúcies    to  access   the   central  area  of  the   neighborhood,        all
                 Servet i Arbúcies to access the central area of the neighborhood, all the roads of which arethe  roads   of  which    are
                  narrowstreets,
                 narrow     streets,with
                                     withclosed
                                             closedand andpreviously
                                                             previouslypacified
                                                                            pacifiedturns.
                                                                                         turns.On Onthetheother
                                                                                                            otherhand,
                                                                                                                    hand,partpartof
                                                                                                                                  ofthe
                                                                                                                                      the
                  traffic that could previously access the neighborhood by driving south along Gran Street
Sensors 2021, 21, 5321                                                                                                         13 of 34
FOR PEER REVIEW                                                                                                           13 of 35

                                        Arbúcies to access the central area of the neighborhood, all the roads of which are narrow
                 (dashed red line instreets,
                                       Figure    4), closed
                                               with  now has  andto   go around
                                                                    previously       the neighborhood
                                                                                  pacified                  andhand,
                                                                                           turns. On the other    enterpart
                                                                                                                        through
                                                                                                                             of the traffic
                                     that  could  previously    access  the neighborhood     by driving
                 point i1, which concentrates all the entrances from the east of the neighborhood.      south  along Gran  Street (dashed
                                     red  line in Figure   4), now   has  to go  around   the neighborhood   and
                       The motivation for the study starts with the notable increase in traffic that is gener-    enter through   point  i1,
                                     which concentrates all the entrances from the east of the neighborhood.
                 ated at Input Points i1 and i2 to move towards the center of the neighborhood (private
                                           The motivation for the study starts with the notable increase in traffic that is generated
                 vehicles) and access   commercial
                                     at Input  Points i1areas
                                                           and i2(A-B-C-D,       for commercial
                                                                   to move towards     the center ofvehicles).   This volume
                                                                                                     the neighborhood   (privateofvehicles)
                 traffic has generated   an   increase    in pollution,      noise  and   vibrations   on  the
                                     and access commercial areas (A-B-C-D, for commercial vehicles). This volumeaffected  streets,
                                                                                                                             of traffic has
                 breaking urban furniture,
                                     generatedpavement,
                                                  an increase and      trees and
                                                                 in pollution,      even
                                                                                 noise  andcausing   accidents.
                                                                                            vibrations  on the affected streets, breaking
                                     urban   furniture,   pavement,    and   trees and  even  causing accidents.
                       In Figure 6, we can observe the main points measured, taking into account the new
                                           In Figurein
                 routes of the traffic identified      6, Figure
                                                          we can observe
                                                                    5:        the main points measured, taking into account the new
                                        routes of the traffic identified in Figure 5:
                 •       P1–4: Qualitative
                                        •
                                             points of observation.
                                            P1–4: Qualitative points of observation.
                 •       P2: Initial location
                                        •     ofInitial
                                            P2:  a pedagogical
                                                        location of radar  (quantitative
                                                                    a pedagogical          data).
                                                                                   radar (quantitative data).
                 •       M1–5: Quantitative
                                        •      data   recollected    by mechanical    sensors.
                                            M1–5: Quantitative data recollected by mechanical sensors.
                 •                      •
                         N1–4: Non-measured N1–4:critical   points. critical points.
                                                   Non-measured

                 Figure 6. Area of study, with the locations of the four measurement points.
                                    Figure 6. Area of study, with the locations of the four measurement points.

                 3.2. Initial Data: Optical Sensor
                                     3.2. Initial    of Optical
                                                  Data: Pedagogical
                                                                SensorRadar
                                                                      of Pedagogical Radar
                      In the first instance,    andfirst
                                           In the     after more than
                                                         instance,      a year
                                                                   and after  moreof than
                                                                                      complaints
                                                                                           a year ofand  neighborhood
                                                                                                     complaints            ac-
                                                                                                                 and neighborhood
                                     actions,  the Barcelona  City Council  installed  informational radar on
                 tions, the Barcelona City Council installed informational radar on Segarra Street (a single- Segarra Street (a single-
                 level street with pylons and a maximum speed of 20 km/h; characteristics of the sensor:sensor:
                                     level  street with  pylons and  a maximum     speed   of 20 km/h; characteristics of the
                                     https://www.radarespedagogicos.com/mini-sp, accessed on: 14 March 2021), finding that
                 https://www.radarespedagogicos.com/mini-sp                , Accessed: 14 March 2021), finding that
                                     the flow of vehicles was approximately 400 a day, which was considered low traffic (see
                 the flow of vehicles   was7).
                                     Figure    approximately 400 a day, which was considered low traffic (see
                 Figure 7).
Sensors Sensors
        2021, 21,
                2021,x21,
                       FOR5321PEER REVIEW                                                                                        14 of 34

                                       Figure
                                      Figure     7. Informational
                                             7. Informational radar onradar
                                                                       Segarraon
                                                                               St. Segarra
                                                                                   (photo by St. (photo
                                                                                             author),      byatauthor),
                                                                                                      located             located
                                                                                                                P2 (see Figure 6).   at P2 (see Fi
                                           These data presented to the platform in early 2021 were based on two-week samples
                                             These
                                      with a data    data presented
                                                  summary  as shown below:to the platform in early 2021 were based on                       two
                                      •with a data
                                          Week       summary
                                               of 15–19            as shown
                                                        February 2021:            below:1676.
                                                                          Total vehicles:
                                       • • Week
                                              With aof
                                                     measured   average speed
                                                       15–19 February             of 21Total
                                                                               2021:    km/h and  a maximum
                                                                                              vehicles:   1676.of 62 km/h.
                                          •   Percentage of speed violations: 50.84%.
                                          • • There
                                                  With
                                                    are noa samples
                                                             measured       average
                                                                     from Friday,       speed 2021,
                                                                                    19 February of 21tokm/h
                                                                                                        Sunday,and   a maximum
                                                                                                                19 February 2021. of 6
                                          • • ThePercentage
                                                  counts of vehicles   on the  four business days
                                                                  of speed violations: 50.84%.    are:

                                            • #   There are no394;
                                                      Monday   15:    samples from Friday, 19 February 2021, to Sunda
                                              #       Tuesday 16: 423;
                                              # 2021. Wednesday 17: 430;
                                            • #   TheThursday
                                                        counts18: of428.
                                                                      vehicles on the four business days are:
                                      •   Week of 20–26 February 2021: Total vehicles: 2249.
                                                  o      Monday 15: 394;
                                          •   With an average speed of 21 km/h and a maximum of 53 km/h.
                                          •
                                                  o      Tuesday 16: 423;
                                              Percentage of speed violations: 48.92%.
                                          •              Wednesday
                                                  o are no
                                              There         samples from17:     430;24 February 2021.
                                                                            Friday,
                                          •   TheocountsThursday
                                                          of vehicles on18:the428.
                                                                               four monitored working days are:
                                              #       Monday 20: 396;
                                       •    Week
                                              #
                                                    ofTuesday
                                                       20–2621: February
                                                                   460;
                                                                               2021: Total vehicles: 2249.
                                            • # With  Wednesday    22: 453;speed of 21 km/h and a maximum of 53 km/h.
                                                          an average
                                              #       Thursday 23: 458;
                                            • # Percentage        of speed violations: 48.92%.
                                                      Saturday 25: 276;
                                            • # There      are26:
                                                      Sunday   no202.
                                                                    samples from Friday, 24 February 2021.
                                             •      The counts of vehicles on the four monitored working days are:
                                      3.3. Method
                                                           Monday
                                           Based onothe data   received20:  396;
                                                                         from   the first sensor installed, and since the data were
                                                           Tuesday
                                      not perceivedoas real,            21:study
                                                             a qualitative   460;was designed at 4 key points in the conflict zone.
                                      In order to validate
                                                    o      or not the data collected
                                                           Wednesday         22: 453;by the optical/laser sensor installed by the
                                      Barcelona City Council, and given that it does not collect the type of vehicles circulating,
                                                    o dataThursday
                                      the qualitative                    23: 458;in the article was designed. In particular, the
                                                            collection presented
                                      data referringoto theSaturday     25: 276;
                                                            type of vehicles  circulating on the streets studied are a fundamental
                                                    o      Sunday 26: 202.

                                       3.3. Method
Sensors 2021, 21, 5321                                                                                          15 of 34

                         aspect to understand the problems involved in the pacification of a single street instead
                         of an entire environment. The collection of samples from optical sensors such as the one
                         installed, or the mechanical ones that were installed a posteriori and that we will analyze
                         later, does not collect the typology of vehicles and their relationship with the environment,
                         a fundamental aspect that the qualitative approach aims to demonstrate as an approach
                         that allows for a more correct form of decision making and is adjusted to the reality of the
                         environment.
                               The qualitative visual study was carried out throughout the month of March 2021 at
                         the following four strategic points (see Figure 6):
                         •    P1: Agustí i Milà Street at number 9 (beginning of the street, with partial visualization
                              of vehicles with problems turning towards Segarra Street). This is the entry point of
                              the new loop derived from the change of direction of the main street, being a relevant
                              point to measure.
                         •    P2: Segarra Street at number 6 (visualizing the vehicles that turn from Agustí i Milà
                              towards Segarra, those that make the prohibited turn and circulate in the opposite
                              direction from Tramuntana Street, those that continue along Agustí i Milà towards
                              Meridiana Avenue, and the speed captured by the radar in its initial position as well
                              as possible measurement errors).
                         •    P3: Matagalls Street with Malats (continuation of the traffic that enters through Segarra
                              Street and goes to the center of Sant Andreu). This is the exit point of the loop.
                         •    P4: Servet Street with Arbúcies (vehicles that go up Servet towards Meridiana and/or
                              turn onto Arbúcies Street, making a closed and narrow turn forbidden to trucks,
                              towards the area of Sant Andreu—Fabra i Puig Avenue). This is a secondary exit
                              point of the new loop, in a street with the type of pavement and configuration clearly
                              focused on pedestrian mode.
                              Samples were taken at 10 min intervals at each of the four measurement points,
                         and they were divided into three large time bands, morning (07:00 a.m.–1:00 p.m.), noon
                         (1:00 p.m.–4:00 p.m.) and afternoon (4: 00 p.m.–9:00 p.m.), separating business days from
                         holidays. Additionally, it should be noted that the measurement period was conditioned
                         by the circumstances derived from local, provincial and national actions to regulate and
                         contain the COVID-19 pandemic. Therefore, the monitored period was subject to the
                         following restrictions: (a) There are time limits for bars and restaurants in the band from
                         7:30 a.m. to 5:00 p.m. Pickup hours are allowed from 7:00 p.m. to 10:00 p.m. (b) Shops
                         open during permitted hours (latest closing at 9:00 p.m.) and are closed on weekends if
                         considered nonessential. (c) A curfew restricts going out from 10:00 p.m. to 6:00 a.m. These
                         restrictions were able to influence and alter the samples that were collected, both by the
                         systems and sensors installed by the Barcelona City Council and by the visual sampling
                         conducted in the study. In this sense, it is understood that, with an unrestricted opening,
                         the traffic would be greater and would extend to new unmonitored schedules that, in any
                         case, would only increase the volume of registered traffic.
                              This qualitative sample collected visually monitored the type of vehicles circulating at
                         each point. This information is relevant as long as the damage to the pavement, bollards,
                         trees and other elements of urban furniture that the area suffers is justified. These data are
                         not collected by either of the two types of sensors installed by the City Council (the infor-
                         mational radar in Segarra Street (laser technology) uses the K-band frequency (24 GHz),
                         https://www.radarespedagogicos.com/mini-sp accessed on: 14 March 2021) or by the five
                         mechanical circulation counting points that were installed during the week of 9 March 2021
                         to 16 March 2021 (see Figure 8).
                              The latter sensors are cables called “pneumatic tubes”, and they are used throughout
                         the world to analyze the traffic that circulates on a road or street. These cables are hollow,
                         and air circulates through them. When a vehicle passes over them, the air is compressed
                         and sent to both sides of the cable. At one end is a small mechanical sensor, a “switch” that
                         sends an electrical signal to a counting system, usually articulated in the form of simple
                         software. In addition to counting the number of vehicles in a time frame, it can count the
Sensors 2021, 21, x FOR PEER REVIEW                                                                                                   16 of 35

     Sensors 2021, 21, 5321                                                                                                           16 of 34

Sensors 2021, 21, x FOR PEER REVIEW
                                  time interval between vehicles. The results of the collection of these samples will also be
                                  analyzed in the next section.

                                     Figure 8. Circulation counting mechanical sensor (photo by author) located at M2 according to Fig-
                                     ure 6.

                                           The latter sensors are cables called “pneumatic tubes”, and they are used throughout
                                     the world to analyze the traffic that circulates on a road or street. These cables are hollow,
                                     and air circulates through them. When a vehicle passes over them, the air is compressed
                                     and sent to both sides of the cable. At one end is a small mechanical sensor, a “switch”
                                     that sends an electrical signal to a counting system, usually articulated in the form of sim-
                                     ple software. In addition to counting the number of vehicles in a time frame, it can count
                                     the time interval between vehicles. The results of the collection of these samples will also
                                     Figure
                                     Figure
                                     be     8. 8.Circulation
                                        analyzed  Circulation   counting
                                                             counting
                                                     in the next           mechanical
                                                                      mechanical
                                                                  section.       sensor sensor  (photo
                                                                                        (photo by      bylocated
                                                                                                  author)  author)  located
                                                                                                                 at M2      at M2
                                                                                                                       according to accordi
                                     ure 6.6.
                                     Figure
                                     4. Results
                                     4. Results
                                     4.1.   The
                                     4.1. P1:
                                          P1:    latter
                                              Main
                                              Main      sensors are cables called “pneumatic tubes”, and they are used thr
                                                    Sample
                                                   Sample
                                      the This
                                          world
                                          Thiswaswastoidentified
                                                         analyzeasas
                                                        identified the     traffic that
                                                                      a aproblematic
                                                                           problematic    circulates
                                                                                          entry
                                                                                       entry         (i1,on
                                                                                                  point
                                                                                              point      (i1,
                                                                                                          JoanaJoan
                                                                                                                 road  or
                                                                                                                    Torres
                                                                                                                 Torres    street.
                                                                                                                                 andThese
                                                                                                                            Street),
                                                                                                                        Street),      and    cables
                                                                                                                                      givengiven
                                                                                                                                            the   the are
                                      and airimpossibility
                                     current
                                     current     circulates of
                                              impossibility    through
                                                                ofturning
                                                                    turning  them.
                                                                              onon    When
                                                                                    Gran
                                                                                 Gran           aatvehicle
                                                                                           Street,
                                                                                        Street,     at P1
                                                                                                    P1         passes
                                                                                                           (collection
                                                                                                       (collection      over1), them,
                                                                                                                         point
                                                                                                                     point           thethe
                                                                                                                                 1), number
                                                                                                                                the           air
                                                                                                                                              of isofcom
                                                                                                                                         number
                                     vehicles
                                      and sent
                                     vehicles that
                                                thatentered,
                                                   to   both their
                                                              sides
                                                       entered,      types
                                                                 their       andand
                                                                        oftypes
                                                                            the   thosethose
                                                                                 cable.  that
                                                                                           Atcaused    turning
                                                                                               onecaused
                                                                                              that    end        amaneuvers
                                                                                                             isturning        due to their
                                                                                                                   smallmaneuvers
                                                                                                                           mechanical  duesize
                                                                                                                                            sensor,
                                                                                                                                             to their a “
                                     when
                                     size  accessing
                                      thatwhen
                                           sends     anSegarra
                                                  accessing       Street
                                                               Segarra
                                                          electrical        were to
                                                                           Street
                                                                        signal   monitored
                                                                                   were        (change
                                                                                          monitored
                                                                                     a counting           of direction
                                                                                                        (change
                                                                                                     system,            problems,
                                                                                                                   of direction
                                                                                                                  usually            CDPs; in
                                                                                                                                  problems,
                                                                                                                            articulated     seeCDPs;
                                                                                                                                                the form
                                     Figure
                                     see    9).
                                         Figure    9).
                                      ple software. In addition to counting the number of vehicles in a time frame, it ca
                                      the time interval between vehicles. The results of the collection of these samples
                                      be analyzed in the next section.

                                     4. Results
                                     4.1. P1: Main Sample
                                          This was identified as a problematic entry point (i1, Joan Torres Street), and g
                                     current impossibility of turning on Gran Street, at P1 (collection point 1), the nu
                                     vehicles that entered, their types and those that caused turning maneuvers due
                                     size when accessing Segarra Street were monitored (change of direction problem
                                     see Figure 9).

                                     Figure9.9.Example
                                     Figure    Exampleofofa aCDP
                                                              CDPfor
                                                                   for a vehicle
                                                                     a vehicle in in circulation
                                                                                  circulation    between
                                                                                              between    P1 and
                                                                                                      P1 and P2. P2.
You can also read