Sea-Ice Information Services in the World - WMO-No. 574 Edition 2010 (last revision 2010-03-19) - Global Cryosphere ...
←
→
Page content transcription
If your browser does not render page correctly, please read the page content below
Sea-Ice Information Services
        in the World

              Edition 2010
        (last revision 2010-03-19)

          WMO-No. 574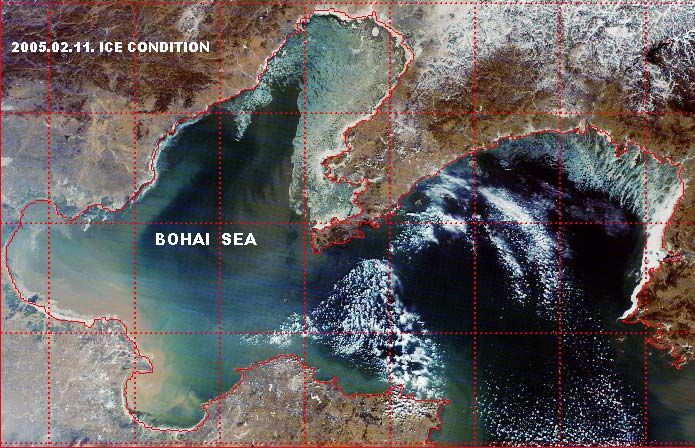
© 2010, World Meteorological Organization, Geneva

                                                ISBN 92-63-13574-6
                                                       NOTE
The designations employed and the presentation of material in this publication do not imply the expression
of any opinion whatsoever on the part of the Secretariat of the World Meteorological Organization
concerning the legal status of any country, territory, city, or area, or of its authorities, or concerning the
delimitation of its frontiers or boundaries.

ii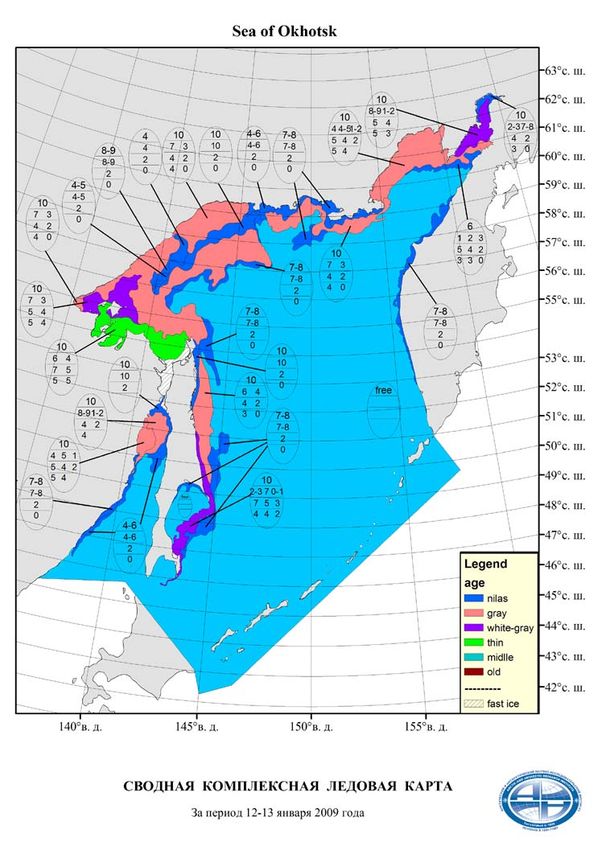
TABLE FOR NOTING SUPPLEMENTS RECEIVED

    Supplement
                       Dated                          Inserted in the publication by
       No.
1                2008-09-01     Norway – Nick Hughes
2                2008-10-31     Poland – Marzenna Sztobryn
3                2008-12-16     Finland – Ari Seina
4                2008-12-22     Argentina – Beatriz Lorenzo
5                2008-12-29     Sweden – Lisa Lind
6                2008-12-31     USA – Caryn Panowicz
7                2009-01-13     Canada, NAIS – Marie-France Gauthier
8                2009-01-20     Denmark – Martin Nissen
9                2009-03-23     Russia – Vasily Smolyanitsky
10               2009-04-15     Netherlands
11               2009-04-15     Germany – Juergen Holfort
12               2009-05-07     Latvia – Andris Viksna
13               2010-02-28     Sweden – Amund Lindberg
14               2010-03-08     Finland – Ari Seina
15               2010-03-19     Canada, NAIS - Marie-France Gauthier
16
17
18
19
20
21
22
23
24
25

                                                                                       iii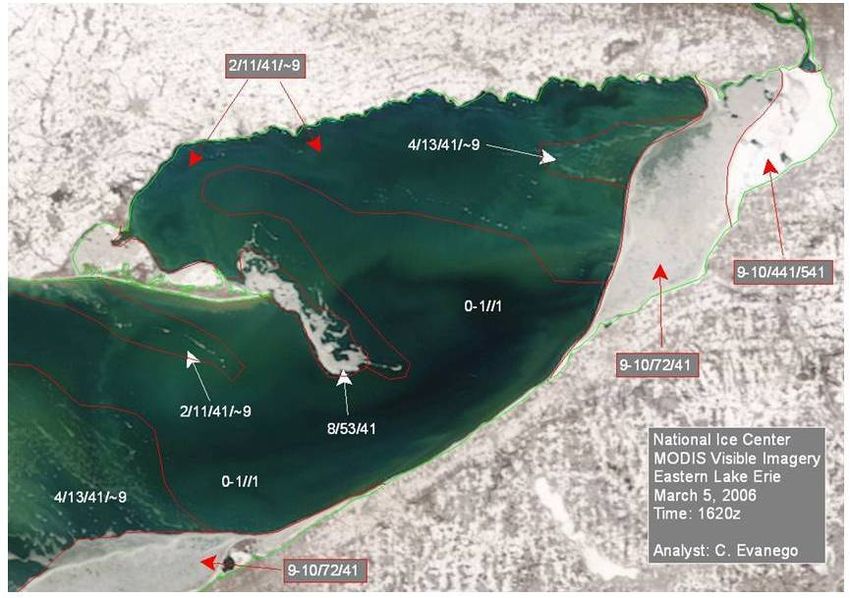
CONTENTS
INTRODUCTION ..................................................................................................................................................................1
PART I........................................................................................................................................................................................2
GENERAL ................................................................................................................................................................................2
1. The nature of sea ice..................................................................................................................................................2
2. Ice observing methods....................................................................................................................................................4
3. Integrated o bservational systems .................................................................................................................................5
4. Ice information services..................................................................................................................................................6
5. International cooperation ...............................................................................................................................................6
PART II - REGIONAL AND NATIONAL PRACTICES .............................................................................................8
Northern Hemisphere ..............................................................................................................................................................8
North and North-east Asia and North Europe....................................................................................................................8
CHINA ..................................................................................................................................................................................8
JAPAN ................................................................................................................................................................................ 10
RUSSIAN FEDERATION ............................................................................................................................................ 12
North-East Atlantic and Baltic Sea areas ........................................................................................................................... 16
DENMARK....................................................................................................................................................................... 16
ESTONIA .......................................................................................................................................................................... 19
FINLAND ......................................................................................................................................................................... 21
GERMANY ....................................................................................................................................................................... 23
ICELAND.......................................................................................................................................................................... 25
LATVIA.............................................................................................................................................................................. 26
LITHUANIA..................................................................................................................................................................... 28
NETHERLANDS ............................................................................................................................................................ 30
NORWAY.......................................................................................................................................................................... 31
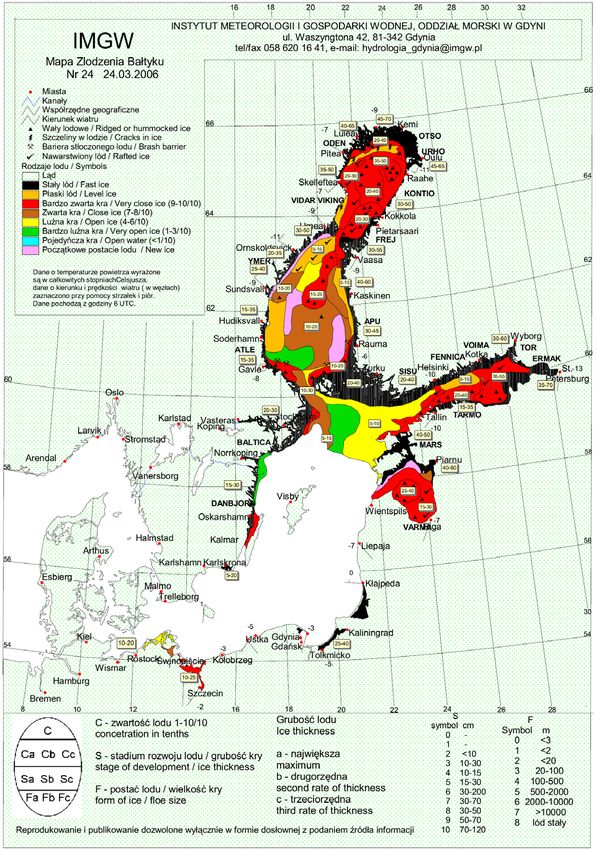
POLAND........................................................................................................................................................................... 33
SWEDEN........................................................................................................................................................................... 34
UNITED KINGDOM .................................................................................................................................................... 37
North America........................................................................................................................................................................ 38
CANADA........................................................................................................................................................................... 38
NORTH AMERICAN ICE SERVICE........................................................................................................................ 41
UNITED STATES........................................................................................................................................................... 42
SOUTHERN HEMISPHERE............................................................................................................................................ 45
ARGENTINA................................................................................................................................................................... 45
AUSTRALIA ..................................................................................................................................................................... 46
NEW ZEALAND ............................................................................................................................................................ 46
ANNEXES - SAMPLE CHARTS AND OUTPUT PRODUCTS OF NATIONAL SERVICES........................ 47
ANNEX I - Canada............................................................................................................................................................... 48
ANNEX II – China ............................................................................................................................................................... 54
ANNEX III – Denmark ....................................................................................................................................................... 57
iv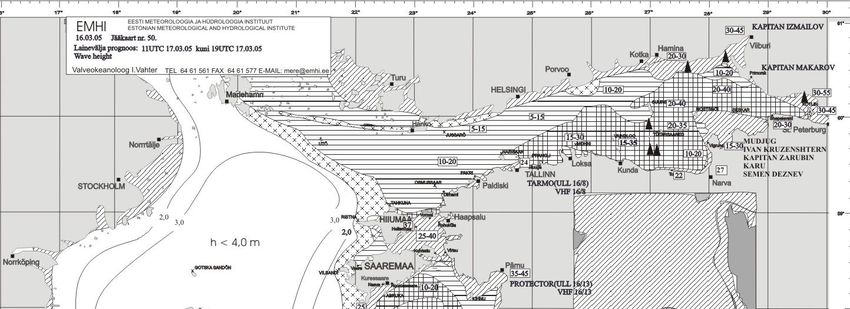
ANNEX IV - Estonia ........................................................................................................................................................... 59
ANNEX V - Finland ............................................................................................................................................................. 60
ANNEX VI – Germany ....................................................................................................................................................... 63
ANNEX VII – Japan ............................................................................................................................................................ 65
ANNEX VIII – Norway....................................................................................................................................................... 66
ANNEX IX - Poland ............................................................................................................................................................ 67
ANNEX X – Russian Federation........................................................................................................................................ 68
ANNEX XI – Sweden .......................................................................................................................................................... 73
ANNEX XII - United States................................................................................................................................................ 74
ANNEX XIII – North American Ice Service................................................................................................................... 80
List of acronyms and other abbreviations.......................................................................................................................... 81
Sea-ice products by areas of the World Ocean available via the Ice Logistics Portal ................................................. 84

                                                                                                                                                                                v
FOREWORD
The WMO publication ‘Sea Ice Information Services in the World’ (WMO No. 574) is intended to provide to mariners
and other users the latest snapshot of the sea ice services available world-wide, effectively extending the WMO
publication No. 9, Volume D – Information for Shipping. In March 2007, following finalization by the WMO
Secretariat of the 3rd edition of the publication (as hardcopy edition), the Joint World Meteorological
Organization/Intergovernmental Oceanographic Commission Technical Commission for Oceanography and
Marine Meteorology (JCOMM) Expert Team on Sea Ice (ETSI) 3rd session agreed on further annual updates of
the electronic version of the publication, using the following scheme (JCOMM Meeting report No.51):
using content of the 3rd edition of the publication as a model;
national ice services to submit corrections to the ETSI Chairperson and WMO Secretariat for
appropriate paragraphs of Parts I-II and annexes, as needed and as appropriate;
the ETSI Chairperson in collaboration with the WMO Secretariat to incorporate these corrections or
amendments, update the contents of the electronic version (including the 'Table for noting supplements
received') within a three month period and make the updated version officially available on the JCOMM
website;
the WMO Secretariat to inform the respective National Ice Services and sea ice community on the
availability of the updated electronic version with the use of a mailing list and/or appropriate news
sections and methods (similar to 'ArcticInfo');
the WMO Secretariat Publishing Department to prepare updated or amended CD-ROM versions of the
publication and/or supplements on an regular basis.
The ETSI-III session also agreed for the publication to start each section for a national ice service on an
individual page, to use a single-column layout and to include the following additional annexes:
list of abbreviations;
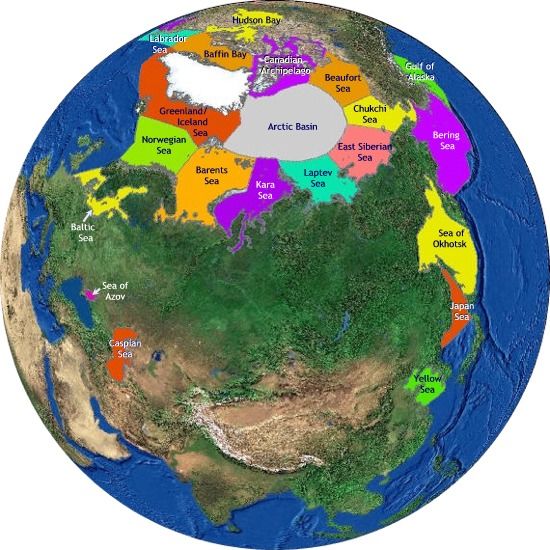
hemispheric map showing max/min ice extent plus dots showing location of ice services;
list of contact persons, which serve as editors for the electronic version of the publication.
By May 2009, updates for the first annual edition (Part-II and Annexes) were provided and included into the
annual 2009 edition of the publication with other ETSI-III decisions also being introduced in the document: the
list of abbreviations as a first and the ‘Sea-ice products by areas of the World Ocean available via the Ice
Logistics Portal’ as a second new annex. Several amendments were also introduced to Part I GENERAL, section
‘International cooperation’ reflecting new regional alliances, development of a new transfer format for ice charts
(‘Ice Objects Catalogue’) and development of a new mechanism of ice charts dissemination (‘Ice Logistics
Portal’).
The ETSI-IV session (March 2010) approved the concept and layout of the annual 2009 edition and agreed that
the similar JCOMM ETMSS “fast track” procedure should be used to further revisions of the publication with
regular updates be published on the JCOMM website and announced by the WMO Secretariat.
vi
FOREWORD to 3rd edition

Many ocean and sea areas of the world, in addition to the polar seas, are susceptible to sea ice (for example, the
Baltic Sea and parts of the Yellow Sea). Sea ice occurs in a wide range of types and forms, and affects
significantly and directly marine transport and navigation. Economic and social developments are engendering
significant increases in international shipping, particularly in areas susceptible to sea ice. The specialized
meteorological services, which evolved initially in support of local marine users, have since developed into a wide
range of sea-ice information services designed to meet many user requirements. The Joint World Meteorological
Organization/Intergovernmental Oceanographic Commission Technical Commission for Oceanography and
Marine Meteorology (JCOMM) Expert Team on Sea Ice (ETSI) (before 2001 called the Subgroup on Sea Ice –
SGSI, of the WMO Commission for Marine Meteorology – CMM) has been the focal point for promoting and
coordinating international cooperation in the acquisition, exchange, archival and dissemination of sea-ice
information.
The WMO publication Sea-Ice Information Services in the World (WMO-No. 574) was first published in 1981.
Following a recommendation of the CMM-XII in 1997, the SGSI undertook a major review of this important
publication. As a result, a second fully updated version was published in 2000. Fast progress in sea-ice
information systems, as well as the need for comprehensive sea-ice information, predetermined the decision of
the second session of the JCOMM ETSI in 2004 to start a regular update of the publication on the annual basis.
This present revised third version was prepared in 2005–2006 by the ETSI with the support of the WMO
Secretariat, and includes contributions from 20 countries from the Northern and Southern hemispheres involved
in sea-ice activities.
I believe that this publication will continue to enhance the exchange of information relating to sea ice and sea-ice
services for the benefit of many National Meteorological Services, in particular in conjunction with the
International Polar Year 2007–2008. In addition, to facilitate provision of operational information to mariners,
marine operations and controllers, it will also aid other National Meteorological Services, which are developing
their own sea-ice services.
On behalf of the World Meteorological Organization, I would like to express my sincere appreciation to all
members of the Expert Team on Sea Ice and other experts from the national ice services for their contributions
to the preparation of this valuable publication.

(M. Jarraud)
Secretary-General

                                                                                                                 vii
INTRODUCTION

Mariners have known of the existence and perils of sea ice since vessels first ventured into northern regions. The
numerous polar expeditions of the nineteenth and twentieth centuries brought new understanding of the types
and variability of conditions affecting these vast ocean areas. It was not until misfortune struck the SS Titanic,
however, that thoughts of international cooperation in sea-ice information gained any strength. After 1918,
increasing emphasis upon navigational safety and the need for agreed shipping routes led to contacts between
nations who had established their own sea-ice observational information systems. Discussions about reporting
methods, code forms and symbology (within the confines of the limited extent of observation at that time)
continued steadily until 1959. Advances in communications, the advent of aircraft observations and routine
reporting created the basis for the development of sea-ice information services by several nations by the mid-
1950s. The first international sea-ice conferences were held and the Commission for Marine Meteorology
(CMM) established a working group concerned with sea-ice affairs.
Since that time many further strides forward have been made both in observational and processing techniques,
and information services are provided now as routine for all the commonly frequented sea-ice regions. The first
edition of Sea-Ice Information Services in the World (WMO-No. 574) was prepared and published by 1981. Since then,
due to advances in remote sensing, computational means and telecommunications, significant progress has been
made in the number and complexity of sea-ice products. In addition changes in the number of sea-ice services
and their regions of responsibility have occurred. Following recommendation of the CMM-XII in 1997, the
Subgroup on Sea Ice (SGSI) undertook a review of the publication and a second fully updated version was issued
in 2000.
Further progress in sea-ice information systems, the need for comprehensive information on sea-ice services and
planning for the International Polar Year 2007–2008 predetermined the decision of the SGSI successor – the
JCOMM Expert Team on Sea Ice (ETSI) – in 2004 to update the publication on an annual basis. The third
edition was finalized by ETSI and published in hardcopy by the WMO Secretariat in March 2007.
Current annual edition is based on the latest amendments from the national services, follows the structure of the
previous publications, and has been designed to describe sea-ice services as they are today, and to provide clear
factual and updated details of the sources, background, preparation and presentation of these services. Special
attention is given to (a) processing and presentation of various satellite imagery; (b) information products based
on the results of numerical modeling of the sea-ice cover; and (c) using the Internet to relay sea-ice products to
users.
The publication consists of two parts:
Part I – A general description of the nature of sea ice, methods of observation, and the basis of ice-information
services.
Part II – A listing of the sea-ice information services available from 20 nations, given regionally, and in each case
detailing:
(a) Organization;
(b) Data acquisition;
(c) Output products;
(d) Forecasts;
(e) Publications;
(f) Mailing and Internet addresses.
These details are supported by annexes containing sample charts and illustrating a wide selection of the products
mentioned in Part II, including charts remotely sensed or with numerically modelled backgrounds, complexity,
dissemination methods and national and international practices where relevant.
The extent to which sea-ice information services have now developed will be very evident to readers. It is hoped
that this third review may in turn, through its users and those involved in related services, itself contribute
further to future advances.

                                                                                                                   1
PART I

                                                  GENERAL
                                      1.       THE NATURE OF SEA ICE
Several forms of floating ice may be encountered at sea. The most common is that which results from the
freezing of the sea surface, namely sea ice. The other forms are river ice and ice of land origin. River ice is
encountered in harbours and estuaries where it is kept in motion by tidal streams and normally presents only a
temporary hindrance to shipping. Ice of land origin in the form of icebergs is discussed separately below.
Both icebergs and sea ice can be dangerous to shipping and always have an effect on navigation. Sea ice also
influences the normal processes of energy exchange between the sea and the air above it. The extent of sea-ice
cover can vary significantly from year to year and has a great effect both on adjacent ocean areas and on the
weather over large areas of the world. Its distribution is therefore of considerable interest to meteorologists and
oceanographers.

1.1 FORMATION AND DEVELOPMENT OF SEA ICE

1.1.1 Ice less than 30 cm thick
The first indication of ice formation is the appearance of small ice spicules or plates in the top few centimeters of
the water. These spicules, known as frazil ice, form in large quantities and give the sea an oily appearance. As
cooling continues the frazil ice coalesces to form grease ice, which has a matt appearance. Under near-freezing,
but as yet ice-free conditions, snow falling on the surface may result in the sea surface becoming covered by a
layer of slush. These forms may be regrouped by the action of wind and waves to form shuga and all are
classified as new ice.
With further cooling, sheets of ice rind or nilas are formed, depending on the rate of cooling and on the salinity
of the water. Ice rind is formed when water of low salinity freezes into a thin layer of brittle ice which is almost
free of salt. Ice rind may be up to 5 cm thick. When water of high salinity freezes, especially if the process is
rapid and the wind is very light, the ice has an elastic property which is characteristic of nilas. Nilas is subdivided,
according to its thickness, into dark and light nilas; the first one reach thickness of 5 cm, while the second, more
advanced stage reaches a maximum thickness of 10 cm. Ice rind, dark and light nilas, may be referred to as nilas
ice.
Pancake ice may be formed in the boundary between two water layers of different salinity – the lower layer with
a high salinity has a temperature below the freezing point of the upper layer of lower salinity. Eventually the
pancakes will surface due to buoyancy forces. “False” pancake ice may be formed by the breaking up of nilas, or
ice rind, due to the action of wind and waves. It must be noted that the process of pancake ice formation is still
poorly investigated due to the lack of observations.
Ice rind, nilas or pancake ice may thicken into grey ice and grey-white ice, the first being 10–15 cm thick and the
latter attaining thicknesses of up to 30 cm. These forms of ice are referred to collectively as young ice. Rough
weather may break this ice up into ice cakes, pancake ice or floes of varying size.

1.1.2 Ice 30 cm – 2 m thick
The next stage of development is known as first-year ice (FY) and is subdivided into thin, medium and thick
categories. Thin first-year ice has a thickness of 30–70 cm and is subdivided according to its thickness into thin
first-year ice first stage (30–50 cm) and thin firstyear ice second stage (50–70 cm). Medium first-year ice has a
range of thickness from 70 to 120 cm while in polar areas thick first-year ice may attain a thickness of
approximately 2 m by the end of the winter.

1.1.3 Old ice
Thick first-year ice may survive the summer melt season and is then classified as old ice (MY). This category is
subdivided into second-year and multi-year ice depending on whether the floes have survived one or more
summers. The thickness of old ice is normally in the range 1.2 to 5 m or more prior to the onset of the melt
season. Old ice can often be recognized by a bluish surface colour in contrast to the greenish tinge of first-year
ice.
2
1.2 DECAY OF SEA ICE
During the winter the ice usually becomes covered with snow of varying thicknesses. While this snow cover
persists, almost 90 per cent of the incoming radiation is reflected back to space. Eventually, however, the snow
begins to melt as air temperatures rise above 0°C in early summer and the resulting fresh water forms puddles on
the surface. These puddles absorb (instead of reflect) around 90 per cent of the incoming radiation and rapidly
enlarge as they melt the surrounding snow or ice. Eventually the puddles penetrate to the bottom surface of the
floes and are known as thawholes. This decay process is characteristic of ice in the Arctic Ocean and seas where
movement is restricted by the coastline or islands. Where ice is free to drift into warmer waters (e.g. the Antarctic
and the Labrador Sea) puddling is less prevalent and decay is accelerated by wave erosion as well as warmer air
and sea temperature.
1.3 MOVEMENT OF SEA ICE
Sea ice is divided into two main types according to its mobility. One type is drift ice, which is continually in
motion under the action of wind and current stresses; the other is fast ice, attached to the coast or islands, which
does not move.
Wind stress in the drift ice causes the floes to move approximately in a downwind direction. The rate of
movement due to wind drift varies not only with the wind speed, but also with the concentration of the driftice
and the extent of deformation (see below). In very open ice (1/10–3/10) and open ice (4/10–6/10) there is
much more freedom to respond to the wind than in close ice or pack ice (7/10–8/10) and very close ice (9/10–
10/10) where free space is very limited. No water is visible within the compact ice (10/10) or consolidated ice
(10/10) where the floes are frozen together. Two per cent of the wind speed is a reasonable average for the rate
of ice drift caused by the wind in close ice, but much higher rates of ice drift may be encountered in open ice.
Since it is afloat, a force is exerted on drift ice by currents that are present in the upper layers of the water,
whether these are tidal in nature or have a more consistent direction due to other forces. It is usually very
difficult to differentiate between wind- and current-induced ice drift but in any case where both are present the
resultant motion is always the vector sum of the two. Wind stress normally predominates the shortterm
movements, particularly in offshore areas, whereas the average long-term transport is dominated by the
prevailing surface currents.
1.4 DEFORMATION OF SEA ICE
Where the ice is subjected to pressure its surface becomes deformed. In new and young ice this may result in
rafting as one ice floe overrides its neighbour; in thicker ice it leads to the formation of ridges and hummocks
according to the pattern of the convergent forces causing the pressure. During the process of ridging and
hummocking, when pieces of ice are piled up above the general ice level, large quantities of ice are also forced
downward to support the weight of the ice in the ridge or hummock. The underwater parts may be termed
respectively ice keel and bummock. The draught of a ridge can be three to five times as great as its height and
these deformations are thus major impediments to navigation. Freshly-formed ridges are normally less difficult
to navigate than older, weathered and consolidated ridges.
1.5 ICEBERGS
Icebergs are large masses of floating ice derived from glaciers. The underwater mass and draught of a berg,
compared with its mass and height above water varies widely with different composition and shapes of bergs.
The underwater mass of an Antarctic iceberg derived from a floating ice shelf is usually less than the underwater
mass of icebergs derived from Greenland glaciers. A typical Antarctic tabular berg, of which the uppermost 10–
20 m is composed of old snow, will show one part of its mass above the water to five parts below. The ratio for
an Arctic berg, composed almost wholly of ice with much less snow is generally smaller, rather one to seven.
However, because of their irregular shape the latter icebergs have a height-to-draught ratio averaging one to
three.
Icebergs diminish in size in three different ways: by calving, melting and combined melting plus erosion caused
by wave action. A berg is said to calve when a piece breaks off; this disturbs its equilibrium, so that it may float at
a different angle or it may capsize. Large underwater projections, which may be difficult to observe, are a usual
feature of icebergs in any state. In cold water, melting takes place mainly on the water line while in warm water a
berg melts mainly from below and calves frequently. It is particularly dangerous to approach a berg in this state
for it is unstable and may fragment or overturn at any time. There are likely to be many growlers and bergy bits
around rapidly disintegrating icebergs, which form a particular hazard to navigation.
3Weathered bergs are poor reflectors of radar pulses and cannot always be detected by such means. Their
breakdown fragments – bergy bits and growlers – are even more difficult to detect with ships’ radar for the
background clutter from waves and swell often obscures them. These smaller fragments are especially dangerous
to shipping for, despite their low profile they represent sufficient mass to damage a vessel, which comes into
contact with them at normal cruising speed. Some growlers consisting of pure blue ice hardly break the sea
surface and are extremely difficult to detect.
2. ICE OBSERVING METHODS
Although broad knowledge of the extent of sea-ice cover has been totally revolutionized by satellite imagery,
observations from shore stations, ships and aircraft are still of great importance in establishing the “ground
truth” of satellite observations. At present, observations of floating ice depend on instrumental and, to lesser
extent, on visual observations. The instrumental observations are by conventional aircraft and coastal radar,
visual and infra-red airborne and satellite imagery, and more recent techniques, such as passive microwave
sensors, laser airborne profilometer, scatterometer, side-looking (airborne) radar (SLAR/SLR) or synthetic
aperture radar (SAR, satellite or airborne).
The four most important features of sea ice, which affect marine operations, are:
(a) Its thickness (stage of development);
(b) The amount present – concentration, usually estimated according to the tenths or percentage of the sea
surface covered by the ice;
(c) The form of the ice, whether it is fast or drift ice and the size of the constituent floes; and
(d) Any movement of the ice.
On a ship or at a coastal station it is obvious that a better view of the ice is obtained if the observation is made
from a point as far above the sea as possible. From the bridge of a ship 10 m above the sea, the horizon is about
12 km away and good observations can cover a radius of only 7–8 km. From the top of a coastal lighthouse 100
m above the sea the visual range is almost 40 km and the observation may then cover a radius of 20 km.
Shore locations may provide an ice report several times a day as the ice changes in response to wind and current
but the total area of ice being reported is very small. From a ship progressing through the ice, a summary report
of the ice encountered during daytime progress may represent an area of the sea ice 15 km wide and 100 km long
(assuming a ship’s speed of approximately 5 kt). In some marine areas, such as the Baltic Sea, coastal settlements,
lighthouses and ships may be present in sufficient numbers that a reasonable proportion of the ice cover can be
reported each day by an organized surface network. In others such as the Gulf of St Lawrence, where the
waterways are broad and the shores often unsettled, no shore reporting system can provide data on more than a
very small percentage of the total ice cover. Although surface based reports can provide excellent detail about
the ice, especially its thickness, it is generally recognized that for most areas, the surface reports are not really
adequate to describe ice conditions fully.
Reports about the ice cover taken from the air, i.e. helicopters and fixed-wing aircraft, have the advantage of a
much better viewing angle; the platform’s flying speed allows a great deal more of the sea ice to be reported; and
problems of remoteness from airports or other suitable landing sites can be overcome by using long-range
aircraft. In several countries, ice observers are trained to recognize the various stages of development of sea ice,
to estimate its amount, to note its deformation and the snow cover or stage of decay. All these data are provided
by visual estimation and both training and experience are required to make the information reliable.
Comprehensive aerial reporting has its own particular requirements beginning with an accurate navigational
system when out of sight of land. Inclement weather – fog, precipitation and low cloud – will restrict or interrupt
the observations and the usual problems of flying limits at the aircraft base may also be a factor even if the
weather over the ice is adequate for observing.
Recent advances in technology are now permitting more precise data to be obtained by aerial observations.
SLAR and SAR can provide information, which documents precisely the distribution and nature of the ice in one
or two belts along the flight path of the aircraft for distances of up to 100 km on each side. Unlike most other
sensors, the radar has the capability of monitoring the ice under nearly all weather conditions. It responds mainly
to the roughness of the ice surface but the dielectric properties of each ice floe also affect the response.
When no fog or low clouds are present a laser airborne profilometer can be used to measure the height and
frequency of ridges on the ice, and under similar conditions an infra-red airborne scanning system can provide
excellent information with regard to floe thickness in the ranges below 30 cm.
4The advent of earth-orbiting meteorological satellites has added a third, and now the most important and
predominant, mode of observing sea ice but again there are some restrictions. The spectral range of the sensors
may be visible, infrared, passive or active microwave or a combination of these. Satellite coverage may be broad
at low resolution or cover a narrow swathe at high resolution. In the latter case, data from a particular location
may be obtained only at temporal intervals of several days. There is always the problem of rates of data
transmission from space and the orbital altitude of the satellite, which affects the range of reception at each
receiving station.
In general, most meteorological satellites provide 10–12 passes daily in the polar regions, i.e. complete coverage
of polar regions once or twice a day. These satellites provide visible and infrared imagery with resolutions of 250
m–1 km (NOAA AVHRR, METEOR, MODIS, DMSP OLS); and passive microwave and scatterometer data at
coarser resolutions of 6–70 km (AQUA AMSR, NOAA AMSU, DMSP SSM/I, SeaWinds QuikScat). Visible and
infrared data do not have cloud-penetrating capability while microwave data are practically cloud independent.
Active microwave SAR data (RADARSAT, ENVISAT) are characterized by improved ground resolution
(approximately 10–100 m) but a reduced coverage due to narrow swathes and greater revisit time between exact
repeat orbits. Ice services are also awaiting data from new satellites such as Cryosat (altimeter) in 2007 and ALOS
(radiometer, SAR) in 2005.
Manual or visual interpretation of imagery from visible and infrared sensors requires a certain amount of skill, for
example, a picture element composed of 50 per cent white ice and 50 per cent water will have the same greyness
in the visible image as another element in which the whole surface is covered with thin (grey) ice. Snow cover on
the ice and puddles on the floes are other complicating factors. Interpretation of SAR images may be even more
difficult due to the ambiguities associated with SAR backscatter from sea-ice features that vary by season and
geographic region. Therefore, in recent years automated digital processing techniques have been developed to aid
in the interpretation of satellite data. Techniques are usually implemented within geographical information
systems (GIS) and include automatic and/or interactive image georeference, enhancement and various types of
image recognition and classification, which are based on data from a single sensor or combination from several
ones.
Space-borne sensors can provide precise data on the location and type of ice boundary, concentration or
concentration amounts (in tenths or percentages) and the presence or absence of leads, including their
characteristics, if radar sensors are used. Less accurate information is provided on the stages of development of
the sea ice including the FY/MY ratio, forms, with an indication of whether ice is land-fast or drifting, stages of
ice melting and ice surface roughness. Floe motion over approximately 12–24-hour intervals can often be
determined through the use of imagery from sequential orbits.
3. INTEGRATED O BSERVATIONAL SYSTEMS
Any well-designed ice services system must consist of three major components:
(a) A surface observation network consisting of in situ reports and remotely sensed data;
(b) A communication system to gather and distribute the ice information; and
(c) A digital data integration, analysis and production system.
Surface reports from shore stations, ships and drifting buoys provide accurate information on ice amount,
thickness, motion and its deformation over rather small areas. When many vessels and fixed observing points are
available accurate information can be provided in restricted waterways. Many areas of the Kattegat and Baltic Sea
coastline fall into this category and landline facilities are available for the relay of these reports to national or
regional centres.
When waterways are more open or more remote from populated areas, either satellite data or aerial observations
must be integrated into the system. Aerial data are normally prepared by the observers in map format as they fly
along the prescribed track. An airto-ship communication line is needed to pass the data directly to vessels in the
area. This may be merely a voice channel, a radio facsimile broadcast or a digital network link, which enables
radar data or the ice chart itself to be passed to the ships. In most cases, these data are also passed to the ice
centre for integration into regional-scale analysis products.
Satellite data are typically passed in real-time (less than six hours) from satellite ground stations to the ice centres
via high-speed communication links. Visible, infrared, passive microwave, SAR data are then digitally processed,
integrated with meteorological guidance products and ice model output and then analysed by computer, typically
using GIS. Image enhancement techniques and various other automated algorithms are often employed in the
production of an ice analysis. Ice analyses are produced as charts at varying scales (typically ranging up to
51:2,500,000) depending on the size of the area and the level of detail required. The ice charts are made available
as data coverages in GIS formats and/ or as simple electronic charts in such graphic formats as GIF or PNG,
which can be viewed with almost any web browser or graphics viewer. Charts are typically labelled and coloured
using the WMO international sea-ice symbology (WMO-No. 259) and Ice Chart Colour Code Standard
(WMO-TD-No. 1214). Other ice analysis products include annotated satellite imagery, usually in JPEG and
TIFF formats, text messages and electronic charts.
4. ICE INFORMATION SERVICES
Once the observational material from all sources has been combined into an ice chart which represents existing
conditions the ice centre then has the task of relaying the chart to users while it is still timely. The ice data can
also be combined with meteorological and oceanographic parameters in a prediction model to provide further
guidance to vessels in or near the ice.
Relay of charts of existing ice conditions is mostly conducted by radio facsimile or in recent times via a digital
network link. Time slots and schedules usually dictate the scale and number of charts provided by the broadcast
station in the area of concern. Direct broadcast by the ice centre is obviously ideal but not always feasible.
Forecasts of ice conditions are difficult to prepare for, besides the drift caused by the wind, the floes are also
affected both by residual and tidal currents. The results are complicated, and knowledge of the detail of
oceanographic factors is not often available. In some cases the wind drift alone is specified and it is left to
individual ships’ captains to interpret this in relation to their own position. Recent advances in computer models
for ice prediction are allowing more detailed data to be provided (as in the case of the gulfs of Bothnia and
Finland – for example) but these require further facsimile or digital network transmission time, which may not be
available.
Usually, ice forecasts are prepared once a day for a period of 24 to 144 hours because they are tied to the
frequency of the data input. These are tactical forecasts, for scheduled radio broadcast to ships which may
provide advice on difficult ice conditions forming or dissipating, the general motion of the pack, opening and
closing of leads, etc. They are strongly influenced by meteorological prediction and should always be used in
concert with the weather forecast.
Other longer-range predictions – those covering periods from 7–10 days to 30 days and seasonal predictions –
are usually based on climatological and analogue methods. They are more commonly distributed by ground or
electronic mail to shipping companies and agents rather than to individual ships.
After the ice data have been processed operationally and used in relation to the existing marine traffic, they can
then be passed to a climatological unit of the ice service which compiles and analyses them in relation to
averages, and which prepares atlases to be consulted by planners, marine architects and others who deal with
longer-term aspects of the ice conditions and their effect on human activities.
5. INTERNATIONAL COOPERATION
In some areas of the world a regional approach to ice services is far more economical and efficient than one
based solely on national facilities. For example, in North America, a joint service involving the USA and Canada
has been adopted as the best method of supporting winter shipping in the Great Lakes. Starting in December
2004, the Canadian Ice Service and the US National Ice Center started jointly producing ice charts, ice hazard
bulletins, 30-day forecasts and seasonal outlooks for the Great Lakes under the banner of the North American
Ice Service (NAIS). The workload and the data sources for these products are shared between the stated two
services. In the coming years, this practice will be extended to encompass all of the ice-covered waters of North
America. The similar Baltic Sea Ice Services (BSIS) is under steady development and includes informational
exchange between Denmark, Estonia, Germany, Finland, Latvia, Lithuania, the Netherlands, Norway, Poland,
the Russian Federation and Sweden. A common numerical ice-reporting code (the Baltic Sea Ice Code), sea-ice
charts (international sea-ice symbols), integrated data broadcasts in clear English and similar shipping control
regulations are used. In Finland and Sweden icebreaker assistance is integrated in the Gulf of Bothnia. In special
situations, such as when the Baltic Sea is totally ice covered, all icebreaker assistance in the Baltic Sea is
integrated, with the common aim of supporting marine traffic. This is done under the development of BIM
(Baltic Icebreaking Management), which is the cooperation body of the Baltic Sea icebreaking organizations. The
Global Monitoring for Environment and Security (GMES), ICEMON and Northern View projects
(http://earth.esa.int/gmes/) include partners from federal services as well as from research and industrial
communities and are aimed at the implementation of a coherent operational oceanography system for the high
latitudes, consisting of sea ice, meteorological and oceanographic services.
6On a larger scale the WMO/IOC JCOMM Expert Team on Sea Ice (ETSI) has been instrumental in developing
an internationally accepted terminology, formats to exchange operational and archived data on sea ice and other
guidance material. To this effect the ETSI also collaborates with other international sea-ice groups – the
International Ice Charting Working Group (IICWG) and the Baltic Sea Ice Meeting (BSIM). The international
sea-ice terminology including an illustrated glossary and a set of chart symbols was developed and first published
in 1971 in English, French, Russian and Spanish (WMO Sea-Ice Nomenclature, WMO-No. 259) with later
additions and corrections introduced in 2004.
From November 2004 an electronic version of the nomenclature (predefined English, French, Russian and
Spanish versions in alphabetic/subject order, equivalents, search/selection option), is available at
(http://www.aari.nw.ru/gdsidb/XML/wmo_259.php). A set of formats was designed for the archive mode sea-
ice information exchange (SIGRID, WMO 1989, SIGRID-2, WMO 1994).
In cooperation with IICWG, two JCOMM Technical Report Series documents – SIGRID-3: A Vector Archive
Format for Sea-Ice Charts (WMO/TD-No. 1214) and Ice Chart Colour Code Standard (WMO/TD-No.
1214) were prepared and issued in 2004. Both documents are available as hard copy by request from the WMO
Secretariat or in electronic form from the JCOMM publication web page
http://www.wmo.int/pages/prog/amp/mmop/publications.html).
The ETSI in March 2007 adopted the “Ice Objects Catalogue Version 4.0” as the sea ice extension of the IHO
S-57 format for the ENCs and agreed on a formal mechanism for its maintenance and development with
JCOMM ETSI recognized as the competent international technical group on sea ice and icebergs by the WMO,
IOC and IHO Committee on Hydrographic Requirements and Information Systems (CHRIS), the WMO
Secretariat as Register Owner and Manager, Register Users as anyone interested in sea ice or iceberg MIOs, the
Control Body as the ETSI ENC Ice Objects Task Group (TG ENCIO), the Submitting Organization as WMO
and proposers as ETSI Members from Canada, Germany, Russian Federation and USA. In May 2008 the TG
ENCIO finalized inclusion of the “Ice Objects Catalogue Version 4.0” into the IHO Register, so that presently
the S-57 sea ice extensions are freely available within the Open Geospatial Consortium (OGS) Geospatial Data
Abstraction Library (GDAL).
Until the 1980s, most ice services were directed towards shipping and offshore exploration. As a result, the needs
were very specific but national or regional in nearly every case. With more interest and study being directed
towards the world’s climate in recent years, there is a growing need for international data exchange for use by
meteorological and oceanographic researchers. This required the creation of data banks at a coarser scale than in
operational services. Within the WMO project, Global Digital Sea Ice Data Bank (GDSIDB), which started in
1989, historical sea-ice information for the major part of the 20th century was archived in electronic form due to
collaborative efforts of several ice services, institutions and data centres (from Argentina, China, Canada,
Denmark, Finland, Japan, the Russian Federation, Sweden and the USA). Presently, the GDSIDB has two
archiving centres, located at the Arctic and Antarctic Research Institute, St Petersburg, Russian Federation
(http://www.aari.nw.ru/gdsidb) and the National Snow and Ice Data Center, Boulder, USA
(http://nsidc.org/noaa/gdsidb) and holds 7- or 10-day-period mapped ice data for the Arctic starting from
March 1950 and for the Antarctic from January 1973 and to near the present for both regions. From 1970s
GDSIDB ice charts may serve as a ground-truth to SSM/I products or be the unique source of data on ice
conditions and climate for before 1978. During 2002–2003 the first blending technique for Northern
Hemisphere GDSIDB charts was developed and the resulting blended data set presently contains the greatest
amount of ice data for 1950–1998. The product is scheduled to be extended as new data become available.
IICWG jointly with ETSI contributed to the development of the Ice Logistics Portal (http://ipy-ice-
portal.com/) as a joint initiative with the European Space Agency through the EarthWatch GMES Service
Element PolarView in support of the IPY 2007/2008. This Portal provides a single interactive website to
operational sea ice information from National Ice Services for regions in the northern and southern
hemispheres. The Portal has been active since May 2007 and utilizes a provider-flexible operative scheme
resembling another WMO End-to-End Data Management project (E2EDM). It contributes to the Global
Cryosphere Watch (GCW) and the MyOcean project, funded by the European Commission. In 2009-2010 the
Ice Logistics Portal has been transferred from PolarView to the German Ice Service, Bundesamt fuer
Seeschifffahrt und Hydrographie (BSH), http://www.bsis-ice.de/IcePortal, with two versions running in
parallel mode at the current time.
7PART II - REGIONAL AND NATIONAL PRACTICES
Northern Hemisphere
North and North-east Asia and North Europe
CHINA
1. Organization
The national ice service is provided by the National Marine Environment Forecast Centre (NMEFC), State
Ocean Administration (SOA). Major users of the services are the China Offshore Oil Bohai Corporation
(COOBC) and coastal and harbour activities. In the period from December to March, ice observation and
forecasting services are provided for the Bohai Sea and the northern Yellow Sea. The ice services for local
operations and specific tasks are provided by the Group of Sea Ice Management (GSIM) of the COOBC. An ice
forecasting service is also provided by the Qingdao Marine Forecasting Observatory (QMFO) of SOA.
2. Data acquisition
Sea-ice type, thickness, concentration and temperature are operationally measured according to “The
Specification for Offshore Observations” (GB/T 14914-94, SOA) at 11 coastal stations along the Bohai Sea and
the northern Yellow Sea. Icebreakers are used by the Navy and COOBC for operational observations of sea-ice
edge, thickness and type according to “The Specification for Oceanographic Survey” (GB/T 12763-91, SOA)
and for special surveys. Ice condition reports are also provided by SOA patrol ships. The ice temperature,
thickness and type are obtained from aerial remote sensing and the aerial survey of sea ice is provided as one of
the operational observations during January to February.
The North Sea Branch (Qingdao) of SOA manages the operation of a dedicated aircraft equipped for ice
reconnaissance missions in the Liaodong Gulf, Bohai Gulf, Laizhou Bay and in the shore of northern Yellow
Sea. The helicopter reconnaissance flight is managed by the COOBC for special missions. Radar imagery from
Bayuquan station of SOA and real-time ice data at the platform JZ-20-2 (40°27’N, 121°17’E) in the Liaodong
Gulf are provided daily. The visible and infrared satellite imagery from NOAA (AVHRR) and the MODIS
imagery from both satellites of the EOS series (TERRA and AQUA) are received by the NMEFC. The MODIS
imagery has been applied in sea-ice operational monitoring and numerical seaice forecasting for the Bohai Sea
since the winter of 2002; the precision of sea-ice monitoring has been improved with its high resolution.
3. Output products
(a) Chart output
A remote sensing image, showing sea-ice conditions in the Bohai Sea, is transmitted daily by e-mail or
facsimile to each user (Figure II-1, Annex II). An analyzed chart of ice thickness, area and edge at the
same scale is prepared daily and transmitted by the NMEFC (Figure II-2, Annex II). The fifth-day sea-
ice thickness and concentration forecast charts (Figure II-3 and Figure II-4, Annex II), with the PIC ice
model, and the forecast of ice drift (arrow) and thickness (isoline) by the operational ice mode (Figure
II-5, Annex II), covering the Bohai Sea, are prepared daily by the NMEFC and transmitted by e-mail or
facsimile to COOBC, shipping companies and other users.
(b) Coded output
Forecasted fields of ice concentration, thickness and velocity at grid points in tenths of degrees of
latitude and longitude, at 12-hour intervals up to 120-hour and analyzed fields are transmitted daily by
computer network.
(c) Plain language
(i) Plain-language ice information with images and a 10-day outlook of ice conditions in the Bohai
Sea and the northern Yellow Sea are prepared by the NMEFC and are disseminated by closed-
circuit television and radio every 10 days during winter.
8(ii) A long-range outlook for the next winter is prepared and mailed. It is also transmitted by
facsimile in October from the NMEFC.
(iii) A 10-day forecast and an outlook up to one month are mailed and transmitted by facsimile for
each 10-day and month period from the NMEFC and QMFO respectively.
(iv) A Sea-Ice Management Brief Report including sea-ice conditions, forecasts of ice and weather
for the next week, information about sea-ice monitoring and forecasting, as well as suggestion to
coastal and offshore operations is prepared by GSIM, and mailed and transmitted by facsimile
weekly.
4. Forecasts
Numerical sea-ice forecasts for up to five days ahead for the Bohai Sea are prepared daily by the NMEFC using a
PIC ice model with fine resolution and a thermodynamic- dynamic operational ice model at the same time. The
forecast products contain fields of ice thickness, concentration and velocity, ice edge, parameters of ice ridge and
local estimates of ice thickness and tracks of ice floes near drilling platforms.
The 10-day and the 30-day forecasts are prepared using statistical methods to determine ice edge, and mean and
maximum of ice thickness in the Liaodong Gulf, Bohai Gulf, Laizhou Bay and northern Yellow Sea by the
NMEFC and QMFO/SOA.
The long-range seasonal outlook is prepared using statistical methods to estimate the ice conditions of the Bohai
Sea and the northern Yellow Sea the following winter.
5. Publications
The China Ocean Annuals, China Marine Environment Annual Report and China Marine Disaster Bulletin
(all in Chinese) are annually prepared by SOA. These publications include sea-ice conditions, disasters and
activities about sea ice for the year.
6. Mailing and Internet addresses
Mailing addresses
National Marine Environment Forecast Centre (NMEFC)
8 Dahuisi Rd
Haidian District
Beijing, 100081 China
Telephone: +86 010 62105750 Telefax: +86 010 62173620
E-mail: baishan@nmefc.gov.cn (Dr Shan Bai)
Qingdao Marine Forecasting Observatory of SOA
22 Fushun Road
Qingdao, 266033 China
Telephone: +86 0532 5611238 Telefax: +86 0532 5644944
E-mail: gmingke@public.qd.sd.cn (Dr Mingke Guo)
Group of Sea Ice Management
c/o General Dispatch Office
China Offshore Oil Bohai Corporation
P.O. Box 501 Tanggu
Tianjin, 300452 China
Telephone: +86 022 25800730 Telefax: +86 022 25807504
E-mail: wangwei3@cnooc.com.cn (Dr Wei Wang)
Internet addresses: NMEFC: http://www.nmefc.gov.cn
9JAPAN
1. Organization
Sea-ice information services in Japan are provided by two governmental agencies: the Japan Meteorological
Agency (JMA) and the Japan Coast Guard (JCG), mainly for fishing, shipping and coastal and harbour activities.
2. Data acquisition
Sea ice in the Sea of Okhotsk is formed in November and melts away and disappears in July. Sea ice is at its
maximum extent from late February to early March.
Five weather stations of the JMA and seven coast guard stations of the JCG conduct daily visual observations of
the amount and the condition of the sea ice. Patrol vessels of the JCG routinely report the sea-ice conditions,
including types of sea ice, concentration, ice thickness and difficulties of navigation. The JMA and JCG exchange
their sea-ice data by telefax and disseminate derived products to users.
Aerial observations are carried out around 10 times per year by the JMA in cooperation with the Japan Defense
Agency (JDA) and about 10 times per year by JCG aerial observations. Both aerial observation data are used for
sea-ice analysis at the JMA and JCG.
The JMA conducts satellite data analysis for sea-ice extent in the Sea of Okhotsk every day in winter using visible
and infrared images of the MTSAT, NOAA-17 and NOAA-18 and microwave data of the Special Sensor
Microwave/Imager (SSM/I) from the United States Defense Meteorological Satellite Program (DMSP) and the
Advanced Microwave Scanning Radiometer (AMSR-E) from Aqua. Since March 2003, synthetic aperture radar
(SAR) data from RADARSAT have also been used.
3. Output products
(a) Sea-ice condition charts (Figure VII-1, Annex VII) issued by the JMA are broadcast by meteorological
radio facsimile on short wave (call sign: JMH) twice a week (on Tuesday and Friday) from December to
May. The charts cover the Sea of Okhotsk, the northern part of the Sea of Japan including Peter the
Great Bay, the northern part of the Yellow Sea, the Bo Hai, and the vicinity of Hokkaido, the Kuril
Islands and the Kamchatka Peninsula. The charts show sea-ice edges, four classes of sea-ice
concentration with a description of sea-ice conditions and one-week forecasts in both Japanese and
English.
(b) Numerical sea-ice forecast charts, which show the distribution and concentration of sea ice for two and
seven days ahead (Figure VII-2, Annex VII), are also broadcast by the JMH twice a week (on Wednesday
and Saturday) when the southern edge of sea-ice extent in the Sea of Okhotsk is located south of 48°N.
The forecast charts are objectively derived by a numerical sea-ice model, in which the physical processes
of sea-ice formation/melting and drift of sea ice due to wind and ocean currents are considered.
(c) The Ice Information Center of the First Regional Coast Guard Headquarters of the JCG also
disseminates the daily sea-ice charts around Hokkaido via the Internet
(http://www1.kaiho.mlit.go.jp/KAN1/ice_center/ice_center-e.html) in Japanese, English and Russian.
4. Publications
(a) The Results of Sea-Ice Observations: an annual publication of the JMA, which contains the results of
the daily visual observations by five weather stations of the JMA, the annual summary of sea-ice
conditions with five-day sea-ice charts in the Sea of Okhotsk and five-day sea-ice charts in the polar
regions; published on CD-ROM every October.
(b) Kaiyou Gaihou – Kaihyou hen: an annual publication of the First Regional Coast Guard Headquarters
of the JCG, which contains the annual summary of observations by seven coast guard stations, patrol
vessels and aircraft; published in printed matter (in Japanese).
5. Mailing and Internet addresses
Mailing address
Office of Marine Prediction
10You can also read