TRANSPARENT 2020 MAPPING CORPORATE ACTION ON PLASTIC WASTE - JUNE 2020 - RESOURCE PLASTIC
←
→
Page content transcription
If your browser does not render page correctly, please read the page content below
Transparent 2020
Mapping corporate action on plastic waste
                                        June 2020
Acknowledgements

“In the past few years it has become evident that we    “We recognize that plastic pollution is a challenge
must radically speed up the transition to a circular    that none of us can tackle alone. Collaboration is
economy for plastic, in which it never becomes          critical, and we look forward to continuing to work
waste or pollution. We must eliminate the plastics      alongside WWF and our fellow ReSource: Plastic
we don’t need, innovate to ensure that the plastics     Principal Members to identify ways to collectively
we do need are reusable, recyclable, or compostable,    advance more sustainable solutions at scale.
and circulate all the plastic items we use to keep      McDonald’s is already working on a wide-ranging
them in the economy and out of the environment.         program to keep plastic out of nature, which
The New Plastics Economy Global Commitment has          includes removing and minimizing plastic and
brought unprecedented transparency on industry          improving recyclability in packaging. We are pleased
action, highlighting progress on elimination of and     to see the findings in this report are aligned with the
innovation for plastic packaging. We welcome            direction of our packaging and recycling strategy,
WWF’s inaugural ReSource: Plastic report as a step      with a strong focus on circularity.”
towards building further transparency on the              – KEITH KENNY, CORPORATE VICE PRESIDENT, SUSTAINABILITY,
circulation and after-use fate of plastic packaging         MCDONALD’S

across different geographies.”
  – SANDER DEFRUYT, LEAD OF THE NEW PLASTICS ECONOMY
    INITIATIVE AT THE ELLEN MACARTHUR FOUNDATION        “Plastics stemming from the food and beverage
                                                        industry make up a majority of the items collected
                                                        from beaches and waterways around the world
“As a Principal Member of ReSource: Plastic, Keurig     during Ocean Conservancy’s annual International
Dr Pepper is proud to be a part of this inaugural       Coastal Cleanup, so there is a critical need to better
report. The data outlined within provides a land-       understand this sector’s plastics footprint if we want
scape analysis of the challenges that brands,           to make a real dent in the ocean plastics crisis. This
packaging manufacturers and our global recycling        first ReSource: Plastic report is an important step in
systems face and, as a member of the first cohort       filling that knowledge gap, and it is encouraging to
of principal members, we are now positioned to          see other companies, including several members of
accelerate the path forward with solutions              the Trash Free Seas Alliance, committing to greater
grounded in data and collective action. The findings    transparency, as well. Everyone needs to be part
of the report underline the importance of the           of the solution—the problem is simply too big to
packaging and waste elimination goals we have set       tackle alone.”
for our company and reiterate the importance of
                                                          – EDITH CECCHINI, PROJECT DIRECTOR FOR CORPORATE
collaboration. We look forward to the expansion             STRATEGY AND POLICY AT OCEAN CONSERVANCY
of this promising program and continuing to be
an active and collaborative member as the group
grows and evolves.”
  – MONIQUE OXENDER, CHIEF SUSTAINABILITY OFFICER,
    KEURIG DR PEPPER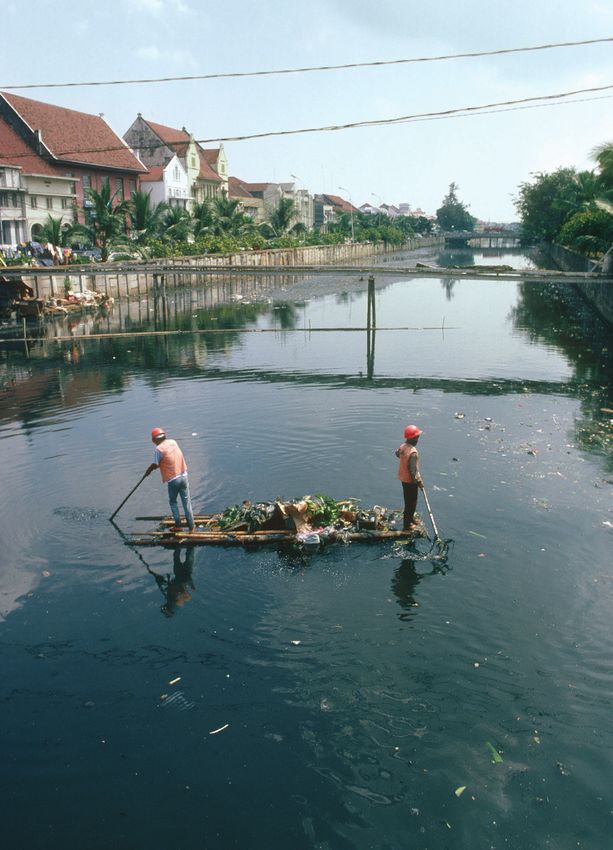
“Plastic pollution of our ocean is set to increase       “In 2018, we launched our World Without Waste
dramatically under current conditions. Pew               initiative with a simple, focused purpose: make the
welcomes this report by WWF further highlighting         world’s packaging waste problem a thing of the
the problem and the need to take collective and          past. We know that we can’t do this alone—we need
decisive actions.”                                       collective action. Building on our engagement with
  – SIMON REDDY, DIRECTOR, ENVIRONMENT, THE PEW         the Ellen MacArthur Foundation, ReSource: Plastic is
    CHARITABLE TRUSTS                                    another step that Coca-Cola is taking to advance
                                                         this work. We need additional companies to join this
                                                         effort as we focus on transparency and common
“At P&G we’re concerned about plastic waste in our       frameworks that will help drive real, meaningful
environment. It’s a complex global challenge that        results.”
requires a comprehensive approach across the               – BEN JORDAN, SENIOR DIRECTOR OF ENVIRONMENTAL
entire plastics lifecycle, and everyone has a role to        POLICY, THE COCA-COLA COMPANY

play. The findings in WWF’s ReSource: Plastic report
will help point us to the biggest opportunities to
work together on circular solutions so that plastic      “This thoughtful and transparent report is exactly
is treated as a resource that is collected, recycled     what the industry needs to advance the U.S. recy-
and reused.”                                             cling system and the circular economy. I commend
  – VIRGINIE HELIAS, CHIEF SUSTAINABILITY OFFICER,      WWF’s leadership through the ReSource Footprint
   PROCTER & GAMBLE                                      Tracker as well as the companies that have boldly
                                                         stepped up to be part of this solution-oriented
                                                         approach. As stated in the report, the U.S. recycling
“Global crises like plastic waste, climate change, and   system needs help now more than ever. The
water, require private sector leadership and truly       Recycling Partnership is proud to work with WWF on
global collaboration. This means actively working        the solutions and actions that will keep plastic out
with other brands, governments, NGO’s and key            of the environment and in a circular system.”
industry stakeholders to bring about sustainable           – KEEFE HARRISON, CEO, THE RECYCLING PARTNERSHIP
change. ReSource and the detailed reporting by the
participating companies provides a common
framework and insights for us to act.”
  – MICHAEL KOBORI, CHIEF SUSTAINABILITY OFFICER
    AT STARBUCKS

                                                                                                              i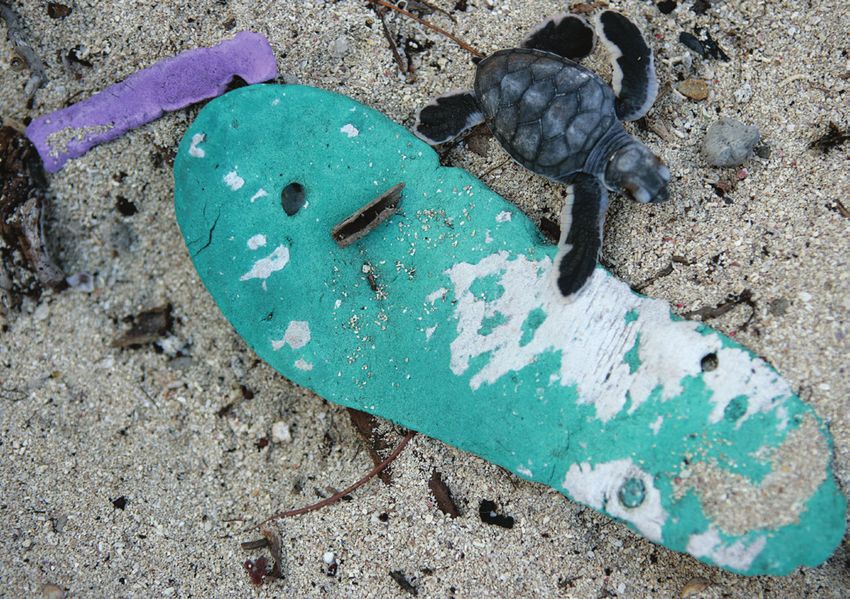
Executive Summary

WWF has established a vision of No Plastic in Nature by      This report presents key findings related to the ReSource
2030 and imagines a world where our resources are            Principal Members’ global plastic footprints in 2018,
never wasted. ReSource: Plastic leverages the power of       including their use of plastic by polymer type and form,
business to achieve this vision. In its inaugural year,      use of recycled content and sustainably sourced
ReSource: Plastic worked with five Principal Members         biobased content, and the likely waste management
(Keurig Dr Pepper, McDonald’s Corporation, Procter &         pathways for their plastic portfolios. The scope and
Gamble, Starbucks, and The Coca-Cola Company) as well        characteristics of each company’s data are outlined
as Thought Partners (The Ellen MacArthur Foundation and      within the report. Keurig Dr Pepper reported 208,000
Ocean Conservancy) to establish a baseline of plastic use.   metric tons of plastic; McDonald’s Corporation reported
                                                             153,000 metric tons; Procter & Gamble reported
The ReSource Footprint Tracker is the main analytical        605,000 metric tons; Starbucks reported 190,000 metric
tool through which corporate action and progress are         tons; and The Coca-Cola Company reported 3 million
measured for ReSource: Plastic. The Tracker provides a       metric tons. In total, 4.2 million metric tons of plastic
standard methodology to track companies’ plastic             were reported by ReSource Members, based on 2018
footprints and publicly report on the progress of their      data.1 The Tracker identifies four waste management
plastic waste commitments. Converging efforts will be        pathways for consumer-facing plastic packaging:
key to success, and we are working toward the goal of        recycled, landfilled, incinerated, or mismanaged.2 Based
aligning the ReSource: Plastic Footprint Tracker with the    on the results, we identify concrete calls to action for our
New Plastics Economy Global Commitment, and the              Members, as well as broader recommendations for the
Trash Free Seas Alliance.                                    private sector and other stakeholders to address global
                                                             plastic pollution.
The goal of the pilot year of the Footprint Tracker was to
establish a baseline of plastic use and management           The report frames these opportunities in the context of
pathways for our Members. Results from the first year        the three ReSource: Plastic goals: eliminating unnecessary
and continued tracking in future years will help illumi-     plastic, doubling global recycling and composting, and
nate key challenges, provide insight into the most           shifting to sustainable inputs for remaining plastic. Key
impactful opportunities for companies to take effective      calls to action for each goal are highlighted below.
action on the plastic waste crisis, and measure progress
over time.

ii
ELIMINATE UNNECESSARY PLASTICS:                                  – The US has been identified as a key opportunity
                                                                  to increase recycling and reduce landfill rates.
• Build on efforts to reduce and redesign small
  plastics, which include familiar single-use items like         – In particular, polypropylene recycling in the US is
  utensils, coffee stirrers, and straws. These are a              highlighted as a strong opportunity for increased
  significant category for three of the five ReSource             recycling. The US recycling rate for polypropylene is
  Members. Because small plastics are largely excluded            close to zero (0.6% in 2017), according to the EPA.
  from recycling streams, eliminating or finding substi-          The demand for quality recycled polypropylene far
  tutes for these materials should remain a key priority          exceeds supply, and collective action is needed to
  for these companies.                                            increase availability.3

• Explore reusable packaging systems and services              • Develop action plans that focus on the largest
  as an alternative for other high-volume, low-recyclability     country-level opportunities. In the analysis, the
  products like cups and utensils. To support the enabling       United States, Mexico, China, India, and the Philippines
  conditions for this innovation, these companies should         were identified as priority countries to foster systems
  focus on setting and reporting reusability targets at          improvements in waste management collections and
  the country level and collaborate with other companies         processing. Together, these countries represent 57.4%
  on localized solutions.                                        of ReSource Members’ landfilled plastics, and 58.7% of
                                                                 Members’ estimated mismanaged plastics. The United
DOUBLE GLOBAL RECYCLING RATE:                                    States represents the single biggest opportunity for
                                                                 recycling due to the high reported sales volumes of
• Scale recycled content availability and use through            these companies coupled with high landfill rate (72%).
  collective action.

                                                                                                                        iii
• Identify opportunities to increase recycling and                 • Improving data confidence and achieving more
     composting in specific geographies where waste                  comprehensive waste management information will
     management collection and infrastructure are                    allow us to more accurately model the pathways of
     currently insufficient, and report annually on progress.        plastic and design more effective interventions.
     Engage in collective action including policy dialogues
     and efforts to foster circular systems.                       There are some important considerations when inter-
                                                                   preting the findings of this report: First, the baseline
SHIFT TO SUSTAINABLE INPUTS FOR REMAINING                          results are not intended to represent global trends
PLASTIC                                                            across industries. They instead serve as proof of concept
                                                                   that a common framework for the measurement of
• Use recycled plastic for plastic packaging applica-              corporate plastic footprints and waste management
     tions: Increase use of recycled plastic, to address the       outcomes is both possible and a necessary tool for
     significant gap between current use and corporate             change. Second, due to the limited availability of detailed
     commitments. Use of recycled or sustainably sourced           data in several key geographies, it is not currently
     biobased content ranged from 0.4% to 11.3% across             possible to meaningfully distinguish between individual
     all five Members. These results call out a clear need to      company footprint waste management outcomes and
     accelerate the use of recycled content. This is indica-       national averages in several regions. Therefore, waste
     tive of the larger challenge around availability of           management outcomes are reported in the aggregate
     consistently high-quality recycled resin. Many companies      in this report, and not on an individual basis. Improving
     have set strong recycled content goals, but it can be a       this data detail and confidence is a high priority for
     challenge to make progress when price parity between          future reporting years, along with the incorporation of
     recycled and virgin content does not exist. Leaders are       import/export data.
     needed who commit to sourcing recycled plastic, even
     when the market price of recycled content may be              Additionally, this baseline assessment represents a
     above that of virgin plastic.                                 relatively small set of companies, which has resulted in
                                                                   limitations on what can be concluded from the pilot
• Increase use of sustainably sourced biobased                     results. While the set of companies represents five
     plastic: As with recycled content, the supply of              well-known global companies and respective leaders in
     sustainably sourced biobased plastic will need to             their industries, these companies are not necessarily
     increase in order to meet demand of company                   representative of their respective industries globally.
     commitments in upcoming years. However, this                  Therefore, the aggregate results only represent the five
     content must be sourced and managed responsibly at            companies based on their reported data and are not
     end-of-life to contribute effectively to a circular system.   necessarily representative of wider industry trends. As
                                                                   ReSource grows, we will work to enable broader use of
Finally, these calls to action will determine the progress         the ReSource Footprint Tracker so that the aggregated
on all the goals outlined above; their importance cannot           data produces more generalizable insights across
be overstated:                                                     industries.

• Filling critical data gaps and actively sharing                  ReSource: Plastic aims to enlist 100+ companies by 2030
     information will improve the quality and precision of         in the effort to reach the ultimate goal of preventing at
     our understanding of the plastic waste system. There          least 50 million metric tons of plastic waste from
     is a clear need for better waste management and fate          entering nature. The ReSource Footprint Tracker
     data at the national level, international coordination        provides a common measurement framework, and
     on plastic data collection efforts, and agreement on          through increased adoption of this tool, the highest-
     common terminology and best practices. Further-               impact measures can be identified. The baseline results
     more, standardization in corporate data collection and        of the ReSource Footprint Tracker provide the necessary
     reporting is also needed.                                     starting point for developing solutions whose impact will
                                                                   reverberate across supply chains and industries.

iv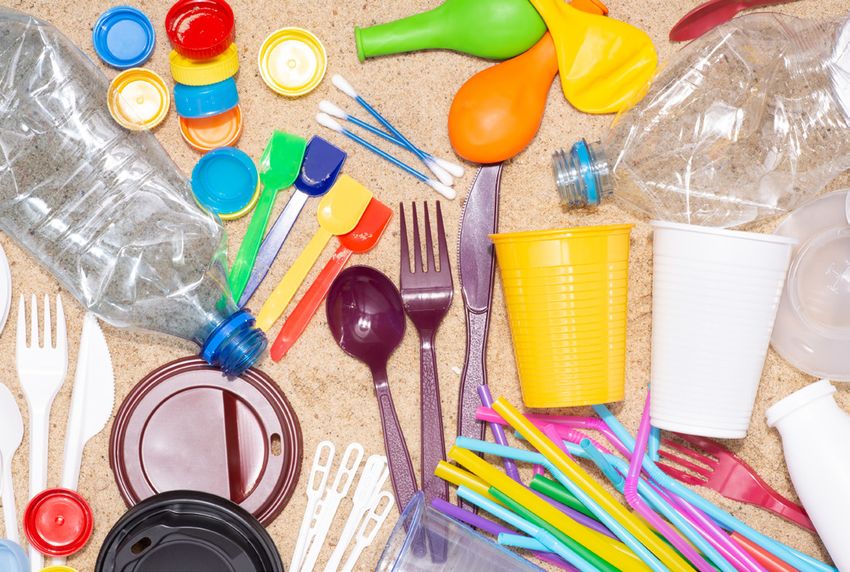
Contents
EXECUTIVE SUMMARY  .  .  .  .  .  .  .  .  .  .  .  .  .  .  .  .  .  .  .  .  .  .  .  .  .  .  .  .  .  .  .  .  .  .  .  . ii

ABOUT RESOURCE: PLASTIC .  .  .  .  .  .  .  .  .  .  .  .  .  .  .  .  .  .  .  .  .  .  .  .  .  .  .  .  .  .  .  .  .  . 2

      Vision . . . . . . . . . . . . . . . . . . . . . . . . . . . . . . . . . . . . . . . . . . . . . . . . . . . . . . 2

      An Activation Hub  . . . . . . . . . . . . . . . . . . . . . . . . . . . . . . . . . . . . . . . . . . . 4

      Participating Members . . . . . . . . . . . . . . . . . . . . . . . . . . . . . . . . . . . . . . . 5

      Program Partnership . . . . . . . . . . . . . . . . . . . . . . . . . . . . . . . . . . . . . . . . . 5

RESOURCE FOOTPRINT TRACKER RESULTS  .  .  .  .  .  .  .  .  .  .  .  .  .  .  .  .  .  . 6

      Methodology  . . . . . . . . . . . . . . . . . . . . . . . . . . . . . . . . . . . . . . . . . . . . . . . 7

      Interpreting the Baseline Assessment . . . . . . . . . . . . . . . . . . . . . . . . . 10

      Key Findings and Results  . . . . . . . . . . . . . . . . . . . . . . . . . . . . . . . . . . . . 10

      Member Case Studies  . . . . . . . . . . . . . . . . . . . . . . . . . . . . . . . . . . . . . . 20

RECOMMENDATIONS FOR ACTION  .  .  .  .  .  .  .  .  .  .  .  .  .  .  .  .  .  .  .  .  .  .  .  . 34

      Eliminating Unnecessary Plastic through Business Model
      Innovation, Reduction, and Substitution . . . . . . . . . . . . . . . . . . . . . . . 35

      Shifting to Sustainable Inputs for Remaining Plastic  . . . . . . . . . . . . 35

      Doubling Global Recycling and Composting of Plastic  . . . . . . . . . . . 36

      Other Opportunities  . . . . . . . . . . . . . . . . . . . . . . . . . . . . . . . . . . . . . . . . 37

      Thought Partner Insights  . . . . . . . . . . . . . . . . . . . . . . . . . . . . . . . . . . . . 39

MOVING FORWARD .  .  .  .  .  .  .  .  .  .  .  .  .  .  .  .  .  .  .  .  .  .  .  .  .  .  .  .  .  .  .  .  .  .  .  .  .  . 41

GLOSSARY .  .  .  .  .  .  .  .  .  .  .  .  .  .  .  .  .  .  .  .  .  .  .  .  .  .  .  .  .  .  .  .  .  .  .  .  .  .  .  .  .  .  .  .  .  . 42

APPENDIX .  .  .  .  .  .  .  .  .  .  .  .  .  .  .  .  .  .  .  .  .  .  .  .  .  .  .  .  .  .  .  .  .  .  .  .  .  .  .  .  .  .  .  .  .  . 44

                                                                                                                                                       1
About ReSource: Plastic

    Vision

    Every day, plastic is flowing into our natural environment at an unprecedented rate—a dump
    truck every minute into our oceans alone. In one year, this plastic waste adds up to 8 million
    metric tons and impacts over 800 species.4, 5 And as this crisis spreads to every corner of the
    globe, World Wildlife Fund (WWF) is leading the charge to unite our global networks of industry
    leaders, consumers, and policymakers to transform our systems toward a vision of No Plastic in
    Nature by 2030. Because while plastic can help make our hospitals safer, our food last longer,
    and our packages more efficient to ship, it has no place in nature.

    The role of business is critical to fixing the broken plastic system and accelerating progress.
    Businesses are uniquely positioned to reduce waste through improved sourcing, design, and
    business model innovation within their own supply chains, and by supporting recycling and
    composting system improvement efforts beyond their own supply chains.

2
FIGURE 1. Theory      of Change for ReSource: Plastic

   Fossil Virgin
     Plastic                                                                           Recycling

                                                                                                                Double
                                                                                                                global
                                                                                                               recovery
       Shift to
     sustainable
     sources for
       plastics
                                                               Reuse

                    Design                                                                    Outflow to

                                               X
                                                                                             Landfill and
                                     Use                                                     Incineration

                 Reduce                                                    Eliminate
               unnecessary
                 plastics                                  Leakage
                                                                             plastic
                                                                           pollution

Through this lens, we find that as few as 100 companies              have entered this space through large-scale commit-
have the potential to prevent roughly 10 million metric              ments, there hasn’t been a comprehensive, standardized
tons of the world’s plastic waste per year.6 Some of the             methodology to track plastic usage and waste manage-
world’s biggest companies have already gotten started                ment outcomes, leaving companies without the ability
with large-scale plastic commitments to reduce, re-source,           to measure the impact and track the progress of their
recycle, and more. The New Plastics Economy Global                   actions. ReSource’s measurement framework, the
Commitment, led by the Ellen MacArthur Foundation                    ReSource Footprint Tracker, is designed to fill this critical
and UNEP, has been a foundational mechanism to set a                 gap by providing a common framework for the measure-
common vision and commitment, and track progress.                    ment of corporate plastic footprints and waste manage-
                                                                     ment outcomes.
Continued action and an amplification of efforts in line
with this vision are needed to follow through on those               Through our ReSource: Plastic activation hub, we’re
commitments and achieve impact on plastic pollution                  helping some of the world’s leading companies translate
at scale.                                                            ambitious plastic commitments into systemic, measur-
                                                                     able change across their business operations, and well
Effective action to stop plastic pollution requires an               beyond their supply chains.
understanding of how corporate plastic footprints
contribute to the issue at large. However, as companies

                                                                                                                                 3
An Activation Hub                                               reach a goal of preventing 50 million metric tons of
                                                                plastic pollution from entering our oceans and other
ReSource: Plastic is WWF’s activation hub for companies         ecosystems by 2030.
that are ready to translate plastic commitments to
meaningful action but need help building a roadmap to           To get there, ReSource is working with its Member
get there. We close that “how” gap through an innovative        companies to:
measurement framework that tracks corporate action
against ReSource’s three-pronged approach to leveraging         MEASURE IMPACT of corporate plastic activities within
business as a catalyst for systems change:                      an innovative measurement framework, the ReSource
                                                                Footprint Tracker, and provide an unprecedented view
• Eliminating unnecessary plastic through business              into company footprints within the global plastic system.
    model innovation, reduction, and substitution
                                                                MAXIMIZE IMPACT by tracking implementation and
• For plastic that is necessary, shifting from virgin plastic   progress of these activities through the ReSource
    sourcing to sustainable inputs, including recycled          Footprint Tracker to identify what interventions to
    content,7 sustainably sourced biobased content,             reduce waste should be prioritized, scaled, or improved
    and advanced materials    8                                 upon.

• Doubling global collection, recycling, and composting         MULTIPLY IMPACT by uniting companies within a
    of plastic so that the plastic going into the system is     common plastic sustainability language that enables
    circulated back                                             collaboration with other companies and stakeholders,
                                                                bringing speed and scale to critical solutions and
ReSource launched in 2019 with a goal of tracking the           investments toward systems change.
progress of corporate action year over year to ultimately

4
Participating Members Program Partnership
ReSource was launched in May 2019 with five companies THOUGHT PARTNERS
that have demonstrated ambition and sector leadership
on plastic waste to serve as Principal Members: Keurig Our Thought Partners, The Ellen MacArthur Foundation
Dr Pepper, McDonald’s, Procter & Gamble, Starbucks, and Ocean Conservancy, are leaders in the global effort
and The Coca-Cola Company. As members of ReSource, to stop plastic pollution and strengthen the conserva-
the companies are committed to tracking and reporting tion-driven objectives of ReSource. They have helped
on their plastic footprint annually as well as taking guide the strategy of ReSource: Plastic, and their expertise
recommended actions to advance ReSource’s goals, and will continue to inform the work of ReSource in upcoming
importantly, pursuing collaborative efforts with other years. Furthermore, ReSource: Plastic aims to build on
companies and stakeholders to address and scale and align with their programs and tools, notably the
critical interventions in waste management. Trash Free Seas Alliance, led by Ocean Conservancy, and
The New Plastics Economy Global Commitment, led by
These companies piloted the ReSource Footprint Tracker the Ellen MacArthur Foundation and UNEP.
in its first year, and their results in this report serve as a
baseline assessment to measure progress annually
moving forward.
IMPLEMENTATION PARTNERS
Implementation Partners are organizations that are
employing ReSource and/or amplifying our efforts to
bring impactful solutions to scale. The American
Beverage Association (ABA) became an Implementation
Partner in 2019 to align measurement methods and
programmatic expertise with its Every Bottle Back
initiative, focused on increasing PET recycling in the
United States. This collaboration will contribute to
ReSource’s overarching goals of eliminating plastic
pollution and increasing circularity.
OTHER COLLABORATORS
ReSource is also collaborating to identify mitigation
opportunities and align our Footprint Tracker methodol-
ogy with current best practices. We acknowledge and
appreciate the contributions that The Recycling Partner-
ship, Circulate Capital, and the Plastic Leak Project put
into the design of the ReSource Footprint Tracker.
5ReSource Footprint Tracker
Results
Transparent 2020 is the first of what will be an annual series of reports that detail Members’
plastic footprints and track progress on corporate actions. This inaugural publication follows the
pilot year of the ReSource Footprint Tracker methodology and demonstrates proof of concept
for a common framework to measure effective corporate action on plastic. This baseline will
serve as a starting point to track the progress of ReSource: Plastic and related activities over time
and enables key recommendations for action, both internal to company supply chains and
across wider multi-stakeholder efforts.
The baseline assessment also offers insights into what immediate, collective, and other action-
able interventions can be taken to improve footprint results in the years ahead (see: “Recom-
mendations” section of report, below).
6Methodology on reducing plastic pollution beyond their own supply
chain, as well as any measured impacts to date
The ReSource Footprint Tracker is the mechanism that
enables ReSource Member companies to measure, The goals of implementing a pilot of the ReSource
maximize, and multiply the impact of their actions on Footprint Tracker included demonstrating the feasibility
plastic. The methodology provides insight into how much of the methodology, establishing a baseline against
and what type of plastic companies use, and where it goes which progress will be measured in future years, and
once it is disposed of (the waste management outcome). raising the bar for transparency and accountability for all
companies to follow.
The big-picture view is designed to elicit data-driven
actions aligned to ReSource’s theory of change: eliminating DATA ASSUMPTIONS AND LIMITATIONS
unnecessary plastic, shifting to sustainable inputs for
remaining plastic, and doubling global recycling and The ReSource Footprint Tracker relies on companies
composting. providing accurate data. WWF works with Member
companies to identify inconsistencies and fill data gaps,
As such, the ReSource Footprint Tracker measures the but the data submitted by companies for this report was
following variables for each company: the amount of not verified or audited by a third party.
plastic used and sold by the company, polymer type and
form, the source of the material, and where it goes upon As ReSource was developed to convene the disparate
disposal—whether it circulates back into the system or variables that contribute to the global plastic waste
becomes a wasted resource (waste management problem into a single framework, there were inevitable
outcome). challenges in the data collection process during this pilot
year of the methodology. Companies have had very
Additional information about each component of the different systems for tracking plastic throughout their
Footprint Tracker, including survey structure, data supply chains, and global data on plastic waste manage-
sources, assumptions, and limitations can be found in ment is not consistently collected.
the appendix. A complete methodology document is
under development and is scheduled for publication in There were three main constraints:
September 2020.
FIRST, secondary packaging and transport packaging are
PILOT & IMPLEMENTATION not currently included in the data reported by companies.9
The pilot version of the ReSource Footprint Tracker SECOND, some Member companies were not able to
consists of three components: access packaging data for every country they operate in,
so in some cases the country-level data was generated
• A survey tool that companies fill out with information by extrapolating local sales or store count. For these
on the plastics they use and sell, which provides reasons, the reporting scope does vary somewhat
summary outputs related to the composition of their between Members, and detailed information about what
portfolio is included is provided in each company’s case study.
• A plastic waste management model that uses the THIRD, there is limited availability of waste management
survey data as an input, and estimates the share of data for plastics globally, especially data on how the
plastic that is recycled, landfilled, incinerated, and performance of waste management varies across
mismanaged based on country-level waste manage- different packaging forms and polymers. As a result,
ment data and the polymer and format of the item proxy data and assumptions have been used to fill data
gaps, as necessary. It is also important to acknowledge
• A Beyond Supply Chain survey where companies are the lack of information on composting infrastructure
asked to provide detailed information about any globally today, and therefore the lack of available data on
projects or investments they are involved in focused composting rates.
7FIGURE 2. ReSource Members’ aggregate reported plastic volumes by country.
Plastic Volumes (MT)
≥ 519,420
188,142 – 519,419
89,349 – 188,141
26,454 – 89,318
≤ 26,453
Canada Canada
Portu
United States United States
M
Bermuda Bermuda
Mexico Mexico Bahamas Bahamas Western
Haiti Turks and CaicosCuba Islands Haiti Turks and Caicos Islands Sahara
Cuba
Dominican Republic Dominican Republic
Jamaica Puerto Rico Jamaica Puerto Rico
Belize Belize
Saint Kitts and Nevis Cabo Verde
Saint Kitts and Nevis Maurit
Honduras Guadeloupe Honduras
Martinique Guadeloupe Martinique Senegal
Curaçao Saint Lucia Curaçao Saint Lucia The Gambia
Guatamala Nicaragua
Guatamala Nicaragua
Aruba Saint Vincent Aruba Saint Vincent
El Salvador El Salvador Barbados Barbados Guine
Trinidad and Tobago Trinidad and TobagoGuinea-
Costa Rica Costa Rica
Venezuela Guyana Venezuela Guyana
Suriname Suriname Bissau
Panama Panama French Guiana French GuianaSierra Libe
Colombia Colombia Leone
Co
d’Ivo
Ecuador Ecuador
Peru Peru
Brazil Brazil
Samoa Samoa
French Polynesia French Polynesia
Fiji Fiji Bolivia Bolivia
New Caledonia New Caledonia Paraguay Paraguay
Australia Australia Chile Chile
Argentina Argentina
New Zealand New Zealand Uruguay Uruguay
8Norway Russian Federation Russian Federation
Finland Norway Finland
Sweden Sweden
United Estonia
United Estonia
Kingdom Denmark Latvia
Kingdom Latvia
Lithuania Denmark Lithuania
Netherlands Netherlands
Ireland Belgium Poland
Ireland Belarus
Belgium Poland Belarus
Germany Germany
Luxembourg Czechia Luxembourg
Ukraine Czechia Ukraine
Slovakia Slovakia
France Austria Hungary France Moldova Austria Hungary Moldova Kazakhstan Kazakhstan
Switzerland Serbia Mongolia Mongolia
Monaco Slovinia RomaniaSwitzerland
Monaco Serbia Romania
Andora Bosnia & Croatia Andora Slovinia
Bulgaria Bosnia & Croatia
Georgia Bulgaria Uzbekistan
Georgia Uzbekistan
Herzegovinia Montenegro
Albania KosovoHerzegovinia Montenegro
Kyrgystan Rep. Kyrgystan Rep.
Albania Azerbaijan
Kosovo Azerbaijan
ugal Spain Italy
Portugal Macedonia ItalyArmeniaMacedonia Armenia
Spain
Greece Turkey Turkmenistan
Turkey Tajikistan Turkmenistan Tajikistan
Greece South South
Syria Syria Japan Japan
Malta Cypress Malta Cypress China Korea Korea
Tunisia Tunisia
Lebanon China
Iraq Iran Lebanon Afghanistan Iran Afghanistan
Morocco Morocco West Bank & Gaza Israel West Bank & Gaza Israel Iraq
Jordan Kuwait Jordan Kuwait
Algeria Qatar Bahrain Pakistan Qatar BahrainNepal Bhutan Nepal Bhutan
Libya Algeria Libya Pakistan
Egypt Saudi EgyptUnited Arab United Arab
Western Saudi
Sahara Arabia Emerites Arabia Emerites Bangladesh Bangladesh
India India Taiwan Taiwan
Myanmar Myanmar
Lao P.D.R. Lao P.D.R.
tania Cabo Verde Mauritania
Niger Oman Oman
Mali Mali Niger
Chad Eritrea Chad Eritrea Thailand Philippines Vietnam
Senegal Rep. of Yemen Rep. of Yemen Vietnam Thailand Philippines
The Gambia Sudan Sudan
Burkina Faso Burkina Faso Cambodia Cambodia
ea Djibouti Djibouti
Benin Guinea Benin
Guinea-
Nigeria
Ghana Central Nigeria Brunei Brunei
Bissau Ghana South EthiopiaCentral South Ethiopia
African Rep. African Rep. Darussalam Darussalam
eria Togo SierraCameroon
Liberia Sudan Sudan Malaysia
Togo Cameroon Malaysia
Leone Uganda Somalia Uganda Somalia
otes Equitoral Guinea Cotes Equitoral Guinea Singapore Singapore
Maldives Maldives
oire d’IvoireCongo Rwanda
Kenya
Congo Kenya
Indonesia
Papua New Guinea Papua New
Gabon Gabon Rwanda Indonesia
Dem. Rep. Dem. Rep. Seychelles Seychelles
of Congo Burundi Burundi
of Congo
Tanzania Tanzania
Comoros Comoros
Malawi Malawi
Angola Zambia AngolaMayotteZambia Mayotte
Eswatini Eswatini
Mozambique Réunion
Mozambique Réunion
Zimbabwe Zimbabwe Mauritius Mauritius
Namibia Botswana Namibia Madagascar
Botswana Madagascar
Australia New Caledonia
Australia
Lesotho Lesotho
South Africa South Africa
New Zealand
9These constraints demonstrate the need for collaboration Key Findings and Results
to fill key data gaps and improve data confidence levels,
and such efforts will be a priority for platform refinements The Footprint Tracker includes analysis of product form
to ReSource moving forward. These efforts will include and polymer composition, sustainable inputs to plastic,
targeted research and reporting to improve plastic waste and waste management pathways for plastic after it is
management data. Additionally, Members are working to disposed. Data on Members’ plastics product form and
improve their internal data gathering processes and polymer composition helps identify opportunities to
expand the reporting scope for coming years. substitute, reduce, or redesign plastics that have low
recyclability rates, thus reducing unnecessary plastic.
Information on sustainable material inputs allows for
Interpreting the Baseline Assessment year-to-year tracking on Members’ conversion to these
inputs, clarifying the largest opportunities for increasing
When reviewing the findings of the baseline assessment,
recycled and biobased content. Calculating estimated
please consider the data limitations and assump-
waste management pathways illuminates top-priority
tions as outlined in the previous section. Due to the
regions and countries to invest in increased recycling
limited availability of detailed data in several key geogra-
and waste processing systems.
phies, it is not possible at this time to meaningfully
distinguish between individual company footprint waste
COMPANY PORTFOLIO AND CONTEXT
management outcomes and national averages in several
regions. Therefore, waste management outcomes are
In this pilot year, ReSource Members reported a total of
reported in the aggregate in this report, and not on an
4.2 million metric tons (MT) of plastic, primarily based on
individual basis.
2018 data. Geyer, Jambeck, and Law estimate global
annual plastic generation at 302 million MT in 2015—
Additionally, this baseline assessment represents a
141 million MT of which is from packaging.11, 12 Taking
relatively small set of companies, which has resulted in
just the packaging figure for 2015, ReSource Members’
limitations on what can be concluded from the pilot
contribution to annual global plastic use is approxi-
results. While the set of companies represent five
mately 3%. It should also be noted that The Coca-Cola
well-known global companies and respective leaders in
Company’s reported volumes account for a significant
their industries, these companies are not necessarily
portion of the total reported volume, which can skew
representative of their respective industries globally. For
averages. Therefore, alternate analysis is presented
example, The Coca-Cola Company and Keurig Dr Pepper
where appropriate. Waste management outcomes for
represent about 16% market share of the non-alcoholic
Members’ plastic footprints are primarily determined by
beverage sector based on their sales; P&G represents
in-country management rates and country-specific
about 11% of the global fabric and home care industry;
reported plastic volumes and forms. Thus, understand-
and McDonald’s represents 19% and Starbucks rep-
ing the geographic distribution of reported plastic
resents 11% market share of the restaurant industry.10
volumes is an important consideration when interpreting
Therefore, the aggregate results only represent the five the management pathways results (Figure 2).
companies based on their reported data and are not
Results are reported in relation to ReSource’s three goals:
necessarily representative of wider industry trends. For
1. eliminate unnecessary plastic, 2. shift to sustainable
example, the geographies and specific opportunities
inputs for remaining plastic, and 3. double global
identified as priority largely reflect the geographical and
recycling and composting of plastic. All percentages are
portfolio distributions of the Members, and therefore do
by weight of plastic. Portfolios differed significantly
not entirely match global trends. As ReSource grows, we
across ReSource Members, which can significantly
will work to enable broader use of the ReSource Foot-
influence the average results presented below. Key
print Tracker so that the aggregated data produces
observations from the aggregate results include:
more generalizable insights across industries.
• PET bottles are a significant proportion of the plastic
footprint for three of the five Member companies,
10FIGURE 3. Polymer breakdown by form category for ReSource Members’ aggregate portfolio.
n Polyvinyl chloride (PVC) nP
olyethylene n Polycarbonate (PC) nL
ow-density
Terephthalate Glycol n Other polyethylene (LDPE)
n Polystyrene (PS)
(PETG)
n Nylon nH
igh-density
n Polypropylene (PP)
nP
olyethylene polyethylene (HDPE)
n Polylactic acid (PLA) terephthalate (PET) nL
inear low-density
polyethylene (LLDPE)
100%
PS PS
90% PP Other
PS
80%
PP
70%
60% PET
PS
50%
PET LDPE LDPE PP
40%
30%
HDPE PETG
20%
10% PET
HDPE
0
Bottle Closure Mono-material Other Other Rigid Rigid Foam Small Plastics
Film Flexible
ranging from 31% to 91% of the reported usage for • Lastly, small plastics,15 which are defined as being
these three companies. smaller than 2 inches in two dimensions,16 account for
less than 1% of the aggregate plastic footprint.
• Flexible plastic comprises 7% of the aggregate However, the range of reported volumes reported
reported usage, ranging from 1% to 34% across among Members is significant, with some Members
Member companies. LDPE is used in 77% of Members’ reporting up to 16% of their reported volumes coming
flexible plastic. In the United States, the recycling rate from small plastics. These small plastics require testing
for flexible plastic is 1%.13 to be considered recyclable, as small plastics are often
not incorporated into the recycling stream because of
• Other rigids (e.g., cups, containers) account for 6% of their size, as they fall between the belts and gears of
the aggregate plastic footprint and range from 0% to recycling machinery.17 Sixty-nine percent of small
51% of Members’ total reported usage. Polypropylene plastics included in this analysis are composed of PP.
(PP) accounts for 55% of other rigids in the results.
PRODUCT FORM AND POLYMER COMPOSITION
• PP accounts for 8% of the aggregate portfolio.
According to the Environmental Protection Agency’s The Footprint Tracker includes an analysis of product
2017 estimates, the polypropylene recycling rate in form and polymer composition (Figure 3). Understanding
the US is less than 1% for all post consumer PP, and the distribution of forms and polymers used by
8% for PP used in food service packaging.14 The Members can help inform mitigation actions including
opportunity to increase PP recycling in the US, as well opportunities to redesign, substitute material types, and
as the use of recycled PP in corporate supply chains, is adopt innovative business models to eliminate unneces-
identified as a key action area. sary plastic. These decisions are complex and often
11FIGURE 4. B
reakdown of recycled, biobased, and virgin content for ReSource Members’
aggregate portfolio.
Sustainable Biobased Content 1% Other Biobased Content .04%
Recycled Content 8%
Virgin Content 91%
involve trade-offs. For example, consolidating polymer and other innovations that would eliminate the need for
types and formats has the potential to support higher a single-use plastic item or package have been identified
recycling and composting rates by simplifying collection by several of the Members as key strategies to be
and aggregation,18 but which polymers or formats should implemented in coming years.
be changed and to what alternative? Another route to
eliminating unnecessary plastics is to redesign the Results suggest that opportunities to eliminate unneces-
product form to reduce likelihood of landfill or misman- sary plastic vary by company portfolio. For example,
agement. Without a collective plan, this exercise could while PP is a priority for some Members, comprising
result in a proliferation of materials and formats instead 8% of the total plastic footprint, 2% of The Coca-Cola
of a consolidation. Understanding the breakdown of Company’s and 54% of McDonald’s portfolio comprises
applications and formats across industries is the first PP. Further, flexibles, which are mostly not currently
step in working toward the reality of eliminating unnec- recycled, vary across Members’ portfolio from 1% to 34%.
essary plastic.
USE OF SUSTAINABLE INPUTS
For example, some items falling into the small plastics
category could be substituted for another material, while After taking action to eliminate what is unnecessary,
others could be eliminated through redesign or shifting shifting to sustainable inputs for remaining plastic can
of business models to reuse or other innovative systems. improve environmental performance. Sustainable inputs
However, some small plastics are integrative to the include recycled content or responsibly sourced
application of the product, and the opportunity for some biobased content19 and other advanced materials in the
specific formats lies in enabling and increasing recycling. future. Sustainable inputs for plastics represent between
0.4% and 11.3% of total plastic use across the Member
The prevalence of reusable systems is currently low, companies. Recycled content is the most prevalent
accounting for only a small portion of the Members’ sustainable input and accounts for 8% of the aggregate
reported volumes. It should be noted that non-plastic reported volume (Figure 4). Recycled content is primarily
reusable and refillable packaging can exist in company used in bottles, followed by small plastics and other
portfolios. This report focuses exclusively on plastic rigids (e.g., cups, containers). Responsibly sourced
packaging and not on overall packaging portfolios. Reuse biobased content represents 1% of input materials and
12is exclusively used in bottles. Other types of biobased
content, such as in the polymer polylactic acid (PLA), are
FIGURE 5. Estimated waste management
only used in 0.04% of the portfolio and are used in other
rigids, closures, and small plastics.
outcomes for ReSource Members’
aggregate plastic footprint, compared
to the Ellen MacArthur Foundation
WASTE MANAGEMENT PATHWAYS
global plastic flow estimates, including
The waste management pathways are based on in-country material collected for recycling.22
management rates and Members’ respective plastic
footprints in a given country. The estimated recycling n Recycling n Incineration n Landfill n Mismanaged
rate of ReSource’s Principal Members’ aggregate plastic
footprint (19%) is higher than the global estimate of
plastic collected for recycling (14%) reported by the Ellen 28% 37%
MacArthur Foundation (Figure 5). As the plastic manage-
20
ment outcomes are estimated based on country-level
reported plastic volumes and country-specific waste 42%
management (Table 1), the ReSource Principal Members’
38%
high landfill rates compared to the global estimate can
primarily be explained by high landfill estimates in the
11%
United States (72%), the country where all of the 8%
ReSource Principal Members sell their highest reported 19% 14%
volumes of plastics. This concentration in the United
States and the dominance of PET bottles can also Resource Global
explain the comparably high recycling rates—the United Members Average
States has a PET bottle recycling rate of 29%, compared
to its all-plastics recycling rate of 8.4%.21
TABLE 1. E
stimated waste management breakdown by region for ReSource Members’
aggregate plastic footprint.23,24,25
REGION RECYCLING INCINERATION LANDFILL MISMANAGED
RATE RATE RATE RATE
Africa 6% 0% 26% 68%
East Asia 12% 24% 11% 53%
Europe & Central Asia 41% 18% 29% 12%
Latin America & Caribbean 21% 0% 63% 16%
Middle East 4% 0% 76% 21%
North America 20% 15% 63% 2%
Oceania 13% 1% 79% 7%
South Asia 7% 0% 5% 88%
Southeast Asia 8% 4% 14% 74%
13FIGURE 6. W
aste management outcomes for rigid versus flexible plastics for
ReSource Members.
n Recycling n Incineration n Landfill n Mismanaged
Metric Tons
41%
1,600,000
28%
1,200,000
21%
800,000
11%
400,000
55%
2% 21% 22%
0
Rigid Plastic Flexible Plastic
FIGURE 7. Estimated waste management outcomes by region for ReSource Members.
n Recycling n Incineration n Landfill n Mismanaged
Metric Tons
1,200,000
1,000,000
80,000
60,000
40,000
20,000
0
North Latin East Europe & Africa South Southeast Middle Oceania
America America Asia Central Asia Asia East
& Caribbean Asia
14Waste management pathways were further calculated low tonnage in those regions (5.8%, 5.5%, and 4.2% of
with the distinction between rigids and flexible plastics the global plastic footprint, respectively). Finally, the
(Figure 6). Overall, the share of rigid plastic that is Europe and Central Asia region has the fourth largest
mismanaged (28%) is higher than that of flexibles (22%) plastic footprint in terms of tonnage, but also has the
for ReSource Members. This is due to the high use of highest recycling rate at 36%, which translates to a
rigid plastics in regions with high mismanagement rates, decrease in landfilled and mismanaged plastics. The
specifically in East and South Asia. The differences in landfill rate for Europe and Central Asia is their second
recycling rates between rigids (21%) and flexibles (2%) is highest estimated waste management pathway, at 35%.
indicative of European trends. Flexibles are also
26
landfilled at higher rates than rigids (55% for flexibles; Country Spotlights
41% for rigids). A limitation of the current model is that
mismanaged rate estimates between rigids and flexibles As waste management is determined by the recycling
do not differ, which does not reflect known trends that and composting collection infrastructure available in a
flexibles are mismanaged at higher rates than rigids. This given country, the Tracker results help identify opportu-
is discussed in more detail in the Methodology section in nities in key geographies to reduce mismanaged plastics
the appendix, and we hope to implement improvements and promote collection and recycling. Examining the five
in the next version of the model to address this. countries where Members had the highest volumes for
recycling, incineration, landfill, and mismanagement can
Regional Breakdown help prioritize geographies for mitigation and interven-
tion (Figure 8). We provide general estimates in aggre-
The likely waste management pathways for plastics by gate for all Members, and we also consider the top five
region are aggregated based on ReSource Members’ countries for each Member, as data can be skewed by
reported plastic volumes by country within set regions Members with higher overall reported plastic volumes.
(Figure 7 and outlined in the appendix). These regional Because we are looking at volumes, the countries
waste management estimates are dependent on the identified as having high opportunity for intervention will
geographical distribution of sales and proportions of be heavily influenced by where Members reported the
various plastic forms within the ReSource aggregate largest sales volumes. These countries may differ
plastic footprint and thus are not meant to be represen- significantly from the countries with the highest recy-
tative of the end-life of plastics across all sectors. cling, incineration, landfill, or mismanagement rates in
the global waste management model. For instance,
Regionally, ReSource Members’ aggregate plastic foot- based on estimates from Jambeck et al.,27 China and
print is concentrated in North America, with lesser but India have mismanagement rates of 76% and 87%,
still significant concentrations in Latin America and the respectively. However, Members reported significantly
Caribbean (where landfill rates are also comparatively higher volumes in China, leading China to have a higher
high), East Asia (where mismanaged rates are high), and estimated volume of mismanaged waste in this analysis.
Europe and Central Asia (where recycling rates are
highest globally) (Figure 7). The high landfill rates and For total reported volume of plastic recycled, the United
high reported tonnage volumes in North America (63% States is the top country by tonnage for all Members.
of regional tonnage) and Latin America (63% of regional The United Kingdom, Germany, and Japan are also in the
tonnage) contribute to the higher aggregate landfill rate top five countries for estimated recycled plastic volumes
of ReSource Members (42%), compared to the global for three of the five Principal Members. For incinerated
estimate of 38% (Figure 5). Further, although East Asia is plastic, the US, Japan, Germany, and China are consis-
third in terms of total tonnage, the high mismanagement tently within the top five countries across the Members.
rate (53%) and the large footprint in China, where For landfilled plastic, the United States is the top country
mismanaged rates are 76%, contribute to the region in terms of estimated volume of landfilled plastic for all
having the highest total tonnage of estimated misman- Members, with Mexico also frequently showing up in the
aged plastics. Africa, South Asia, and Southeast Asia also top five. China, Brazil, the United Kingdom, and Canada
all have high mismanagement rates (68%, 88%, 74%, are also within the top five for landfilled plastics across
respectively), but ReSource Members’ have comparatively at least two Members. Lastly, for mismanaged plastic,
15FIGURE 8. R
eSource Members’ countries by total estimated volume (top five) for each waste
management outcome.
Countries by total volume recycled (top 5) Countries by total volume incinerated (top 5)
250,000 180,000
200,000 160,000
140,000
150,000 120,000
100,000 100,000
80,000
50,000 60,000
0 40,000
United Mexico Germany United Brazil 20,000
States Kingdom 0
United Japan Germany China South
States Korea
Metric Tons
Countries by total volume landfilled (top 5) Countries by total volume mismanaged (top 5)
80,000 450,000
400,000
60,000 350,000
300,000
40,000 250,000
200,000
20,000 150,000
100,000
0 50,000
United Mexico Brazil China Turkey 0
States China India Philippines Mexico Pakistan
China is the top country by volume for all Members who The United States
operate in the country, typically followed by the US, the
Philippines, Indonesia, India, and Thailand, which are The United States represents the highest reported
also seen in the top five across the Members’ plastic volume of plastic use for each of the five Principal
footprints. The Philippines is within the top five countries Members. It also has the highest estimated volumes of
for mismanaged plastic for all Members who operate in landfilled plastic, as landfill rates for all plastics in the US
the country due to its high estimated mismanagement are 72% (71% and 78% for rigids and flexibles, respec-
rate (83%). tively). However, as the management pathways of
ReSource Members’ plastic footprints are also dependent
Waste management context varies significantly across on the form types and polymers used, the estimated
countries due to variations in local collection and landfill rate for the ReSource Members’ portfolio is
recycling systems and waste processing infrastructure. 41%—lower than the US average. This is largely due to
Deeper dives into identified priority countries enable a the high concentration of PET bottles in the Members’
more nuanced understanding of potential interventions, aggregate plastic footprint, and the in-country recycling
specifically to address landfilled and mismanaged rate of 29% for bottles, compared to a recycling rate of
plastics. Priority countries identified in the analysis are 9% for all plastics. Regardless, the high landfill rates and
United States, Mexico, China, India, and the Philippines. the high overall tonnage within the United States result
Together, these countries represent 57.4% of ReSource in 17% of all ReSource Members’ plastics ending up in US
Members’ landfilled plastics, and 58.7% of Members’ landfills—the highest estimated end-life destination
estimated mismanaged plastics. across all countries and management outcomes. The US
16also has the highest tonnage of recycled plastics (5.2% of management estimates. This is because of the high
all reported plastics) and is within the top two countries proportion of rigids to flexibles in the Members’
for incinerated plastics (4.0% of all reported plastics) portfolios.
across the Members. Further, although the US misman-
agement rate for all plastics is only 2%, the sheer Over 5% of ReSource Members’ aggregate plastic
volumes of plastics sold there means that it is in the top footprint by reported volume is estimated to end up in
five countries by estimated volume of mismanaged Mexico’s landfills, and Mexico is also within the top five
plastic for four of the five Principal Members. Reported countries for recycled and mismanaged plastic in the
waste management data for the US is generally of high aggregate data. In Mexico, there are many areas where
quality due to statutory reporting responsibilities. informal recyclers are responsible for large proportions
of the recycling undertaken.28 There is also a heavy
reliance on landfilling of waste via both informal and
Mexico sanitary landfills.29
Mexico, while only within the top five countries by
reported volume for two of the five Members, is within China
the top five for landfilled plastic for four of the five
Members. This is largely attributed to its high all-plastics While the United States has the highest total tonnage,
landfill rate of 71%. However, the management pathways China is the country with highest tonnage of misman-
of ReSource Members’ plastic footprint in Mexico are aged plastics across all the Members who operate in the
more closely aligned with the estimated management country due to its high estimated mismanagement rates.
rates of rigids in Mexico (21% recycled, 0% incinerated, Due to limitations of the model in differentiating waste
64% landfilled, 14% mismanaged) than the all-plastics management outcomes for different packaging types in
17China, the management outcomes of ReSource Members’ The Philippines
plastic footprint in China closely match the overall
estimated management rates for all plastics in the As in Mexico, total plastic tonnage in the Philippines is
country. not considerable compared with other countries (1.5%
of the total plastic footprint); however, the high misman-
With high mismanaged rates and a high total tonnage, aged rate of 83% places the Philippines in the top
China is considered a priority country for mitigating countries for absolute mismanaged tonnage for all the
mismanagement risk. In China, recycling economies companies that operate in this country; it is almost
traditionally relied on large amounts of international always second to China in terms of potential misman-
plastics for recycling, while domestically, there was still a agement. Due to limitations of the model in differentiat-
focus on developing collection systems and relying on ing waste management outcomes for different packaging
landfills. It should be noted that over the past decade, types in the Philippines, the management outcomes of
China has had several campaigns to restrict imports of ReSource Members’ plastic footprint in the Philippines
plastics, specifically through the Green Fence and closely match the general estimates for all plastics in the
National Sword campaigns in 2013 and 2018, respec- country. The Philippines’ geography as an island nation
tively. From 2018 to 2019, Chinese plastic imports fell by with short pathways to the ocean contributes to its high
99%, according to some experts.30 However, restricting estimated mismanagement rate, and international
plastic imports has been beneficial in making domestic policies have driven change in recent years. In the
recycling more valuable and a higher priority. Since early Philippines, recycling economies providing infrastructure
2019, over 40 cities in China have piloted waste sorting for global plastics supply and waste imports have nearly
programs for waste and plastics.31 The Tracker does not tripled from 2016 to 2018 due to the reallocation of
incorporate waste imported into China, and China waste restricted waste exports to China.32 Domestically, there
management estimates are based primarily on data is still a high reliance on landfilling of waste with limited
from 2015, and thus do not reflect potential improve- source separation of recyclables.33,34
ments in domestic recycling over that time period. While
this is true in several cases, it is notable for China in
particular due to its priority and the recent changes to India
its waste management and recycling systems driven by
the discussed policies. India is second to China in terms of aggregate estimated
volume of mismanaged plastics but is only in the top five
countries for mismanagement for two Members. India’s
mismanagement rate of 87% is the highest among
priority countries and is among the highest overall. In
India, recycling economies have previously provided
infrastructure for global plastics supply, but plastic
import bans in March 2019 have mirrored China’s
approach—using import bans in March 2019 have
mirrored China’s rationale for import restrictions as an
opportunity to invest in domestic waste management
infrastructure.35 Domestically, there is still a high reliance
on landfilling of waste, with limited source separation of
recyclables.36
18You can also read