Strategies to Improve Point-In-Time (PIT) Counts of Unsheltered Homelessness
←
→
Page content transcription
If your browser does not render page correctly, please read the page content below
Strategies to Improve Point-In-Time (PIT) Counts of
                Unsheltered Homelessness
An Evaluation of Hennepin County’s Current Approach and Summary of Lessons
                     Learned from Other Communities

                      Humphrey School Capstone Report

                   The Hubert H. Humphrey School of Public Affairs,
                              University of Minnesota

                                  Susan Bergmann
                                    Rowan Hilty
                                   Ashley Hirilall
                                    Lauren Kraft

                     PA 8081 Capstone Workshop Social Policy
                   Instructor: Maria Hanratty, Associate Professor

                                    Spring, 2021

                                  Hennepin County
Table of Contents
Executive Summary ...................................................................................................................................................................... 3
Introduction ..................................................................................................................................................................................... 4
Background on the PIT count .............................................................................................................................................. 4
Project Overview ..................................................................................................................................................................... 4
Structure of this Report ......................................................................................................................................................... 5
Background on the Hennepin County Continuum of Care .......................................................................................... 6
Organizational Structure ...................................................................................................................................................... 6
PIT Count Process.................................................................................................................................................................... 7
Findings.............................................................................................................................................................................................. 8
Innovative PIT Count Methods .......................................................................................................................................... 8
PIT Count Process & Coordination ................................................................................................................................ 12
Recommendations...................................................................................................................................................................... 21
Innovative Methodologies................................................................................................................................................. 21
Streamlined & Coordinated Processes......................................................................................................................... 24
Conclusion................................................................................................................................................................................ 30
Appendix A: Organizations Participating in Interviews ........................................................................................ 31
Appendix B. HUD Sampling Guidance .......................................................................................................................... 32
Figure B1. Using Secondary Data and Statistical Modeling to Estimate Homelessness and Inform PIT
Count Methods ...................................................................................................................................................................... 34
References ..................................................................................................................................................................................... 36
Page | 2Executive Summary
The Hennepin County Office of Housing Stability requested assistance from students at the Humphrey
School of Public Affairs to conduct a study about how best to reform and improve their point-in-time
(PIT) count of people experiencing homelessness. The Hennepin County CoC’s PIT counts of both
sheltered and unsheltered people experiencing homelessness contribute to the determination of
federal funding received to support the County’s population experiencing homelessness. Current
counting methods are resource-intensive—particularly for the unsheltered count—and likely yield an
underestimate of people experiencing homelessness. These concerns have led to skepticism about the
practicality of the PIT count, as well as confusion around funding allocations.
The team conducted research over a four-month period, beginning late January 2021. The study relied
on frequent meetings with Hennepin County, a literature review to learn about sampling
methodologies and how other communities conduct their counts, and interviews with stakeholders
and experts to better understand the PIT count process. The literature review revealed several
innovative methods for sampling and estimating and the interviews highlighted concerns expressed by
those directly involved with the process.
This report provides background on the PIT count process, a summary of the methodological
approaches from the literature review, findings from the interviews, and recommendations to
strengthen future counts. Lastly, we summarize provide three key recommendations for the Hennepin
County CoC to prioritize as they prepare for the next PIT count amidst the COVID-19 pandemic:
1. Create a strategically designed sampling approach to use in future iterations of the
unsheltered PIT count and build quality checks into a sampling strategy to help inform
ongoing process improvement.
2. Increase connection and collaboration with the network of organizations, agencies, and other
stakeholders involved in the PIT count.
3. Use targeted approaches to increase the number of volunteers, particularly those who are
racially diverse and/or those with lived experiences of homelessness.
Page | 3Introduction
Background on the PIT count
According to the National Alliance to End Homelessness, in 2019, homelessness had grown nationally
for three consecutive years. The impact of COVID-19 threatens to continue, or even heighten, this rate
of increase. i With homelessness existing in every region of our country, communities are struggling to
end this upward trend. Continuums of Care (CoCs) are local or regional planning entities that
coordinate housing services and other resources for populations experiencing homelessness. One key
source of information providing insight to the ongoing issue of homelessness are point-in-time (PIT)
counts. PIT counts provide unduplicated counts of people experiencing homelessness on a single night
of the year, including populations who are sheltered (i.e., staying in an emergency shelter, transitional
housing, Safe Havens, rapid re-housing, permanent supportive housing) and unsheltered (i.e., living on
the streets or somewhere not considered suitable for habitation). The US Department of Housing and
Urban Development (HUD) requires that CoCs conduct PIT counts of sheltered homeless once per
year and unsheltered homelessness every other year.
Because the PIT count data that CoCs submit to HUD are used to allocate federal funding for states
and counties to address homelessness, it is crucial for the PIT count to be as accurate as possible.
However, many in the field have criticized the PIT count as an unreliable and inaccurate source of data.
Several studies have shown that CoCs’ PIT counts of unsheltered homelessness in particular are likely
a significant underestimate of the actual prevalence of unsheltered homelessness. ii,iii,iv The unsheltered
PIT count is also extremely resource-intensive, as each CoC has to develop and coordinate their own
process—often relying on volunteer support—to canvass the city on the night of the count. This
logistical complexity also creates barriers to obtaining a more accurate PIT count.
Project Overview
In 2020, officials at the Hennepin County Office of Housing Stability partnered with our team at the
Humphrey School of Public Affairs to evaluate the effectiveness of the Hennepin County CoC’s current
approach to conducting the PIT count as well as to explore alternative methods that might yield a more
accurate count. As the CoC lead for the county, the department is uniquely positioned to design a PIT
count process that is tailored to the local context and reflective of the community’s unique challenges
and strengths.
Research Questions
The central questions guiding this research are as follows:
● How does Hennepin County currently count sheltered and unsheltered homeless?
● What subset of the sheltered and unsheltered homeless populations is Hennepin County’s
current PIT counting methods capturing?
○ Who is not being counted?
○ What are the barriers to getting a more accurate count?
● How do other states, communities, or CoCs estimate sheltered and unsheltered homelessness?
○ What other sources of information can be used to estimate sheltered and unsheltered
homelessness?
● How can Hennepin County’s CoC improve their estimates of both sheltered and unsheltered
homelessness?
Page | 4Methods
To address these research questions, our team collected data from several sources, including a review
of the relevant academic literature and PIT count documentation, and interviews with experts and
practitioners.
Literature & Document Review
To understand how the Hennepin County CoC and others across the country implement the PIT count,
our team reviewed relevant documentation regarding PIT count processes (e.g., training and data
collection procedures) as well as analytic approaches (e.g., sampling and estimation). Because
homelessness is a well-researched topic, we were also able to gather insights through a review of the
academic literature. Our team reviewed more than 20 journal articles relating to topics such as the
accuracy of the PIT count, secondary data sources to model and estimate homelessness, and
innovative practices from other CoCs.
Interviews
To understand how various agencies interact with the PIT count, our team reached out to staff at 14
organizations. We were interested in a variety of perspectives, so contacted organizations whose
engagement with the Hennepin County CoC PIT count could be considered as direct (e.g., coordinating
the count, volunteering, managing data), supportive (e.g., administering services based on the impact of
results), or indirect (e.g., organizations who were not connected with Hennepin County, but provided
insights and perspectives from academic research or other CoCs across the country.) These
organizations included government agencies (state and local), academic institutions, research
organizations, and nonprofit street outreach organizations - both within and outside of Minnesota. Ten
organizations agreed to answer questions, providing a nearly 71 percent response rate. A total of 18
individuals contributed to the interviews. Four organizations did not return our request for an
interview. The perspectives lost from these four organizations reflected the manner in which
Minneapolis schools collect homeless information about children/families and how this data is
communicated with Hennepin County, how other in-state CoCs perform their PIT count, and the
impact the PIT count has on homeless shelters’ staff and clients. (A list of agencies is provided in
Appendix A.)
During each interview, we tailored our questions to accommodate the unique experiences and
expertise of each respondent. However, our questions generally included the following:
● What is your role and what responsibilities do you have before, during, and after the PIT count?
● What barriers exist to getting an accurate count?
● What, if any, populations are being missed by the PIT count? How can the CoC adjust their
process to better capture these populations?
● What are the strengths/challenges of the current way in which the Hennepin County CoC PIT
count is implemented?
● How might this process be designed differently if starting from scratch?
Structure of this Report
The purpose of this report is to describe the findings from our research on PIT count approaches in
Hennepin County and other communities across the country. In the Background on the Hennepin
County Continuum of Care section, we begin by describing Hennepin County’s current approach to the
PIT count, as these details about the current process help to contextualize the remainder of the report.
Page | 5Key findings from the study are described in the Findings section, and are further broken down by
findings relating to methodological approaches to the PIT count and process-related considerations. In
the Recommendations section, we synthesize the most salient opportunities and barriers to improve
the accuracy of Hennepin County’s PIT count and also offer concrete suggestions to strengthen future
iterations of the count.
Background on the Hennepin County Continuum of Care
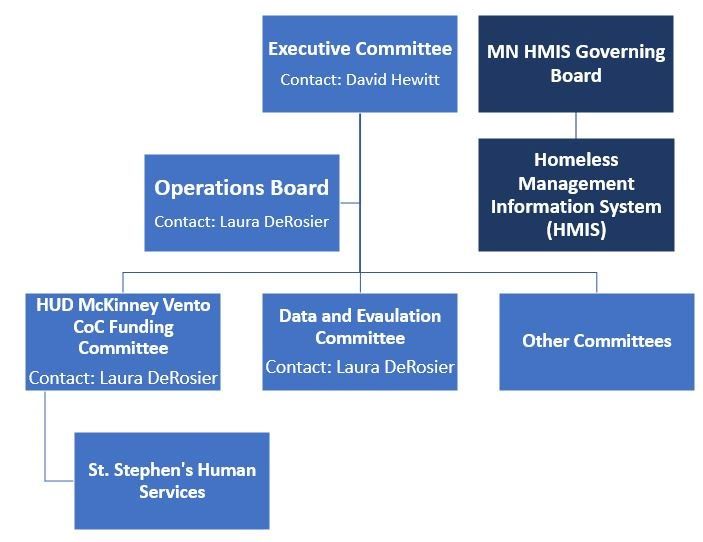
Organizational Structure
Hennepin County’s Continuum of
Care is a partnership among Figure 1. Hennepin County CoC Organizational Structure
elected officials, housing and
service providers, advocates,
and people who have
experienced homelessness. It is
governed by an executive
committee, which oversees the
homeless response system in
the county and assigns work to
the operations board and other
working committees (see
Figure 1). The HUD McKinney
Vento CoC Funding Committee
is responsible for monitoring
and evaluating the
performance of all projects
funded by the CoC. It is our
understanding that this funding
committee oversees the
partnership with St. Stephen’s
Human Services, the organization contracted to conduct Hennepin County’s sheltered and unsheltered
PIT count.
The Institute for Community Alliances (ICA) is the lead agency for the State of Minnesota’s
Homelessness Management Information System (HMIS). As the HMIS lead, ICA manages client-level
data on the provision of services to people experiencing homelessness across the state. After the PIT
count, each CoC submits all data to ICA, where staff then conduct data cleaning and validation to
ensure data quality, deduplication, and adherence to HUD guidelines. ICA recently developed the PIT
LIVE, a system that allows surveyors to submit data electronically on the night of the count, thus
eliminating the need for manual data entry from paper surveys.
The Minnesota HMIS Governing Board represents all ten of Minnesota’s CoC regions. They share
ownership of the HMIS system, including the PIT count. Through an agreement reached with a
statewide Board of regional CoC representatives and other stakeholders, ICA has memoranda of
understanding (MOUs) with each of the state’s ten CoC regions (including the Hennepin County CoC).
These MOUs dictate the extent to which ICA can tailor their data management services for each
individual CoC.
Page | 6PIT Count Process
HUD requires all CoCs to conduct a PIT count on a single night during the last ten days in January. To
capture seasonal differences, the Hennepin County CoC conducts its own midyear PIT count on a
single night during July. The sheltered count is conducted using shared HMIS data systems maintained
by service providers. The unsheltered count relies on surveyors to canvass the geographic area to
identify and survey individuals experiencing unsheltered homelessness. v
Because the unsheltered PIT count in particular requires a large team of staff who can canvass the
CoC’s geography during a single day, the Hennepin County CoC enlists many volunteers to help
support the PIT count. To recruit volunteers, St. Stephen’s relies on their staff, former employees,
other street outreach staff, people within their networks, a few trauma-informed volunteers, and an
occasional politician. Per our discussion with St. Stephen’s, they indicated sending out 13 teams of 3 to
6 volunteers (per team) each year. In 2020, St. Stephen’s recruited upwards of 65 volunteers to help
with the overnight count. During the day, they enlisted around 45 volunteers to survey service sites
and two camps. For both the day and overnight counts in 2020, St. Stephen’s recruited around 100
volunteers in total.
Staff from St. Stephen’s and ICA have collaboratively developed detailed manuals and training videos
to support their staff, volunteers, and service providers in collecting and submitting PIT count data.
Staff from ICA generally use a “train the trainer” type model, taking the lead on the development of
training materials and instructional manuals, which staff from St. Stephen’s then use to train staff and
volunteer surveyors. The exact nature of training varies somewhat from year to year as ICA and St.
Stephen’s collaboratively revise the process to better support surveyors. However, prior to collecting
any data in the field, volunteers are generally required to review instructional materials in addition to
watching short training videos about how to conduct the count. In recent years, volunteers have met
with St. Stephen’s staff from a 1-hour, in-person training before the night of the count.
The areas to canvass are typically predetermined prior to the count. The transit system was the largest
overnight shelter before all-night service was discontinued and the Metro Transit Police established
the Homeless Action Team, a group of MTPD officers who offer help or services to those experiencing
homelessness. PIT count coordinators relied on information from bus drivers/train conductors to
understand how and where individuals experiencing homelessness made use of the transit system and
stations. From these discussions, St. Stephen’s was able to use social mapping tools to identify areas to
canvass. This proved especially helpful for the Park & Rides in suburban areas. With tighter
enforcements on the transit systems, PIT count coordinators select areas to canvass based on
historical knowledge about where people locate, locations identified from past counts, and current
knowledge about active locations. For example, a suburban rest stop is a known location where
individuals experiencing homelessness gather, but en route, stops will be made at parking lots of
suburban big box stores or strip malls, as well as checking sheltered lobbies of banks’ ATMs.
Downtown areas are based on active knowledge, especially for parking garages and doorways.
Surveyors canvass these selected areas during the night, starting around 10 p.m. The following day,
teams will canvass encampments, known locations in which the surveyors did not feel safe to approach
at night, and approximately 15 to 18 sites where individuals gather to receive services: meal sites,
drop-in centers, and service agencies (e.g., Mary Jo’s, Loaves & Fishes, St. Stephen’s drop-in site.) This
effort identifies and surveys additional unsheltered individuals who may have been missed during the
overnight count.
Surveyors from St. Stephen’s conduct the count using one of three forms:
Page | 7● The long version survey is administered by interviewing individuals experiencing homelessness.
The survey includes detailed questions about individuals’ demographic identities, housing
history, health, employment, and education.
● The short version survey is also administered via interviews and covers similar topics as the long
version, but in fewer, less detailed questions.
● The observational form differs from the long and short versions of the survey in that it does not
require interviews. Rather, the observational form is meant to be used only in situations where
it is not feasible and/or safe to interview an individual experiencing homelessness - for
example, if they are asleep or staying in a poorly lit area. The form includes only basic questions
about demographic identities, which are completed based on the surveyors’ perceptions.
Findings
Innovative PIT Count Methods
The resource-intensive nature of the unsheltered PIT count combined with the high degree of
transience among people experiencing homelessness pose unique methodological challenges for CoCs
in designing and executing their PIT counts. To identify strategies that the Hennepin County CoC could
use to improve the efficiency and accuracy of their unsheltered PIT count, our team reviewed the
extant literature for innovative PIT count methodologies being used by other CoCs across the county.
This section provides a brief overview of several promising methodologies, including those that include
sampling, estimation, and data quality checks, as well as a few innovative uses of technology to
automate PIT count processes. Our description of each approach includes a brief discussion of its key
strengths and challenges, and further implications for the Hennepin County CoC are further discussed
in the Recommendations section of this report.
Sampling, Estimation, & Quality Checks
Random sampling in regions based on expected density of homelessness
Given the resource-intensive nature of the unsheltered PIT count in particular, many CoCs conduct a
comprehensive count only in a random sample of regions. This approach allows CoCs to strategically
target their available resources to conduct a more thorough count in select regions, which can then be
used to more accurately estimate the overall homeless population. In line with HUD’s sampling
guidance, many CoCs define and sample regions based on their expected density of unsheltered
homelessness. Under this approach, regions where a high number of people experiencing unsheltered
homelessness are expected to congregate at night would be designated as “high-density,” for example,
while other regions might be designated as “low-density.” CoCs can make these density determinations
based on a number of factors. In Connecticut and New York City, for example, regions are categorized
as high- or low- density based on both PIT count data from previous years as well as the institutional
knowledge of CoC staff, partners, and community stakeholders. vi,vii In Connecticut, where a single CoC
manages the statewide PIT count, they defined regions as the state's 829 census tracts. The CoC
conducted a full count in the 183 "high density" tracts as well as a random sample of 143 of the
remaining 646 low density tracts (weighting factor 4.517). viii HUD does not specify an ideal size for
each region, nor a predetermined list of geographic indicators that should be used to determine
regional boundaries. Rather, HUD recommends that CoCs define regions according to local context,
prioritizing that each region is uniform in terms of its expected density of homelessness, even if that
means that each region within the CoC is a different size. Further details about HUD’s recommended
sampling approach are provided in Appendix B.
Page | 8In addition to sampling regions based on the expected density of homelessness, some CoCs and
researchers have used other sources of secondary data to develop a more nuanced sampling strategy.
Researchers from Los Angeles, for example, used data from the U.S. Census and other administrative
sources to identify a sample for a household phone survey to identify hidden homelessness in
residential areas. In this study, researchers selected a disproportionately stratified dual-frame random
sample of households based on research-based predictors of homelessness, such as median household
income, availability of single-family homes and vacancies, and racial/ethnic composition. ix Others in the
field have leveraged housing market data, x consumer reference data, xi and even data on local “311”
calls xii to further understand and predict regional patterns of homelessness. During our interviews
with experts, many respondents mentioned the benefits of using sampling and/or secondary data to
improve CoC’s estimates of homelessness. Further details regarding potential sources of secondary
data to model and estimate homelessness are provided in Appendix B (Figure B1), along with more
details regarding how these data might be leveraged to inform sampling.
Household phone surveys
Some communities have attempted to address the issue of high transience and low visibility among
unsheltered homeless populations, often referred to as hidden homeless (see Figure 2), 1 through phone
surveys, asking a sample of the general population to report any individuals living unsheltered on their
private properties. However, a significant limitation of these approaches is that they often yield
imprecise estimates with large standard errors, largely due to small sample sizes. xiii To improve
estimates, researchers in Los Angeles conducted phone surveys in a stratified sample of households,
but instead of asking
respondents to report any Figure 2. HUD’s Working Definition of Hidden Homeless
unsheltered individuals living
only on their private property, Precariously housed – A person who is staying with the household
they also asked about because he or she has no other regular or adequate place to stay
unsheltered individuals living due to lack of money or other means of support and who is
on their neighborhood block. sleeping inside the house will be allowed to stay for 8-90 days;
Sometimes referred to in the
literature as multiplicity or At-risk of literal homelessness – A person who is staying with
xiv
network sampling, this household because he or she has no other regular or adequate
sampling methodology allowed place to stay due to a lack of money or other means of support
researchers to estimate the and who is sleeping inside the house, and will have to leave in 7
unduplicated number of hidden days or less.
homeless, thus improving the
precision of estimates. Counts
were used to estimate the
number of unsheltered homeless who were hidden on the night of the PIT count. Using this multiplicity
approach, they were able to detect an additional 7,822 cases of hidden homeless not captured in the
PIT count, which focused on visible homeless populations. xv
While household phone surveys can be used to estimate hidden homeless populations, it relies on self-
reported or observational data – meaning that the accuracy of the estimate is highly dependent on the
information reported by respondents. Additionally, some of the sampling methods are respondent-
driven and time-intensive. Unlike respondent-driven sampling methods, multiplicity-based approaches
do not require eligible respondents to complete an interview. Instead, respondents only reported the
1 These working definitions were agreed upon by experts from the following agencies: HUD, Urban Institute, Abt
Associates, Abt SRBI, the National Alliance to End Homelessness, and Marketing Systems Group.
Page | 9number of hidden homeless within their area. In Los Angeles, this was beneficial for reducing the
sampling error because their staff were able to contact more eligible respondents, which increased
their sample size. While multiplicity-based approaches produce more precise estimates, less is known
about the hidden populations experiencing homelessness. For example, staff were not able to capture
any demographic information. xvi
Plant-capture or decoy methods
Estimating the number of people experiencing homelessness who are missed by current PIT count
methods may provide valuable information that communities can use to generate more accurate
estimates of regional homelessness. Some communities do this through the use of decoys or “plants”
who are strategically placed throughout a region on the night of the count. Trained staff serving as
decoys are instructed to dress and act as if they are homeless, and then report to the CoC whether
they were surveyed on the night of the count. The CoC can then use the proportion of decoys not
surveyed in various regions to estimate the number of people experiencing unsheltered homelessness
who were missed on the night of the PIT count. New York City used this method during their 2006 PIT
count. Of the 127 plants placed across 41 sites, just 59 percent were counted. At least one plant was
missed in 29 percent of sites - either because the site was not canvassed or because the surveyor
simply did not count the plant. Based on these findings, the city adjusted their PIT count total by 22
percent. xvii The researchers noted that this method was relatively efficient to implement, and further
noted that the quality-control messaging of the studies seemed to improve volunteers’ motivation, at
least anecdotally. However, the researchers also highlighted some limitations - namely, that surveyors
were quick to ignore or “discount” plants who did not meet stereotypical definitions of what
homelessness looks like. Although they did not collect quantifiable data about the frequency with
which plants were discounted based on appearance, the authors note that these findings have
important implications for the PIT count more broadly, and particularly for how surveyors are trained
to identify and approach individuals experiencing homelessness.
Given the efficiency of plant-capture methods combined with their ability to improve estimates of
homelessness, many researchers have applied them in varying contexts. For example, using a novel
Bayesian technique, McCandless and colleagues used plant-capture data collected in Toronto to
calculate 95 percent confidence interval estimates for the citywide population of people experiencing
homelessness. xviii,xix Plant-capture techniques are included in HUD’s list of recommended
methodologies.
Post-count interviews of service users
To better understand if individuals experiencing unsheltered homelessness are being missed during
the night of the count, a CoC in New York interviewed service users two days following the count. The
CoC created a stratified random sample based on neighborhoods and frequency of service. They
interviewed individuals at soup kitchens, mobile food programs, drop-in centers, and all of the city’s
most popular street outreach programs. Interviewers asked service users where they spent the night
during the count. Depending on their response, individuals were categorized as not homeless,
sheltered, or homeless and unsheltered. The interviewer then asked additional questions, such as
where they stayed on the night of the PIT count, to determine if it was possible that the individual
could have been seen by a PIT counter during the night of the count. For example, individuals who
reported being on the train during the night of the count were asked if they rode to the final stop,
where PIT count surveyors were located. The interview allowed the CoC to create probability
estimates of individuals being visible and counted. Using location descriptions collected during
interviews, respondents classified as homeless and unsheltered were categorized as definitely visible,
definitely not visible, and uncertain. They estimated a two-level hierarchical linear regression model to
determine if visibility varied by surface (i.e., subway vs street), borough (i.e., Manhattan vs outer
Page | 10boroughs), and service type. They found that individuals in Manhattan were more likely to be visible
during the count, and that those in the subway system were more likely to be visible than those on the
street, suggesting that the city’s strategy to count homeless subway users at terminal stations was
effective. Lastly, type of service (e.g., soup kitchen, mobile food program, drop-in center, street
outreach program) was not associated with level of visibility during the night of the count. xx
Capture-recapture observational counts
A significant challenge to conducting a more accurate PIT count is the high degree of transience among
individuals experiencing homelessness, and particularly those who are unsheltered. To mitigate this
barrier, researchers at the University of Toronto employed a novel “capture-recapture” observational
technique. Originally developed as a way for conservationists to estimate wildlife populations, the
capture-recapture technique is well-suited to model the daytime transience and shifting visibility of
those living unsheltered. Multiple times in the same day, staff conducted observational counts of
unsheltered homelessness in a random sample of regions throughout downtown Toronto, making note
of individuals who were observed during one or multiple timepoints (based on observer recognition).
Staff collected data using either a multi-team or single-team approach. Staff using the multi-team
approach collected data on foot in teams of 2-3, each canvassing a one-block radius surrounding one of
42 intersections strategically placed throughout the city - once from 10-11:00am and again from 2-
3:00pm. Staff assigned to the single-team approach collected data from inside a slow- moving vehicle (1
driver and 3 observers), canvassing the same predetermined route three times in the same day - from
10-11:00am, 2-3:00pm, and 4-5:00pm. Vehicles used in the single-team approach were equipped with
cameras so that recordings could be reviewed for accuracy.
Under this approach, the ratio of individuals observed twice (i.e., "recaptured") is assumed to be the
same as the ratio of individuals observed once, relative to the whole population. As such, this method
allowed researchers to estimate citywide unsheltered homelessness based on a random sample. xxi
However, this estimation technique relies on several assumptions that may be difficult to guarantee in
practice. First, this approach assumes that sampled areas contain closed populations that do not change
during the observation period. Although the unsheltered population is highly transient, researchers
used short time intervals between observations to minimize any issues. Second, repeated observations
rely on observers’ ability to recognize and distinguish individuals at multiple timepoints, otherwise running
the risk of “lost tags” (i.e., missed or misidentified repeat observations). However, research shows that
motivated observers can accurately recall more than 24 distinct individuals within a single day. xxii
Finally, this method assumes independent samples, meaning that individuals observed once are equally
likely to be observed a second time. To minimize the role of potential observer bias, the researchers
trained observers extensively on how to passively identify individuals experiencing unsheltered
homelessness, and also had multiple teams canvass the same area to derive sensitivity estimates.
The researchers found that the multi-team approach group conducting observations on foot had a
higher detection rate than the single-team approach group conducting observations from a slow-
moving vehicle (7.11 sightings/km compared to 5.55 sightings/km, respectively). However, it is
important to note that both the research team in Toronto and other scholars who have applied these
techniques in other contexts caution that the underlying assumptions behind capture-recapture
methods are unlikely to hold in real-world contexts. xxiii A further limitation of this approach is that the
passive nature of observational data collection does not allow detailed demographic information to be
collected. Ultimately, the authors suggest that capture-recapture techniques may be most useful if
used in conjunction with another approach (e.g., surveys of service users) to better understand the
daytime transience and street-use patterns of people experiencing unsheltered homelessness. xxiv
Page | 11Innovative Technologies & Processes
Automated processes to clean and summarize PIT count data
Another challenging aspect of the PIT count is the amount of time and labor it requires to clean and
summarize data after they are collected. In many CoCs data cleaning processes happen at multiple
levels, with specified processes for surveyors, service providers, and HMIS staff to ensure data quality
and de-duplication. To reduce the burden of this process, a team of researchers at the University of
California Riverside worked with Riverside County to develop an automated pipeline for PIT count
data. Researchers developed coding systems in Python to automatically input raw data, clean and
tabulate it, and generate interactive data dashboards. Once this process was fine-tuned, data
processing required only 3 steps: validating self-input living situations, identifying survey locations,
and pushing the data into the website's server. xxv Although these systems did not increase the accuracy
of the CoC’s count, they reduced staff hours needed to process data, potentially allowing them to
redirect those resources elsewhere.
Using a mobile app to track the count
Several CoCs have leveraged app-based technologies to improve the accuracy and implementation of
their PIT counts. Connecticut’s Coalition to End Homelessness, for example, used a mobile app called
"Counting Us" to track the PIT count. Using this app, they defined boundaries of each geographic area
and created a "Setup Key," which was provided to volunteers during the night of the count. Block
groups were defined as high or low probability in terms of their expected density of people
experiencing homelessness. The app included a survey that can be administered to individuals or
households. Surveys include demographic information such as age, race, gender, veteran status,
disabling conditions, length of homelessness, and other HUD required variables. The app included GPS
functionality to pinpoint the exact physical location where each survey was conducted. In this way, the
PIT Regional Command Center - which received the survey data in real time - was able to alert
volunteers the moment they strayed outside of their assigned area. xxvi Tracking volunteers in real time
helped count administrators ensure that high probability block groups were fully and accurately
canvassed while also avoiding duplicative counts. During our interviews with experts, several
respondents also noted the potential for similar apps and other technologies to improve the PIT count
process. However, two respondents had concerns about the ethics of certain technologies. For
example, one respondent at Wilder shared that some CoCs have used GIS technology to capture the
locations of people experiencing unsheltered homelessness on the night of the count, which raises
some concerns about privacy and informed consent.
PIT Count Process & Coordination
In both our review of the literature and interviews with experts, we identified several findings
regarding the process and coordination of the PIT count. Throughout this section of the report, our
team organized these findings according to four overarching themes:
1. Relationship Building & Communication
2. Volunteers & Training
3. Data Collection & Survey Submissions
4. Other Barriers to a More Accurate PIT Count
Page | 12Relationship Building & Communication
Challenges building relationships and coordinating with other organizations threaten
community buy-in and full participation in the count.
Like many CoCs across the country, the Hennepin County CoC’s PIT count involves a network of many
agencies and stakeholders. In Hennepin County, the CoC manages and oversees the PIT count process,
St. Stephen’s coordinates street outreach efforts and trains volunteers to conduct the count, and ICA
both manages count data and provides technical assistance to other agencies. Having several
organizations involved in the count is beneficial in that each organization brings its own strengths and
perspectives. However, many regional stakeholders noted during interviews that this structure may
also lead to coordination challenges. Respondents at several organizations, for example, noted a lack of
clarity regarding roles and responsibilities across PIT count processes. Two respondents both mentioned
that it was unclear who had decision-making authority within the CoC leadership. This leads to a host
of issues. Respondents from these organizations specifically wondered who or how direction was being
set for the count and whether the data collected was credible. Different people could be making
different decisions and have different perspectives that aren’t in alignment, which may contribute to
missing gaps in the PIT count efforts and data collection and dissemination. Further, one respondent
noted that measuring homelessness is challenging and a part of that challenge is due to there being so
many systems involved. She shared that the needs and experiences of homelessness are widely
different across various subgroups (e.g., youth, families, and veterans) and trying to accurately capture
this in the PIT count creates a very resource-intensive process.
Most stakeholders we interviewed (n = 7) felt that strong relationships and frequent communications
between these varying agencies were crucial for the success of the PIT count. Likewise, several
respondents noted that weak relationships or infrequent communication have at times led to friction
between agencies, which has in turn threatened buy-in and participation in the count. Multiple
respondents stated that poor relationships with housing and service providers have impacted the
sheltered count. While some providers are not required to participate in HMIS (e.g., domestic violence
shelters), HUD requests that CoCs ask those non-HMIS agencies to still participate in the PIT count if
they serve people experiencing homelessness. However, several respondents in Hennepin County
noted that because the CoC does not maintain ongoing relationships or even updated contact
information for these non-HMIS providers, many have not been counted in recent years. When the
CoC does not have updated contact information and efforts to obtain it are unsuccessful, ICA helps the
CoC decide how to account for missing data to estimate those sheltered counts. Sometimes, ICA’s
methodological guidance is to use PIT count data from past years to estimate these sheltered counts.
Other times, ICA recommends extrapolating data based on what is known. In the last year,
respondents from ICA reported supporting the CoC with an extensive effort to contact non-HMIS
agencies to collect better sheltered counts, emphasizing the importance of shared, reasonable effort to
reach these agencies. Another respondent shared similar sentiments, echoing that the accuracy of the
count is dependent upon the community stakeholders, the connections within that community, and
what the community is willing to do.
For the unsheltered count, insufficient attention toward relationship-building and communication may
also create a missed opportunity to improve the accuracy of the count. For example, one respondent from
Align Minneapolis (an interfaith collaboration of 17 Minneapolis churches, synagogues, and mosques
and people with lived experiences working together to address homelessness and poverty) mentioned
that in the past, they would receive a copy of the PIT count survey well in advance of the count so their
staff could become familiar with it and help administer surveys on the day of the count. However, this
respondent noted that this has not been the case in recent years, thereby limiting their ability to help
with the count. During interviews with regional stakeholders, several respondents also noted that
community organizations and service providers have deep knowledge of homeless populations and
Page | 13their concerns, but that the CoC has not appropriately leveraged this knowledge to inform the PIT
count. In the same vein, some respondents indicated that they did not feel their efforts related to the
PIT count were sufficiently appreciated or valued. Multiple respondents noted that the CoC leadership
should consider paying street outreach workers for the time and efforts as a way to both convey
appreciation and build stronger relationships over time.
The crucial role of relationship-building and coordination among community-based partners was also
echoed in both the academic literature and several interviews with experts. A recent comparative
analysis of PIT count processes, for example, highlighted the need for more robust relationship-
building and coordination with community based organizations, and further recommended that this
process be facilitated by social workers with a trauma-informed lens. xxvii Some communities have
launched initiatives to develop more intentional and formalized relationships with service providers
and outside agencies as a way to improve their PIT count, often with great success. The Camden City
School District, for example, partnered with local nonprofits and social service agencies to better
understand homeless youth and support families. xxviii HUD encourages this type of collaboration with
local homeless education liaisons, as they can provide valuable insights and support selecting family-
and youth-friendly count sites and structuring effective incentives for count participation. Liaisons
may also help recruit PIT volunteers and suggest other local family and youth service providers to
assist with the count. xxix
Given the broad geography of the county and varying population densities, it may be particularly
challenging to maintain communication and partnerships in suburban areas. What surveys are
administered in the suburbs typically occur at transit stops as well as specific, known or probable
locations. However, several respondents noted there is a lack of counting individuals at day service
centers and in engaging suburban-based agencies and groups that work with unsheltered individuals.
In spite of this barrier, two respondents felt that suburban service providers may be willing to assist
with the count, but noted that more outreach from the CoC would be needed to develop those
relationships. Researchers we interviewed from Wilder indicated that their strong reputation and
connections throughout the state have allowed them to connect with even the small “ma and pa” type
of shelters in rural Minnesota, further supporting the robustness of their count.
Ambiguous communication has led to confusion and contradicting opinions about the purpose
of the PIT count.
In our interviews with experts and key regional stakeholders, several respondents expressed a desire
for more ongoing communication specifically about the purpose and timing of the count. Importantly,
respondents’ perceptions about the core purpose of the PIT count varied significantly. Most
respondents viewed the count as a full census count, while a few saw it as more of a performance
measure (e.g., target the same areas each year to watch trends), and others saw it as a combination of
both. In particular, direct service providers were more likely to view the count as a census, whereas
macro-level organizations viewed it more as a performance measure. St. Stephen’s indicated that they
have always attempted a full census count and that due to the shifting geographical locations of people
experiencing homelessness, it may be inaccurate or difficult to conduct the count through targeting
sampling the same way every year. These differing views of the PIT count even exist within the
agencies who manage and conduct the PIT count.
Along with an unclear purpose, respondents also had varying perceptions about how the PIT count
influences the amount of funding received and how those funds are allocated. Funding from HUD is a
competitive process. The CoC submits an application to HUD requesting funds on behalf of direct
service non-profit agencies; the result from the PIT count is only one piece of this application. The
application may request funds for maintaining existing services: this could have significant impacts for
an agency, especially given the annual funding cuts HUD makes to existing permanent supportive
Page | 14housing, transitional housing, and rapid rehousing projects. Once HUD reviews the submitted
applications, they award funding to these service agencies. The funding is directed to helping
individuals receive rental assistance or help in finding and keeping housing.
One respondent highlighted this point that several factors, not just the pure PIT count number, are at
play when competing for funding. Strategies, evidence-based practices, and the way in which efforts
are coordinated are some of these elements that are taken into account. This respondent explained the
allocation of funding in this way:
“You don't fund based on the size of the problem. You fund the entities, the providers, the
partnerships, that are delivering results. What that means, each year when we go into the
competitive application for hard funding, is that if we're doing well we get bonus funding, so we can
do even better. And if we're doing badly, why would they waste more money on us? They'll take
money away from us and give it to other communities who are doing well, so that they can do better.”
Respondents from direct service and advocacy organizations had different understandings of how the
PIT count influences funding amounts and allocations. Respondents from MICAH (the Metropolitan
Interfaith Council on Affordable Housing 2), for example, noted that they and other street outreach
groups perceive that declining PIT counts indicate “a good job.” They view that this decrease will
translate to continued and/or bonus funding from HUD to local service agencies, impacting the rental
assistance and other support services for people exiting homelessness. In this way, several street
outreach organizations fear that the CoC has a troublesome conflict of interest in that they are
incentivized to under-count or under-report the full count as a way to secure additional funding.
And yet, there is also the perception that some stakeholders may be incentivized to over-count people
experiencing homelessness, believing that the perceived scale of the problem will draw the attention of
policy makers, activists, and community leaders. These stakeholders hope that attention to the
magnitude of homelessness will result in additional resources.
With these opposing and nuanced views, some respondents acknowledged that funding
determinations are complex. They noted that if people better understood the purpose of the count,
then they may have more faith in the process and be more willing to participate. People experiencing
homelessness may struggle to see how the PIT count tangibly benefits them, or may even question
whether funding translates into better services. For example, one respondent from Align Minneapolis
noted that the homelessness advocacy group Street Voices of Change is primarily focused on
improving the culture of safety at existing shelters, an issue that cannot be solved by more federal
funding alone.
These misperceptions not only threaten the PIT count and thus funding from HUD, but also buy-in and
participation in the count, producing incongruencies in how the count is prepared, collected, and
disseminated. Several respondents expressed concerns regarding PIT count trends and how those data
are used by politicians and advocacy groups. One respondent recognized the challenges in which
activism and advocacy blur into the service provider networks.
2 The Metropolitan Interfaith Council on Affordable Housing envisions a metropolitan area where everyone without
exception has a safe, decent, accessible, and affordable home.
Page | 15Volunteers & Training
Limited volunteer capacity inhibits an accurate unsheltered count.
St. Stephen’s indicated recruiting approximately 100 volunteers and staff for the 2020 PIT count. This number of volunteers is low compared
to cities with a similarly sized population. A review of other cities’ recruitment efforts (see Table 1) compared with those of Hennepin County
CoC highlight a greater number of volunteers in comparably sized cities. This comparison was created with a few assumptions for ease of data
collection:
● Cities, not CoCs, were used as the initial point of comparison, making the assumption that the city would have the most dense
population within the CoC.
● The square mileage of the CoC was recorded, recognizing the entire geographic range of the CoC needs to be canvassed.
● The number of volunteers listed is for the entire CoC, unless otherwise stated.
Table 1. Number of 2019 PIT Count Volunteers in Comparably Sized Cities xxx, xxxi, xxxii
City
City CoC Square Miles of CoC Volunteers xxxiv
Population xxxiii
Oakland: 78 Oakland alone: 200 volunteers + 75 guides
Oakland, CA 425,195 Alameda County CoC
Alameda County: 739 Alameda CO CoC: 489 volunteers + 164 guides
Minneapolis, MN 422,331 Hennepin County CoC 607 ~100 volunteers
Tulsa, OK 401,800 Oklahoma City CoC 621 37 agencies provided volunteers
550 volunteers + 100 Neighborhood Police
Arlington, TX 396,394 Tarrant County CoC 902
Officers
New Orleans, Jefferson
New Orleans, LA 393,292 665 200+ volunteers
Parish, City of Kenner CoC
For discussion, Oakland, CA will be used as an example. Oakland has a comparable population to Minneapolis and covers roughly a similar
geographic area. Oakland, however, engages over 200 volunteers, with an additional 75 homeless guides. 3,xxxv The 100 volunteers for
Hennepin County’s CoC actually represents the entire CoC geographic area of 607 square miles, with a much larger population (1.3 million).
3 A homeless guide is considered someone who has lived experiences with homelessness and works with CoC staff and volunteers to conduct the unsheltered PIT
count.
Page | 16During our interviews with regional stakeholders, two respondents felt that this lack of volunteers, particularly within the suburbs, significantly limits the accuracy of the count. More than one respondent expressed concern that the volunteer pool was fairly homogeneous, leaning heavily “white female,” and was not reflective of the individuals experiencing homelessness, who tend to be more racially diverse. Another respondent stated that Spanish-speaking volunteers are needed to help with the count. The need to create a more culturally competent and diverse group of volunteers was emphasized not only by these respondents, but also in our review of the extant literature. Several large-scale studies have highlighted the importance of “bureaucratic representation,” or alignment between the demographic characteristics of the public service workforce and the populations they serve. xxxvi, xxxvii This research shows that representation is important not only for building trust and buy- in to public systems, but also for improving the provision of services to marginalized groups. Four respondents recognized the importance of pairing surveyors with someone who was experiencing or recently experienced homelessness as a “guide” to help during the night of the count. They noted that guides would be seen as a trusted individual among the populations experiencing homelessness, which could increase buy-in and make people more comfortable with answering the survey. Respondents also noted that guides were more knowledgeable about “hidden” areas than CoCs and other volunteers. Each respondent discussed how the guide should be considered a partner in this endeavor and be compensated appropriately for their time and knowledge. One respondent shared her experience working with paid youth guides for a PIT count in Philadelphia, sharing that this was a useful and effective method for finding and engaging youth experiencing homelessness. Insufficient training about data collection contributes to data quality issues. The Hennepin County CoC relies heavily on volunteers to conduct both the sheltered and unsheltered PIT count. Staff from ICA serve in a “train the trainer” role, wherein they develop instructional materials and best practice guidelines that St. Stephen’s staff then use to administer training. In recent years, volunteer training included a 1-hour, in-person training session. Among the regional stakeholders and experts we interviewed, four respondents indicated that current volunteer training processes are insufficient. Respondents from ICA noted, for example, that although they had developed a detailed, 30-page instructional manual for volunteer surveyors, that the only document used during volunteer training was an abbreviated 1-page tip sheet. In this instance, staff from ICA were able to quickly respond by developing a slightly more detailed 2-page tip sheet for the following year, recognizing that volunteers were unlikely to read the full 30-page manual. However, several respondents shared concerns that these and similar gaps in training may lead to issues with the quality of PIT count data. A few respondents shared that improper training has led to volunteers taking liberties with how surveys are administered in the field. The CoC maintains two different versions of the unsheltered PIT count survey - a long version that includes all questions, and a short version that includes only crucial demographic questions. In instances where it is not feasible to interview an individual experiencing homelessness (e.g., if the individual is sleeping or in an unsafe location), the CoC allows surveyors to complete a much shorter observational form. One respondent mentioned that in the past, volunteers have sometimes improperly used the observational form in lieu of the long or short versions. Although the observational form is only meant to be used when an interview is not possible, we heard reports that some volunteers used the observational form as a “shortcut” to minimize the number of questions asked. Others have used the observational form for a simple head count when it was not feasible to survey a large group of people. Two respondents from ICA noted that data collected using the incorrect form (i.e., observational form instead of the long version survey) resulted in these data not being included in the final count due to data quality concerns. Specifically, these data can be thrown out due to an inability to differentiate between true observational data or data collected through direct questioning. Because the short version of the survey was recently developed and has not yet
You can also read