Examining Sociospatial Polarization in Halifax: What Scale Matters? - Jill Grant
←
→
Page content transcription
If your browser does not render page correctly, please read the page content below
Examining
  Sociospatial
  Polarization
  in

          Halifax:
  What
  Scale
  Matters?


                              Victoria
  Prouse


         PLAN6000
  Independent
  Project


                 Dalhousie
  University
  School
  of
  Planning


            Supervisor:
  Dr.
  Jill
  Grant


       Course
  Instructor:
  Farhana
  Ferdous


                   December
  2013
                                                    ACKNOWLEDGEMENTS


               Generous
  funding
  support
  for
  this
  project
  was
  provided
  by
  the
  Social
  Sciences

and
  Humanities
  Research
  Council
  of
  Canada
  through
  a
  Joseph
  Armand
  Bombardier

Graduate
  Scholarship
  (Master’s).
  This
  research
  contributes
  to
  the
  Neighbourhood

Change
  Research
  Partnership
  (NCRP),
  led
  by
  Dr.
  David
  Hulchanski
  of
  the
  University
  of

Toronto.
  The
  Social
  Sciences
  and
  Humanities
  Research
  Council
  of
  Canada
  also
  provides

funding
  for
  the
  NCRP
  and
  its
  initiatives.

               I
  am
  exceedingly
  grateful
  for
  Dr.
  Jill
  Grant’s
  guidance
  and
  feedback
  throughout

this
  project,
  and
  throughout
  the
  Master
  of
  Planning
  Program.
  I
  am
  thankful
  for
  Dr.

Howard
  Ramos’
  assistance
  with
  the
  quantitative
  components
  of
  the
  study.
  I
  extend

much
  appreciation
  to
  Siobhan
  Witherbee
  and
  Kirk
  Brewer
  for
  creating
  GIS
  maps
  to
  show

my
  data,
  and
  to
  Paul
  Shakotko’s
  and
  Dr.
  Martha
  Radice’s
  valuable
  insight
  that
  influenced

the
  conceptual
  foundation
  for
  this
  project.

               Finally,
  I
  am
  appreciative
  of
  my
  parents’
  endless
  love
  and
  support
  in
  all
  my

endeavours.
  I
  am
  deeply
  indebted
  to
  my
  grandmother,
  Marilyn
  Coffman,
  for
  her

indispensible
  direction
  with
  assignments
  throughout
  my
  university
  career.
  I
  would
  also

like
  to
  thank
  Aron
  Coccimiglio
  for
  his
  constant
  encouragement
  throughout
  this
  project.


                                                                                                                                 ii
EXECUTIVE
SUMMARY
Due
to
privacy
concerns,
individual-‐level
census
data
is
unavailable
for
public
use.
Aggregated
census
data
–
compiled
at
the
census
tract
and
dissemination
area
levels
–
is
used
as
a
proxy
to
portray
socioeconomic
conditions
within
these
administrative
units.
Literature
shows
that
despite
widespread
usage
of
aggregated
census
data,
researchers
and
policymakers
fail
to
critically
assess
the
limitations
and
embedded
assumptions
of
this
method.
How
does
the
aggregation
of
data
to
arbitrarily
defined
geographic
units
affect
the
socioeconomic
portrait
they
produce?
My
research
elaborates
on
findings
from
Prouse
et
al’s
(Forthcoming)
report
for
the
Neighbourhood
Change
Research
Partnership
(NCRP)
exploring
Halifax’s
geography
of
income
inequality
and
polarization.
The
report
revealed
mixed
trends
in
the
overall
CMA,
with
no
strong
evidence
of
increasing
income
polarization
at
the
census
tract
level.
In
many
cases,
trends
were
ambiguous
and
diverged
from
hypotheses
derived
from
local
understandings
of
the
lived
reality
of
these
spaces.
Though
Halifax
is
consistently
portrayed
in
literature
as
a
relatively
egalitarian
city
compared
to
larger
Canadian
CMAs,
observed
circumstances
–
including
concentrated
poverty
in
Halifax’s
public
housing
projects
and
gentrification
in
the
North
End
–
suggest
otherwise.
Prouse
et
al
hypothesized
that
the
study
parameters
–
using
census
tracts
as
the
units
of
analyses
–
could
explain
discrepancies
between
census
data
indicators
and
qualitative
observations
of
socioeconomic
conditions.
Hence,
in
this
study,
I
explore
the
dynamics
and
nature
of
sociospatial
polarization
at
the
dissemination
area
level.
In
particular,
I
sought
to
determine
whether
greater
evidence
of
sociospatial
polarization
is
evident
at
the
DA
level
than
at
the
CT
level:
thus
determining
which
scale
is
more
appropriate
to
observe
Halifax’s
socioeconomic
conditions.
Using
the
Modifiable
Areal
Unit
Problem
(MAUP)
as
a
theoretical
lens,
I
analyzed
differences
between
conditions
at
the
CT
and
DA
levels.
The
MAUP
is
a
phenomenon
occurring
when
census
data
is
collected
for
individuals
but
is
reported
for
administrative
units
possessing
modifiable
boundaries.
Data
aggregation
mutes
extreme
values
and
obscures
diverse
socioeconomic
conditions
occurring
within
these
units.
The
MAUP
is
a
particular
issue
for
smaller
municipalities
and
rural
areas,
since
administrative
units
are
formed
on
a
larger
scale
than
in
big
cities
with
higher
population
densities.
Hence,
homogeneous
clusters
of
individuals
often
form
at
a
scale
smaller
than
the
administrative
unit
boundaries,
causing
diverse
clusters
of
socioeconomic
conditions
to
form
within
them1.
I
conducted
statistical
and
spatial
analyses
on
ten
socioeconomic
indicators,
comparing
their
characteristics,
relationships,
and
spatial
patterning
at
the
CT
and
DA
levels.
Descriptive
statistics
showed
that
for
all
indicators,
DA
level
data
is
more
dispersed
from
the
CMA
average
than
at
the
CT
level;
many
DAs
have
extreme
values
that
are
muted
when
these
values
are
aggregated
with
adjacent
DAs
to
form
CTs.
1
Lebel,
A.,
R.
Pampalon,
and
P.
Villeneuve.
2007.
A
multi-‐perspective
approach
for
defining
neighbourhood
units
in
the
context
of
a
study
on
health
inequalities
for
the
Quebec
City
region.
International
Journal
of
Health
Geographers
iii
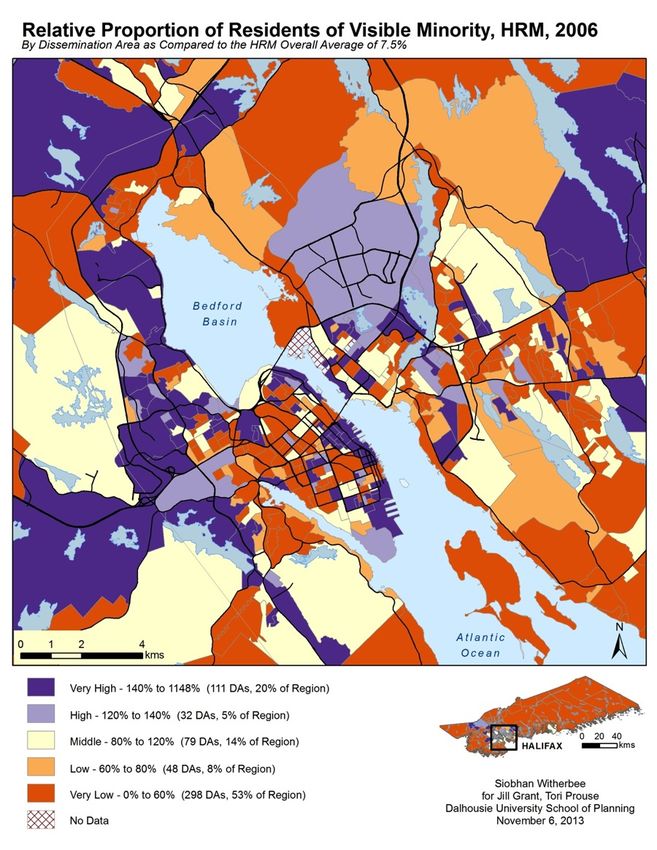
Percentages
of
visible
minorities
across
DAs
had
the
greatest
difference
in
dispersion
of
all
indicators
with
DA
level
proportions
being
81%
more
dispersed
than
at
the
CT
level.
I
also
compared
differences
in
relationships
between
indicators
using
Pearson’s
Bivariate
Correlations
and
Ordinary
Least
Squares
Regression
tests.
Results
from
these
tests
were
consistent
with
those
in
literature,
thus
affirming
the
influence
of
the
MAUP
on
Halifax’s
census
data.
At
the
CT
level,
we
obtain
stronger
correlations
between
variables
and
a
more
robust
regression
model
than
at
the
DA
level.
The
muted
CT
values
follow
more
consistent
trends
than
engendered
by
the
extreme
outliers
at
the
DA
level
where
it
becomes
more
difficult
to
generalize
relationships
with
definitive
conclusions.
However,
the
tests
show
a
more
complex
portrait
of
socioeconomic
conditions
and
relationships
at
the
DA
level;
more
relationships
are
deemed
‘statistically
significant’
–
we
can
confidently
ascertain
a
linear
relationship
exists
between
them
–
than
at
the
CT
level.
I
observed
similar
trends
in
the
spatial
analysis.
Stronger
dichotomies
between
contrasting
conditions
emerged
in
the
CT
level
maps,
with
categories
split
at
a
large
scale.
The
DA
level
maps
show
a
diverse
mosaic
with
DAs
displaying
adjacent
contrasting
socioeconomic
conditions.
At
the
DA
level,
we
observe
polarized
adjacencies:
spatially
proximal
concentrated
clusters
of
contrasting
conditions.
Polarized
adjacencies
are
obscured
when
the
extreme
DA
values
are
combined
to
create
values
for
the
overall
CT.
Sociospatial
polarization
emerges
much
more
frequently
through
polarized
adjacencies
at
the
DA
level.
Though
the
CT
and
DA
level
values
have
relatively
similar
frequency
distributions
across
indicators,
the
extreme
cases
at
the
DA
level
are
crucial
determinants
of
the
nature
and
severity
of
Halifax’s
sociospatial
polarization.
They
contribute
to
polarized
conditions
in
many
of
the
city’s
CTs,
causing
areas
exhibiting
extreme
deprivation
and
poor
socioeconomic
conditions
to
appear
less
severe.
Thus,
the
CT
model
is
suitable
for
economists
and
statisticians
who
seek
a
stronger
general
model
with
a
more
parsimonious
causal
structure,
or
for
the
NCRP
researchers
wishing
to
derive
general
comparative
paradigms
for
neighbourhood
change.
However,
for
the
purposes
of
policymakers,
scholars,
and
practitioners
concerned
with
socioeconomic
inequality
and
polarization
trends,
polarization
is
portrayed
much
more
intricately
through
the
DA
level.
All
indicators,
their
relationships
with
each
other,
and
their
spatial
manifestations
are
recognized,
even
if
their
impact
is
relatively
small
when
tests
are
conducted
for
the
CMA
as
a
whole.
When
we
restrict
analysis
to
conditions
within
the
CT,
these
weaker
relationships
encourage
extreme
polarized
adjacencies
between
DAs
and
have
significant
implications
on
the
lived
experiences
of
residents.
Therefore,
researchers
and
policymakers
must
be
wary
of
the
embedded
limitations
of
using
administrative
unit
data
to
represent
individual-‐level
conditions.
In
urban
policy,
census
data
is
used
for
informing
policy
changes,
forecasting
growth
projections,
allocating
community
infrastructure,
amenities,
and
services,
and
creating
sustainable
municipal
visions
for
the
future.
Misrepresentation
of
these
data
yields
deleterious
consequences,
including
the
misallocation
of
services.
Findings
emphasize
the
importance
of
robust
data
collection
measures
for
small
geographic
units.
iv
TABLE
OF
CONTENTS
1.0 Introduction
.........................................................................................
1
2.0 Background
..........................................................................................
4
2.1 Socioeconomic
Conditions
in
Canadian
Cities:
Situating
Halifax
in
the
Literature
.................................................................
4
2.2 Conceptualizing
“Neighbourhood”
................................................
6
2.3 Neighbourhood
Scale
and
the
Modifiable
Areal
Unit
Problem
(MAUP)
.........................................................................................
7
2.4 Sociospatial
Polarization
and
its
Micro-‐Determinants
..................
10
2.5 Neighbourhood
Polarization
and
the
Modifiable
Areal
Unit
Problem
........................................................................................
11
2.6 CMA
Size
and
the
MAUP
................................................................
12
2.7 Socioeconomic
Trends
in
Halifax:
A
Media
Review
.......................
13
3.0 Purpose
................................................................................................
14
3.1 Research
Questions
......................................................................
15
4.0 Method
................................................................................................
15
4.1 Study
Rationale
..............................................................................
15
4.1.1 Study
Concept
..............................................................
15
4.2 Data
Organization
..........................................................................
16
4.2.1 Data
Collection
.............................................................
16
4.2.2 Data
Selection
..............................................................
16
4.2.3 Data
Preparation
..........................................................
18
4.2.3.1 Statistical
Analysis
............................................
18
4.2.3.2 Spatial
Analysis
................................................
18
4.3 Data
Analysis
.................................................................................
18
4.3.1 Statistical
Analysis
........................................................
18
4.3.1.1 Descriptive
Statistics
........................................
18
4.3.1.2 Pearson’s
Bivariate
Correlation
.......................
18
4.3.1.3 Ordinary
Least
Squares
Regression
..................
19
4.3.2 Spatial
Analysis
............................................................
19
5.0 Findings
................................................................................................
20
5.1 Statistical
Analysis
.........................................................................
20
5.1.1 Descriptive
Statistics
....................................................
20
5.1.2 Pearson’s
Bivariate
Correlation
...................................
22
5.1.3 Ordinary
Least
Squares
Regression
..............................
25
5.2 Spatial
Analysis
..............................................................................
26
5.2.1 Description
of
Spatial
Trends
.......................................
48
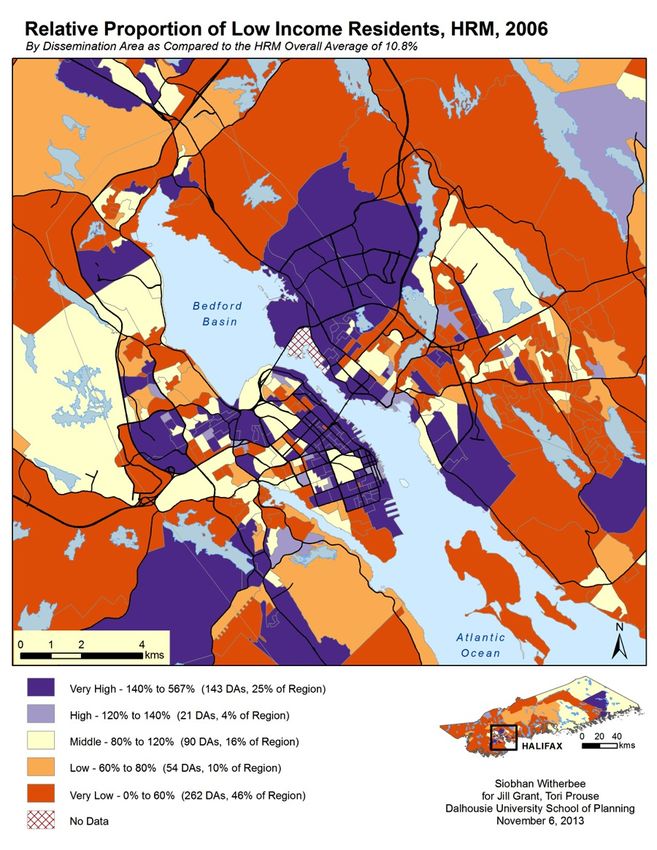
5.2.1.1 Relative
proportion
of
individuals
classified
as
low-‐income
(LICO)
...............................................................
48
5.2.1.2 Relative
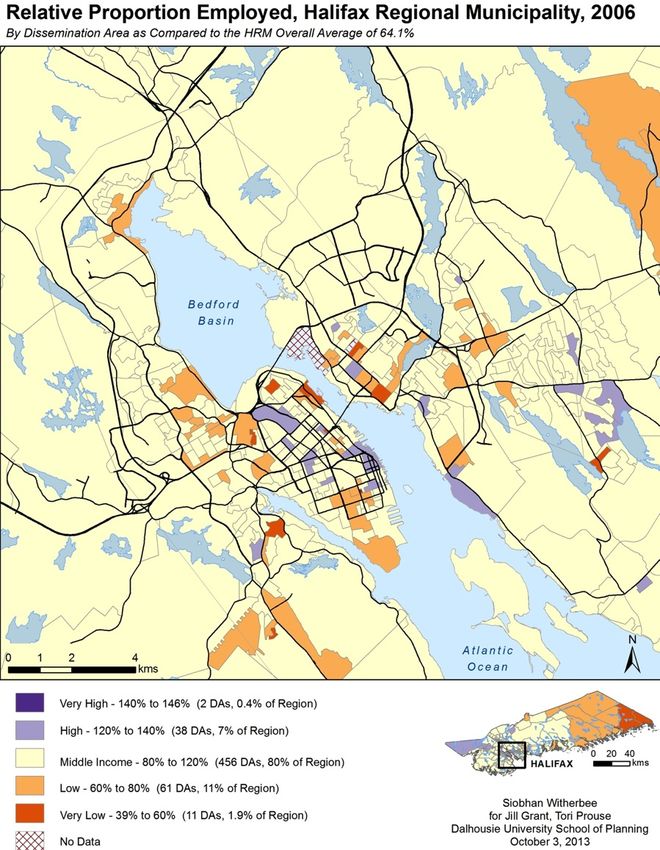
employment
rate
for
residents
over
15
(EMPLOY)
5.2.1.3 Relative
proportion
of
individuals
over
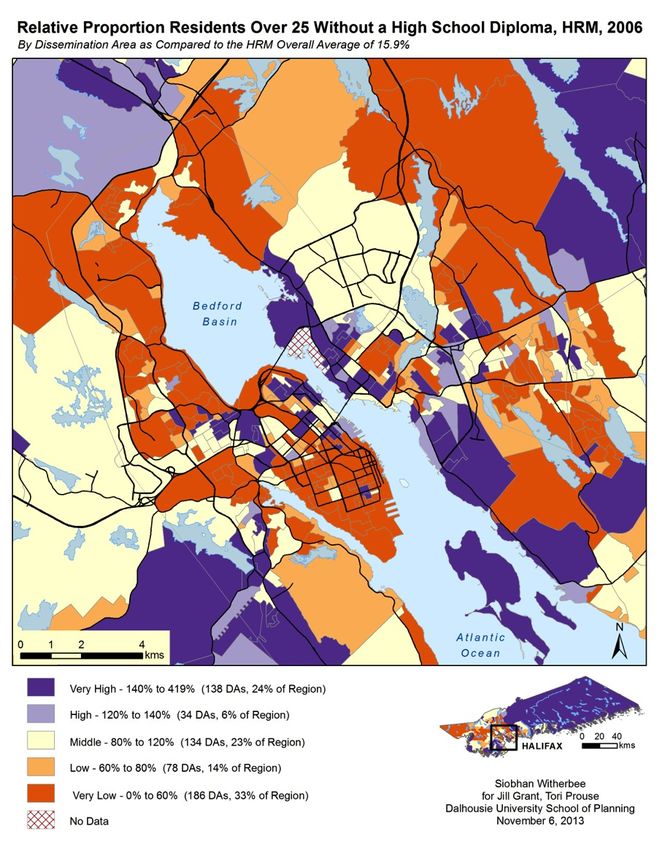
25
without
a
high
school
diploma
(NOHSD)
..................................
48
v
5.2.1.4 Relative
average
individual
income
for
residents
over
15
(AVGINC)
..........................................................
49
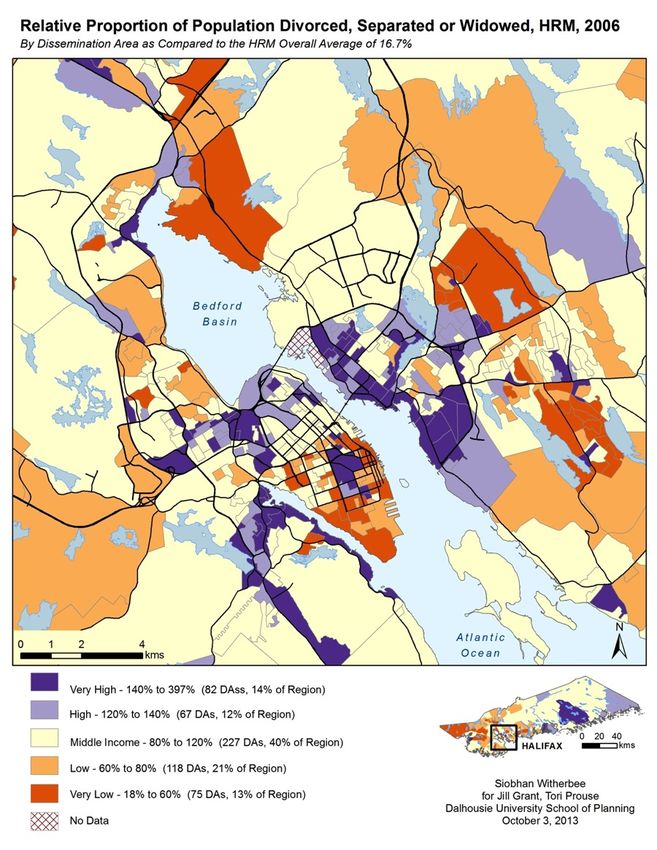
5.2.1.5 Relative
proportion
of
residents
over
15
separated,
divorced,
or
widowed
(SDW)
...........................
49
5.2.1.6 Relative
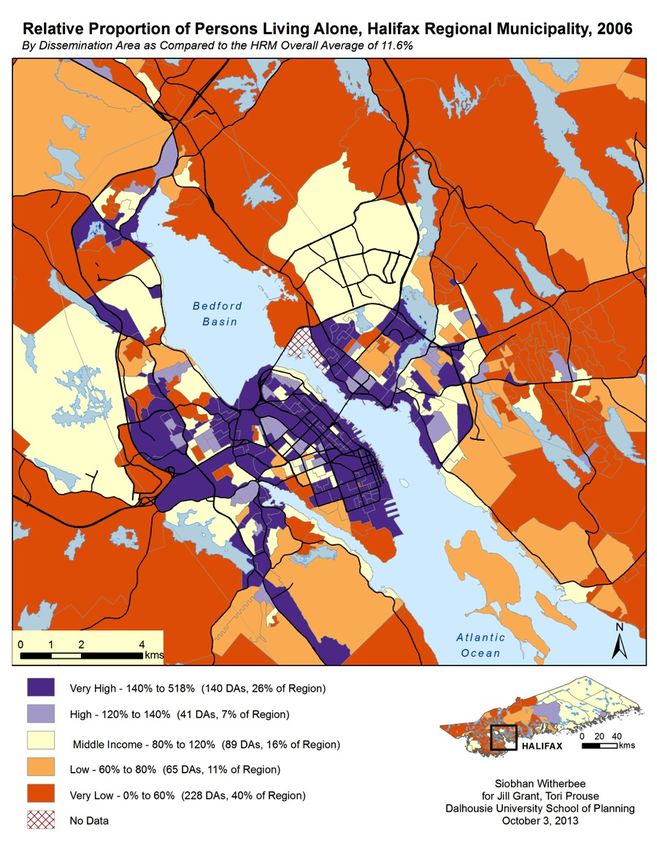
proportion
of
persons
living
alone
(PLA)
………………………………………………………………………49
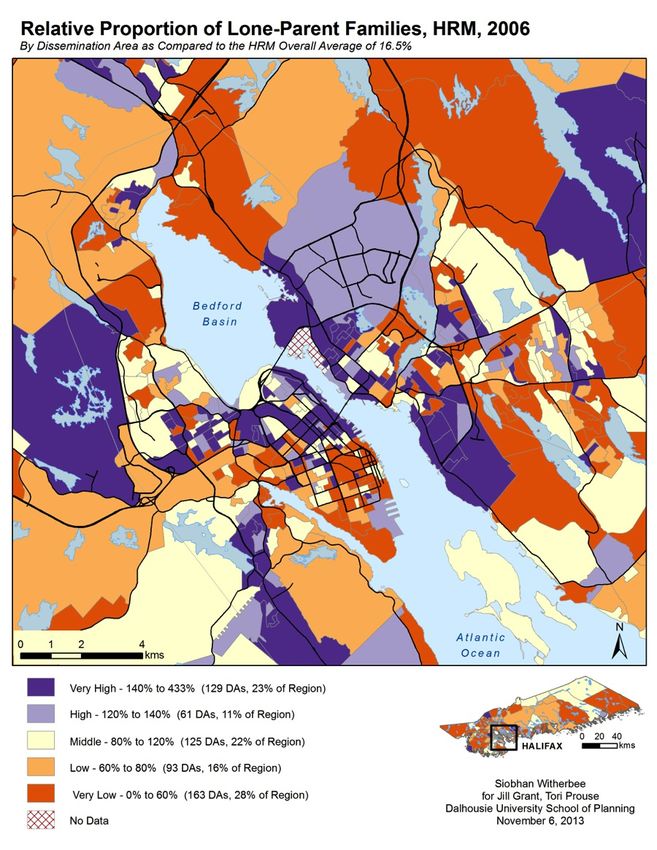
5.2.1.7 Relative
proportion
of
lone-‐parent
families
(LPF)
………………………………………………………………………50
5.2.1.8 Relative
proportion
of
visible
minorities
(VM)
………………………………………………………………………50
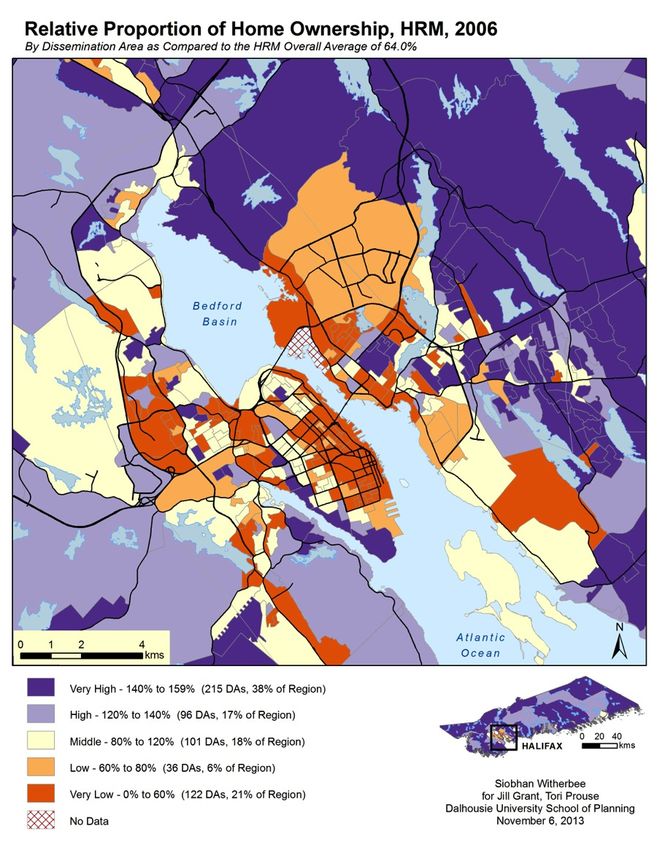
5.2.1.9 Relative
proportion
of
owned
private
dwellings
(OWNED)
………………………………………………………………………50
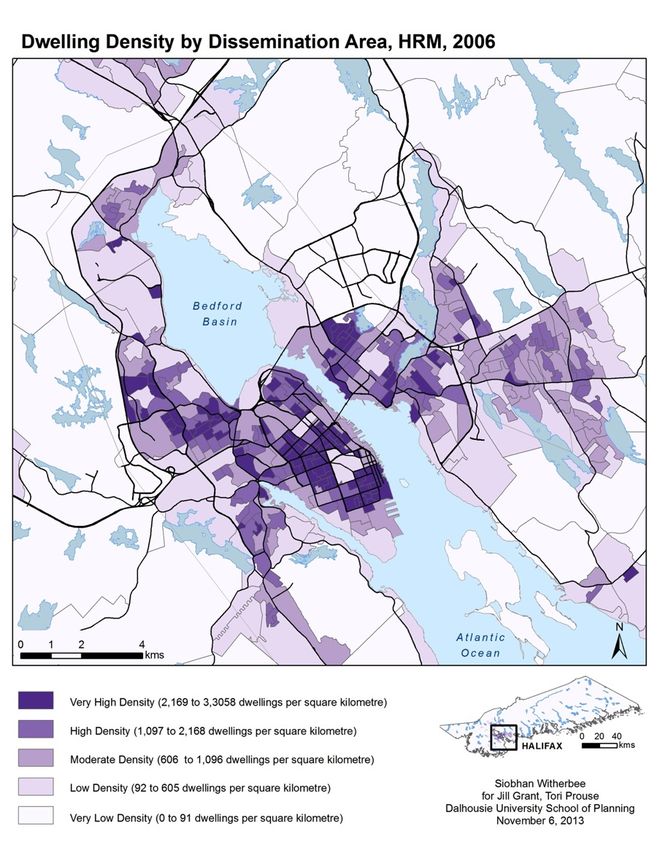
5.2.1.10 Relative
dwelling
density
(DWELDENS)
………………………………………………………………………50
6.0 Discussion
............................................................................................
51
6.1 Scale
Discrepancies
and
the
Modifiable
Areal
Unit
Problem
........
51
6.2 Understanding
the
nature
and
dynamics
of
sociospatial
polarization
in
Halifax
.......................................................................................................
52
6.2.1 Case
Studies
of
Polarized
Dissemination
Areas
within
Census
Tracts
...........................................................................
57
6.2.1.1 Census
Tract
10
................................................
57
6.2.1.2 Census
Tract
108
..............................................
58
6.2.1.3 Census
Tract
21
................................................
59
6.2.1.4 Census
Tract
25.01
...........................................
60
6.2.1.5 Census
Tract
114
..............................................
61
7.0 Conclusion
...........................................................................................
63
Works
Cited
...............................................................................................
66
vi
LIST
OF
TABLES
AND
FIGURES
Unless
otherwise
specified,
tables
and
figures
are
created
by
the
author.
Reference
Table
of
Socioeconomic
Indicators
................................................
vii
1.1 Settlement
Density
of
Halifax
Regional
Municipality,
2012
......................
1
1.2 Neighbourhood
Map
of
Halifax
CMA
core
...............................................
2
1.3 Distribution
of
Census
Tracts
by
Income
Category
of
Individuals
ages
15
and
over,
1970-‐2010
..................................................................................................
3
1.4 Change
in
Census
Tract
Average
Individual
Income,
1980-‐2010
...............
3
2.1
Gini
Coefficient
Values
for
NCRP
Study
Cities
...........................................
5
2.2
Testing
for
the
Modifiable
Areal
Unit
Problem:
Methodological
Approaches
in
the
Literature
.........................................................................................................
9
4.1
Reference
Table
of
Socioeconomic
Indicators
..........................................
17
5.1
Descriptive
Statistics
by
Scale
....................................................................
20
5.2
CT
Level
Pearson’s
Bivariate
Correlation
Coefficients
...............................
22
5.3
DA
Level
Pearson’s
Bivariate
Correlation
Coefficients
..............................
22
5.4
Comparing
Linear
Relationships
between
Proportion
of
Low-‐Income
Residents
and
Percentage
of
Owned
Dwellings
at
the
CT
and
DA
Level
................................
23
5.5
Comparing
LICO
Bivariate
Correlation
Coefficients
at
CT
and
DA
Level
....
24
5.6
OLS
Regression
of
LICO
on
Material,
Social,
and
Physical
Characteristics
.
25
5.7
Beta
Coefficients
of
Independent
Variables
at
CT
and
DA
Level
for
OLS
Regression
with
Y=LICO
............................................................................................
26
5.8
Relative
Proportion
of
Low-‐Income
Residents
by
CT,
2006
......................
28
5.9
Relative
Proportion
of
Low-‐Income
Residents
by
DA,
2006
......................
29
5.10
Relative
Employment
Rate
by
CT,
2006
...................................................
30
5.11
Relative
Employment
Rate
by
DA,
2006
..................................................
31
5.12
Relative
Proportion
of
Residents
Without
a
High
School
Diploma
by
CT,
2006
.........................................................................................................................
32
5.13
Relative
Proportion
of
Residents
Without
a
High
School
Diploma
by
DA,
2006
.........................................................................................................................
33
5.14
Relative
Average
Individual
Income
by
CT,
2006
.....................................
34
5.15
Relative
Average
Individual
Income
by
DA,
2006
....................................
35
5.16
Relative
Proportion
of
Individuals
Separated,
Divorced,
or
Widowed
by
CT,
2006
.........................................................................................................................
36
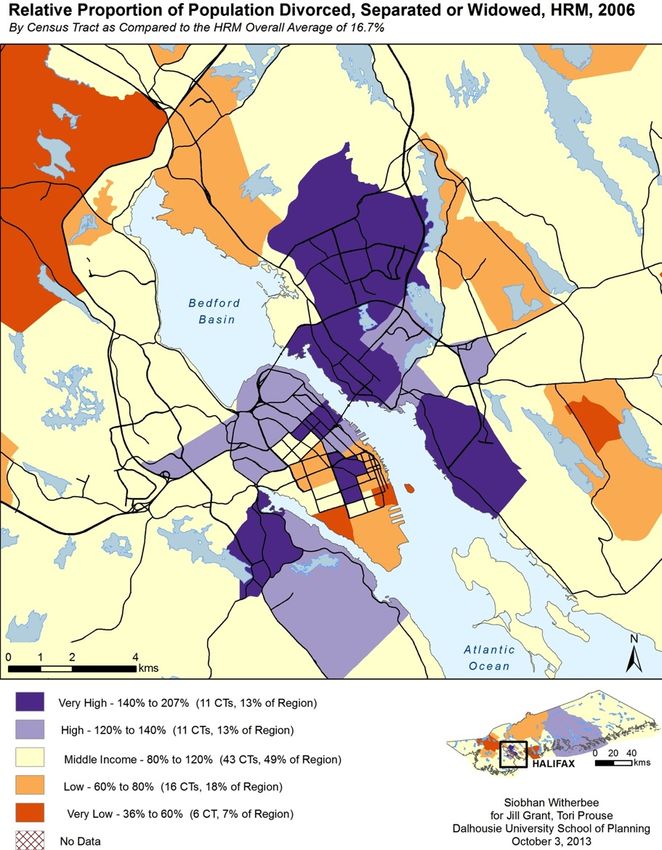
5.17
Relative
Proportion
of
Individuals
Separated,
Divorced,
or
Widowed
by
DA,
2006
.........................................................................................................................
37
5.18
Relative
Proportion
of
Individuals
Living
Alone
by
CT,
2006
...................
38
5.19
Relative
Proportion
of
Individuals
Living
Alone
by
DA,
2006
..................
39
5.20
Relative
Proportion
of
Lone
Parent
Families
by
CT,
2006
.......................
40
5.21
Relative
Proportion
of
Lone
Parent
Families
by
DA,
2006
.......................
41
5.22
Relative
Proportion
of
Visible
Minorities
by
CT,
2006
...........................
42
5.23
Relative
Proportion
of
Visible
Minorities
by
DA,
2006
............................
43
5.24
Relative
Proportion
of
Owned
Dwellings
by
CT,
2006
.............................
44
vii
5.25
Relative
Proportion
of
Owned
Dwellings
by
DA,
2006
............................
45
5.26
Relative
Dwelling
Density
by
CT,
2006
....................................................
46
5.27
Relative
Dwelling
Density
by
DA,
2006
....................................................
47
6.1
Relative
Proportions
of
Socioeconomic
Indicators
at
CT
Level
.................
53
6.2
Relative
Proportions
of
Socioeconomic
Indicators
at
DA
Level
.................
53
6.3
Proportion
of
Visible
Minority
Residents
in
2005
......................................
55
6.4
DA
Indicator
Values
in
Census
Tract
10
.....................................................
57
6.5
DA
Indicator
Values
in
Census
Tract
108
...................................................
58
6.6
DA
Indicator
Values
in
Census
Tract
21
.....................................................
59
6.7
DA
Indicator
Values
in
Census
Tract
25.01
................................................
60
6.8
DA
Indicator
Values
in
Census
Tract
114
...................................................
61
Reference
Table
of
Socioeconomic
Indicator
Acronyms
Component
Indicator
Description
Material
LICO
Percentage
of
individuals
classified
as
low-‐income
(after
tax)
NOHSD
Percentage
of
individuals
over
25
without
a
high
school
diploma
EMPLOY
Employment
rate
for
individuals
ages
15
and
over
AVGINC
Average
individual
income
for
individuals
ages
15
and
over
Social
SDW
Percentage
of
individuals
classified
as
separated,
divorced,
or
widowed
PLA
Percentage
of
individuals
not
in
census
families
living
alone
LPF
Percentage
of
economic
families
classified
as
single
parent
VM
Percentage
of
individuals
classified
as
a
visible
minority
Structural
OWNED
Percentage
of
private
dwellings
that
are
owned
DWELDENS
Dwelling
density
(total
number
of
private
dwellings
divided
by
total
land
area
in
square
kilometers)
Title
Page
Image
Source:
Google
Maps,
2012
viii
“The
ultimate
question
is
whether
a
geographical
area
is
an
entity
possessing
traits,
or
merely
one
characteristic
of
a
trait
itself”
(Gelhke
and
Biehl,
1934,
170)
1.0
INTRODUCTION
This
report
is
part
of
a
larger
study
on
neighbourhood
change
across
Canada.
The
“Neighbourhood
Change
Research
Partnership”
(NCRP)
examines
changing
neighbourhood
trends
in
income
inequality
and
polarization
in
six
Canadian
Census
Metropolitan
Areas
(CMAs):
Toronto,
Vancouver,
Calgary,
Winnipeg,
Montréal,
and
Halifax
Regional
Municipality.
In
2010,
the
NCRP
released
the
Three
Cities
of
Toronto,
a
report
documenting
patterns
of
sociospatial
polarization
in
the
city
from
1970
to
2005.
Using
time-‐series
analysis
of
census
data
indicators
–
age,
household
structure,
immigrant,
ethnicity,
income,
employment,
and
housing
(Hulchanski,
2011)
–
the
report
illustrates
the
changing
socioeconomic
welfare
of
neighbourhoods
throughout
this
35-‐year
period.
The
report
relies
on
what
they
define
as
the
“Three
Cities”
framework
to
explain
neighbourhood
change
on
a
more
general
level,
where
each
“city”
represents
census
tracts
that
are
experiencing
either
increasing,
decreasing,
or
stable
income
trajectories.
In
2013,
using
the
same
methodology,
the
Halifax
research
team
–
comprised
of
academics
and
community
stakeholders
–
launched
a
study
of
the
Halifax
CMA
(Prouse
et
al,
Forthcoming).
Halifax
Regional
Municipality
(HRM)
is
the
largest
city
in
Atlantic
Canada,
with
a
population
of
413
700
(Statistics
Canada,
2012).
In
1996,
the
City
of
Halifax
amalgamated
with
the
City
of
Dartmouth,
Town
of
Bedford,
and
Figure
1.1
Settlement
Density
of
Halifax
Regional
Municipality,
2012,
Calculated
Halifax
County.
from
HRM
Civic
Address
Point
Data
(Witherbee,
2013,
in
Prouse
et
al,
Forthcoming)
Figure
1.1
1
illustrates
   the
   disparity
   in
   settlement
   patterns
   throughout
   the
   region.
   HRM
   is

remarkably
   diverse,
   comprised
   of
   over
   200
   distinct
   communities
   of
   urban,
   suburban,

and
  rural
  character.
  Figure
  1.2
  shows
  some
  of
  Halifax’s
  neighbourhoods.


       Figure
  1.2
  Neighbourhood
  map
  of
  Halifax
  Census
  Metropolitan
  Area
  core
  (Witherbee,
  2013)


           Study
  findings
  (See
  Figure
  1.3
  and
  1.4)
  revealed
  mixed
  trends
  in
  the
  CMA
  overall,

with
  no
  strong
  evidence
  of
  increasing
  income
  polarization
  at
  census
  tract
  level.
  Equally

mixed
  findings
  emerged
  through
  analysis
  of
  Halifax
  through
  the
  “Three
  Cities”
  paradigm,

as
  Halifax’s
  census
  tracts
  showed
  surprisingly
  slight
  changes
  in
  income
  levels
  from
  1980

to
  2010.
  In
  many
  cases,
  trends
  were
  ambiguous
  and
  diverged
  from
  hypotheses
  derived

from
  local
  understandings
  of
  the
  lived
  reality
  of
  these
  spaces.


                                                                                                                                    2
Figure
1.3
Distribution
of
Census
Tracts
by
Income
Category
of
Individuals
ages
15
and
over,
1970-‐2010
(Prouse
et
al,
Forthcoming)
Figure
1.4
Change
in
Census
Tract
Average
Individual
Income,
1980-‐2010
(Cities
Centre,
2013;
in
Prouse
et
al,
Forthcoming)
3
The
research
team
speculated
whether
the
parameters
of
the
study
–
specifically,
census
tracts
as
the
units
of
analyses–
were
responsible
for
discrepancies
between
study
findings
and
observations
of
on-‐the-‐ground
conditions.
The
NCRP
uses
census
tracts
as
proxies
for
neighbourhoods
for
all
CMAs
included
in
the
study.
The
Halifax
research
team
identified
ambiguous
census
tract
(CT)
level
data
as
an
indicator
that
this
geographic
unit
is
an
unsuitable
lens
through
which
to
interpret
neighbourhood
change
in
smaller
municipalities
like
Halifax.
The
team
theorized
CT
level
findings
do
not
accurately
reflect
on-‐the-‐ground
conditions
in
Halifax’s
neighbourhoods.
Rather,
they
suggest
a
moderated
portrait
of
Halifax’s
geography
of
income
created
by
data
smoothing
from
aggregation
of
more
diverse
conditions
visible
at
a
finer
scale.
Further
investigation
is
required
to
determine
if
the
scale
of
aggregation
of
census
data
yields
a
crucial
methodological
limitation.
Examining
data
at
the
CT
level
reveals
very
high-‐income
census
tracts
clustered
in
the
South
End
and
in
Bedford,
and
low-‐income
census
tracts
grouped
in
the
North
End
and
Halifax’s
postwar-‐era
suburbs.
Census
tracts
with
average
individual
income
levels
consistent
with
the
CMA
average
comprise
the
rest
of
HRM.
However,
contextual
research
of
the
lived
reality
of
Halifax’s
neighbourhoods
challenges
the
legitimacy
of
this
simple
pattern.
In
Halifax,
CT
boundaries
frequently
encompass
heterogeneous
conditions
–
particularly
in
Halifax’s
suburbs
where
census
tracts
are
especially
large
and
administrative
boundaries
lag
behind
contemporary
patterns
of
population
growth
between
census
periods.
How
does
this
heterogeneity
impact
aggregated
census
data
values
for
each
CT?
Prouse
et
al
posit
that
dissemination
area
level
analysis
may
reveal
a
more
fine-‐grained,
complex,
and
accurate
portrait
of
Halifax’s
geography
of
income
inequality
and
polarization
across
neighbourhoods.
The
inconclusive
findings
engendered
the
following
theoretical
questions:
how
are
neighbourhoods
defined,
and
do
neighbourhoods
function
at
the
same
scale
regardless
of
city
size?
2.0
BACKGROUND
2.1
Socioeconomic
Conditions
in
Canadian
Neighbourhoods:
Situating
Halifax
in
the
Literature
Neighbourhoods
are
highly
complex
and
peculiar
entities.
For
more
than
a
century,
the
study
of
these
spaces
and
their
trajectories
has
captivated
and
perplexed
scholars
–
both
in
terms
of
socioeconomic
and
cultural
transformations
occurring
within
these
spaces,
and
in
creating
theoretical
parameters
defining
the
neighbourhood
unit
itself.
Framed
through
key
themes,
studies
examining
neighbourhood
conditions
and
change
in
Canadian
cities
have
expanded
over
the
past
thirty
years.
In
the
1980s,
research
emerged
examining
cities
through
the
lens
of
urban
renewal
–
specifically
inner
city
revitalization.
Ley’s
national
studies
on
inner
city
revitalization
(1988)
and
gentrification
(1985)
provide
comparative,
macro-‐level
data
on
socioeconomic
change
in
Canada’s
large
cities.
Filion
and
Bunting
(1990)
examine
change
occurring
in
the
older
housing
stock
of
large
CMAs.
Bourne
(1982),
Bunting
(1984),
Filion
and
Bunting
(1990),
and
Millward
and
Bunting
(1998;
1999)
contributed
to
early
Canadian
neighbourhood
4
You can also read