COMPUTER SCIENCE HELPS SHIELD EARTH FROM ASTEROIDS - Bruce Yellin Data Center Architect - EMC ...
←
→
Page content transcription
If your browser does not render page correctly, please read the page content below

COMPUTER SCIENCE HELPS SHIELD EARTH
FROM ASTEROIDS
Bruce Yellin
Data Center Architect
BruceYellin@yahoo.com
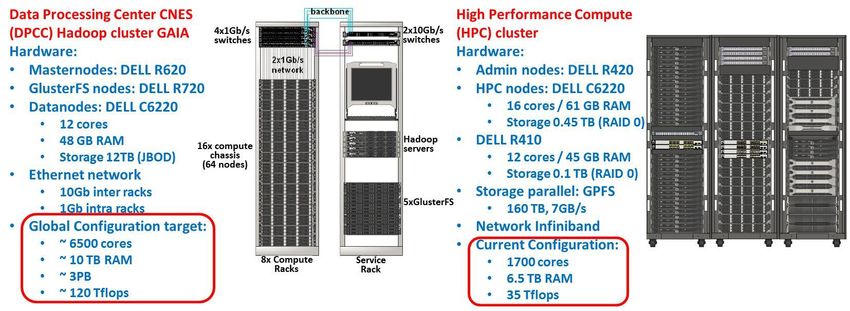
Table of Contents
The Threat ................................................................................................................................. 5

Finding The Threats: A Brief History of Asteroid Detection ......................................................... 7

How Do We Find Asteroids Today? ..........................................................................................10

 Optical Telescopes ................................................................................................................10

 Charge-Coupled Device – CCD .........................................................................................11

 Radio and Radar Telescopes ................................................................................................13

 Ground-Based Telescopes ....................................................................................................15

 Large Synoptic Survey Telescope - LSST - Optical Telescope ..........................................15

 Asteroid Terrestrial-impact Last Alert System – ATLAS – Optical Telescope .....................17

 Satellite Telescopes ..............................................................................................................18

 NEOWISE – Optical Telescope..........................................................................................18

 Gaia Space Telescope – Optical Telescope.......................................................................20

 The Square Kilometer Array – Mankind’s Largest Big Data Challenge – Radio Telescope 22

Using Hadoop To Spot An Asteroid...........................................................................................27

3D Asteroid Modeling – Try It Yourself! .....................................................................................28

Taking Action ............................................................................................................................29

High-Performance Computing and Big Data .............................................................................34

Conclusion ................................................................................................................................38

Appendix - Glossary ..................................................................................................................40

Appendix – Draw an Ellipse in Excel .........................................................................................41

Footnote....................................................................................................................................42

Disclaimer: The views, processes or methodologies published in this article are those of the
author. They do not necessarily reflect EMC Corporation’s views, processes or methodologies.

2016 EMC Proven Professional Knowledge Sharing 2
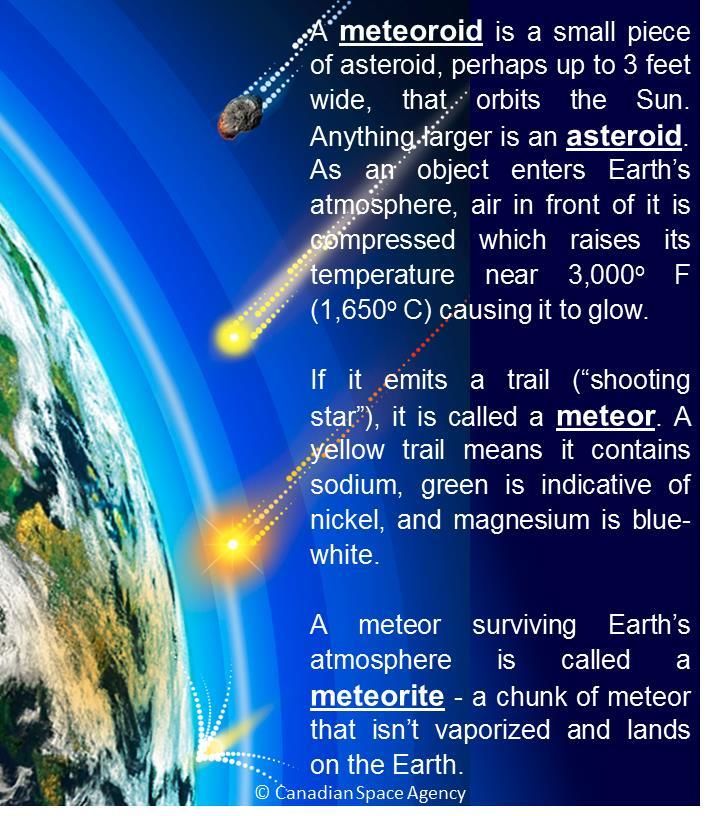
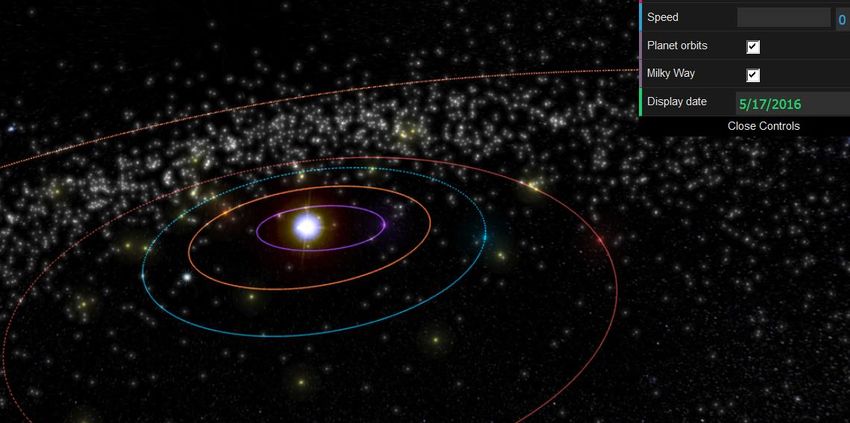
Earth is facing an asteroid threat from outer
space, and it isn’t the Arachnids of Klendathu
from the 1997 science fiction film Starship
Troopers hurling them at our planet. It is a real
threat from one of the hundreds of millions of
asteroids that orbit the Sun and travel between
Mars and Jupiter and beyond. In essence,
Earth sits in an asteroid shooting gallery.

Many were caught off guard early Friday, February 15,
2013, when a medium-sized 66-foot wide meteoroid
weighing 28 million pounds (13,000 metric tons)
approached Earth at 43,000 mph1. (Meteoroids traveling at
160,000 mph can enter the atmosphere, eventually
decelerating to a much slower speed2.) Coming in at a
steep 30o angle3, friction made it glow 23-29 miles above
the ground, and it exploded in the atmosphere 18 miles
over Chelyabinsk, Russia, producing a Sun-bright light.

With kinetic explosive energy greater than 20-30
WWII atomic bombs, the shockwave broke glass
 Chelyabinsk Asteroid Orbit Earth at Impact
windows and hurt nearly 2,000 people4.
Astronomers never saw the meteoroid coming – it
was just too small and it came from behind the Sun Sun

so Earth’s telescopes could not detect it. This orbit Venus orbit Earth
 orbit
diagram, constructed after the event, shows the path
in yellow-green5. Current estimates indicate there Mars
 orbit

could be as many as 80 million “rocks” of this size6.

“…it came dangerously
 In a short 8 day period from March 4-11, 2014, four asteroids silently
close to wiping us all approached Earth. The largest would have likely wiped out a city the
out.” – Prof. Brian Cox
 size of London. On March 4, a 380-foot asteroid called “2014 DU110”
came within 13 million miles of Earth. The next day, an asteroid discovered by telescope only 5
days earlier named “2014 DX110” passed the Earth from about the same distance as the Moon.
Given the vastness of space, many would call this a near-miss. On March 6, a 100 foot “2014

2016 EMC Proven Professional Knowledge Sharing 3
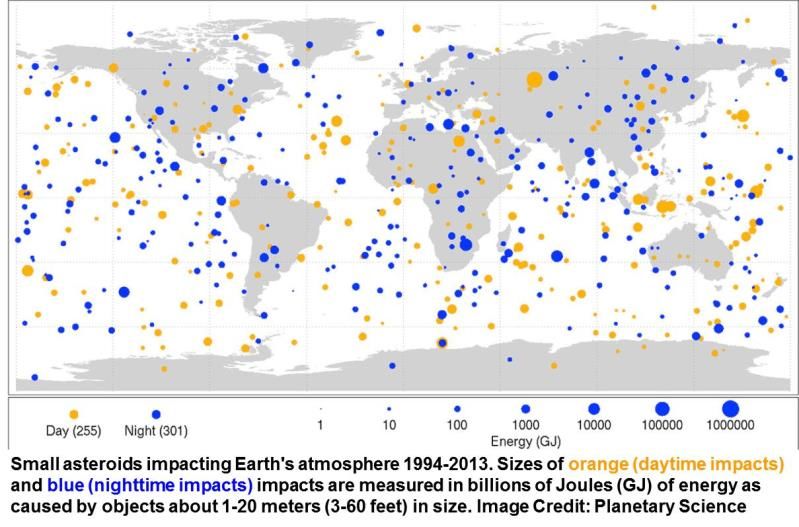
EC” asteroid (orbit diagrams to the
right7), discovered only 2 days
earlier, came within 38,300 miles of
our planet – less than 1/6th the
distance to the moon and just above
the 22,000 mile geosynchronous
orbit of some satellites. According to
University of Manchester physicist
Dr. Brian Cox, there is an “asteroid with our name on it” and it is only a matter of time before an
asteroid large enough to wipe out the human race collides with Earth.”8

Asteroid impacts are not rare. While
the chance that a large one will
obliterate a city is once in a century9,
this map shows a total of 556
impacts from 1994-2013, with 26
asteroids, containing a force of 1 to
600 kilotons of TNT, exploding in the
atmosphere. By contrast, the
Hiroshima atomic bomb equaled 15
kilotons of TNT. One might conclude
our current strategy to protect the planet consists of “blind luck”.

In 1908, an asteroid perhaps as big as “2014 CU13” exploded 3-6 miles above the city of
Vanavara, Russia. Called the Tunguska Event, it destroyed a 770 square mile area about 2,200
miles west of Moscow. The damage equaled 10-15 megatons of TNT (over 1,000 times the
energy of the WWII atom bomb).
An explosion of that magnitude
over a heavily populated area like
New York City would wipe it out,
kill perhaps a million people, create
an unparalleled ecological disaster
and plunge the world’s economy
into chaos10.

2016 EMC Proven Professional Knowledge Sharing 4
Sixty-five million years ago, as noted by the Alvarez hypothesis11, an asteroid 6-7 miles in
diameter (10-12 kilometers) traveling at 45,000 mph (20
km/s)12 struck offshore near the Yucatán Peninsula with the
force of three billion WWII atomic bombs13. It created a 15-mile
deep, 110-mile wide Chicxulub (Chi’-shoo-loob) crater and a
100-meter (328 feet) tsunami. The impact triggered the
planet’s fifth mass extinction event14, eradicating dinosaurs
and most other species15, and marked the end of the 350 million-year-old Age of Reptiles16.

Asteroids of this size hitting Earth would convert kinetic energy into an instantaneous inferno
with “hot-coal colored” rocks shooting into the sky eventually causing global firestorms. Ash
would fill the air and block out the sun. Food and breathable air would be gone. If this happened
today, perhaps landing further offshore, U.S. Gulf states like Florida, Alabama, Mississippi,
Louisiana and Texas might disappear underwater. The human race would be extinct.

While astronomers believe the chances of a devastating strike is BIG DATA “When
unlikely, it seems inevitable. And if one does hit, mankind would be accumulated data
 exceeds the capacity or
eradicated. Earth needs an approach that gives scientists and leaders capture rate of local
 resources, local storage
enough notice to deflect an asteroid when it is millions of miles away. and manipulation is
We are scanning the skies for asteroids. We have plans to protect the impractical at best,
 17
 impossible at worst.”
human race. Asteroid defense is a big data analysis problem.

The Threat
Asteroids are minor planets that orbit our part of the Solar System in 4 distinct regions. The
main asteroid belt contains millions of bodies 200 million miles from the Sun and is found
between the orbits of Mars and Jupiter18. There are
 The main asteroid
also Trojan groups which pace and follow Jupiter by belt is 100 million
 miles wide and
±60o, a Kuiper belt or region which ranges from 111 million miles
 from Earth
2,800 to 4,650 million miles away19, and the Oort
cloud which is thought to be 100,000 AU or 9,300 The Trojan Venus
 Jupiter Group of Mercury
 20 asteroids
billion miles from the Sun . This image shows the
 Earth
 Mars
expected location of the main asteroid belt (shown in
red/pink in this diagram) and the Trojan group (green
in the diagram) on June 28, 201621.

2016 EMC Proven Professional Knowledge Sharing 5
While most asteroids “peacefully” orbit the
Sun, there are those that travel through our
inner solar system and are of primary concern
should they strike the Earth. These are called
Near Earth Asteroids (NEAs), and when
combined with Near Earth Objects (NEOs)
such as satellite debris, create a hazard
ranging from fireballs in the sky to the dinosaur
extinction documented by Alvarez.

For the most part, asteroids are 4.5 billion-
year-old rotating, irregular solar system
building blocks. They are sometimes called
planetoids. Comprised of clay, silicates, and
nickel-iron, they can weigh from 1,200 billion
billion tons (5,000 times lighter than Earth)22 in the case of the largest called Ceres, down to the
 Asteroid Size
Diameter Quantity
 weight of a car or even a pebble. They can also be as
A few hundred miles Several dozen large as Ceres’s 590-mile diameter (Earth’s diameter is
Tens of miles Hundreds
A few miles Thousands 7,918 miles). About 10 million NEAs are larger than 10
Large fraction of a mile Tens of thousands
Small fraction of a mile Hundreds of thousands
 meters wide while many millions of asteroids are tiny
http://cseligman.com/text/asteroids/sizedistribution.htm with little mass.23

Current asteroid hunting initiatives mainly scan space for objects larger than 1 kilometer – 3,280
feet – or about 500 feet higher than Burj Khalifa in Dubai, the world’s tallest building.
Astronomers estimate they have found about 95% of civilization-ending asteroids24.

With Asteroids 30 feet wide passing near our Moon every week, a study that examined the last
20 years of data from global nuclear weapons testing sensors concluded that perhaps 60
asteroids approaching 20 meters in size have hit Earth's atmosphere, exceeding previous
estimates25. In 2005, the U.S. Congress instructed NASA to find 90% of the asteroids 140
meters wide (1.5 football fields long) by the year 202026, but as of late 2014, they have only
found 10% of them27. There is no mandated program for asteroids smaller than 500 feet long.

The Minor Planet Center (MPC) maintains a database of over 140 million asteroid observations
and tracks over 700,000 asteroids28. Orbit calculations must be constantly revised because they
change (for example, when objects collide). The following Hubble Space Telescope image

2016 EMC Proven Professional Knowledge Sharing 6
shows the 460-foot diameter asteroid “P/2010 A2” gaining a dust and
gravel trail after being struck by another asteroid29, undoubtedly
changing its orbit. It is presently beyond our “big data” technology to
comprehensively monitor all of the main asteroid belt activity.

An asteroid’s path can also be altered by the Yarkovsky effect – when the Sun warms an
asteroid, the heat is dissipated in another direction as it rotates30. Accurate orbit predictions
require everything is tracked. From Earth, one way to track an asteroid’s rotation is by observing
the timing of light reflecting off its surface. Spherical asteroids have a fairly constant amount of
reflected light31. Asteroid occultation, occurring when an asteroid passes in front of a star
temporarily blocking its light, can also help us measure its size, shape and exact position32.

Finding The Threats: A Brief History of Asteroid Detection
If astronomers could predict meteoroid and asteroid strikes years in advance, Earth would
conceivably have time to prepare for the disaster or possibly even prevent it. It all starts with
finding the threats and the first such discovery occurred in 1801.

 An Italian astronomer, Giuseppe Piazzi, was in Palermo searching the
 Italian sky with the telescope to the left, looking to prove a then-
 prevailing theory that a planet orbited between Mars and Jupiter33. He
 recorded the position of a small dot of light on January 1, 1801, along
 with angular measurements and exact times as shown in the table below. (A
precursor to today’s rows and columns in Excel and database theory, the use of data tables to
record information can be traced to
the Sumerians of 3100 BC34). He
wasn’t sure if it was a star or a
comet35. On subsequent nights, he
observed the dot move from its
original position and in front of
known stars. Overall, he made 22
observations of a large object for 41
days until it disappeared behind the
Sun on February 11, 1801. He named the object Ceres Ferdinandea in honor of the Roman era
goddess of agriculture (Ceres or Cerere in Italian) and King Ferdinand of Sicily36, although it

2016 EMC Proven Professional Knowledge Sharing 7
was later known as Ceres. After publishing his data, other astronomers tried to find the object in
the August and September sky, without success.

A 24-year old German mathematician, Carl Friedrich Gauss, studied the complex
problem, taking into account that Piazzi’s observations were made from (1) Earth’s
24-hour circular rotation (2) while the planet is moving along an elliptical orbit around
the Sun and (3) the motion of the object also orbited the Sun. Gauss needed to
understand the object’s orbit through an ever changing, time-sensitive set of motions.

In general, the orbit of a planet or asteroid is based on how close it resembles a
circle, ellipse or parabola. This is called eccentricity and is the deviation from a
circle with an eccentricity of 0. A hyperbola has an eccentricity of 2, a parabola
 has an eccentricity of 1, and an ellipse is
 Aphelion Perihelion between a parabola and a circle.
 Asteroid
 [NOTE: If you would like to try your hand
 Semi-major
 Sun
 axis at constructing an ellipse, please see the appendix.] No
 one knew what type of orbit Ceres was following, but Gauss
assumed it was elliptical - i.e. an eccentricity between 0 and 1. Mathematicians and
astronomers had no known methods to compute an elliptical orbit from available observations.

From Piazzi’s 22 observations, Gauss decided to work with only three Ceres
 37
from January 2, January 22, and February 11 . The actual orbit of the
Earth was well understood in 1801, so Gauss could pinpoint Piazzi’s Ceres

position for these Ceres Piazzi Gauss Calculations Ceres
 Observation Time Right
observations. Using the exact Date HH:MM:SS Ascension Declination
 Jan 2, 1801 08:39:04.6 51º 47′ 49″ 15º 41′ 05″
time to the fraction of a
 Jan 22, 1801 07:20:21.7 51º 42′ 21″ 17º 3′ 18″
second, and two angles down Feb 11, 1801 06;11:58.2 54º 10′ 23″ 18º 47′ 59″

to the tenths of seconds of arc,
 Jan 2
but lacking the distance from
Palermo to the white dot,
 Jan 22
Gauss was able to construct
11 equations in 6 unknowns
 Feb 11
and solve this complex problem using a “least squares” approximation
method he had developed years earlier to analyze the Moon’s orbit.

2016 EMC Proven Professional Knowledge Sharing 8

Least squares can help estimate an orbit when there are many
 unknown equations. It is often used to determine the
 approximate shape and direction of a best fitting curve with a
 given set of points. This is done by minimizing the sum of the
 squares of the offsets of the data points. On the left is an
 example of red data points and the resulting blue curve that
 could be drawn as the line that would best represent the points.
 In Gauss’s case as
 shown on the right,
 using just 3
observation points could mean the object is traveling
through space in a circular, parabolic, elliptical, or
hyperbolic curve. Gauss leveraged the work of
Johannes Kepler almost two centuries earlier and
assumed Ceres followed an elliptical orbit.

On November 25, 1801, astronomers were able to find Ceres in the sky not far from where
Gauss had predicted it would be38. The basis of Gauss’s calculations is still used today to
calculate post-flight trajectory simulations of solid and liquid fueled rockets39.

As an asteroid, it was soon given the name “1 Ceres” as early discoveries were given a number
followed by a mythical name such as 2 Juno, 3 Pallas, 4 Vesta, and so on40. Over time, the
MPC adopted other naming conventions including a provisional designation and a permanent
designation. These Example: The meaning behind the name of asteroid "2012 DA14"
 Year 2012
names can be confusing.
 First A B C D E F G H J K L M N O P Q R S T U V W X Y
To the right is an Letter J F M A M J J A S O N D
 J a F e M a A p M a J u J u A u S e O c N o D e
explanation of the a n e b a r p r a y u n u l u g e p c t o v e c
 D
 n b r r y n l g p t v c
provisional designation 1 1 1 1 1 1 1 1 1 1 1 1
 1 6 1 6 1 6 1 6 1 6 1 6 1 6 1 6 1 6 1 6 1 6 1 6
for asteroid “2012 DA14”
 Second A B C D E F G H J K L M N O P Q R S T U V W X Y Z
discovered on February
 Letter A 1 2 3 4 5 6 7 8 9 10 11 12 13 14 15 16 17 18 19 20 21 22 23 24 25
23, 201241. Permanent
 Subscript 14 Multiply the number by 25 and add 1. So 14 becomes 14*15+1 = 351
numbers are assigned by As a result, asteroid "2012 DA14" was the 351st object found in 2012 in the 2nd half of February

the International Astronomical Union (IAU) when the object has enough observations to ensure
it can be found at another time.

2016 EMC Proven Professional Knowledge Sharing 9
How Do We Find Asteroids Today? Telescopes are designed to receive frequencies of electromagnetic waves called wavelengths. We are very familiar with the visible light wavelength that allows us to see colors in the 400–700 nanometer (nm) frequency Wavelengths range , but there are many wavelengths that we cannot see. There are shorter X-ray and ultraviolet wavelengths, as well as longer infrared and radio wavelengths. Optical telescopes are either ground-based or space-based, use lenses, and are generally designed to capture light in the infrared through X-ray spectrum. Their images can be affected by atmospheric distortions, so they are often located on high mountain tops to minimize the interference, or in space42. Asteroids appear much brighter in infrared than in visible light.43 Radio telescopes are only found on Earth, and use parabolic receivers to capture long wavelengths. Asteroids that reflect sunlight can be seen by optical telescopes while very dark non-reflective asteroids are best viewed by a radio telescope. This set of Crab Nebula images shows the amount of information available in each of the wavelengths44. radio wave infrared visible light ultraviolet X-ray Optical Telescopes There are three basic types of optical telescopes – refractor, reflector, and compound. Refractor telescopes have a large glass lens on its farthest end allowing light to be bent (refracted) to the focal point and magnified when viewed through the eyepiece45. Issac Newton invented the reflector telescope. Light bounces (reflects) off a rear mirror until it reaches a 2016 EMC Proven Professional Knowledge Sharing 10
flat mirror. It is then directed to the eyepiece after reaching the focal point. The compound or catadioptric telescope uses reflecting and refracting to reduce optical error. Light is bounced off a curved lens in the back, then bent by a lens towards the front, and finally sent backward again through its focal point and out the eyepiece. Charge-Coupled Device – CCD This miracle of integrated circuits revolutionized the world of photography and optical telescope-based astronomy. Up until 1980, modern astronomers relied on film cameras. Invented at Bell Labs in 1969 for use as a memory device46, the CCD ushered in the era of digital photography, which meant images could be transmitted and digitally stored on a disk. This is the same camera technology that we now take for granted in our smartphones. Whereas film uses silver halides suspended in an emulsion to capture certain wavelengths of photons, the silicon CCD transforms wavelengths into electric signals. Without the CCD and powerful processors with large memory capacity, telescopes such as the Hubble Space Telescope would be near impossible if it relied on film for imagery. A CCD contains an array of photodiodes that essentially absorb photons of light and convert it into a measurable electrical charge47. Comprised of silicon, they absorb photons and store them like a capacitor such that the greater the number of photons, the higher the electrical charge. In rapid succession, single pixels contained in shifting rows of image information are processed by dedicated circuits and handed off to a serial shift register – something that assembler language programmers are very familiar with. Electron packets accurately timed by a horizontal shift register clock are shifted one row at a time to an output amplifier which registers the photodiode charge. When the array has been exposed to light, the values are stored in memory - see the illustration to the left48. 2016 EMC Proven Professional Knowledge Sharing 11
The CCD memory images are bitmap (raster) graphics – a series of black and white dot (pixels).
The images lend themselves to a
table layout similar to Excel’s (x, y)
 A 1-bit asteroid
addressing scheme of rows,
 representation
columns, and cells. This allows the
data to easily be manipulated using
most computer languages. In this 0 0 0 0
 0 1 1 0
simple example, you see a = 0 0 1 1
magnified asteroid shape translated
 0 0 1 0
into a 1-bit matrix image of zeroes
and ones. With an 8-bit image, up to 256 shades of gray can be represented in each cell based
on the electron charge of each pixel. More bits equal higher resolution and a larger disk storage
requirement.

 Wavelength
Photodiode material nm
 The material used to build the CCD photodiode dictates the
Silicon 190–1100 wavelength it records. For example, a silicon photodiode
Germanium 400–1700
Indium gallium arsenide 800–2600 captures visible light in the 190 - 1100 nm electromagnetic
Lead(II) sulfide
Multi-chip mosaics are a cost-effective way to gain the
advantages of a much larger CCD or can be used to build
a camera with far greater resolution than might be
available with a single chip design. The image to the right
is from the wide-field Chilean VLT Survey Telescope that
uses 32 CCD chips, each with 2K x 4K pixels, making the
entire mosaic a 16K-by-16K, or 268 megapixels52.

Radio and Radar Telescopes
All telescopes capture
photons. Optical telescopes
capture photons with a
wavelength of about 390-
700 nm (purple to red) and
record them with a CCD
camera. Radio telescopes capture the longest wavelengths, typically 1 millimeter up to
hundreds of meters, and do not use a CCD camera.

Even though the same object in the sky emits
photons across all wavelengths, our eyes can only
process certain wavelengths – i.e., we cannot see
or hear a radio wave. The parabolic shape of the
radio dish antenna focuses the low energy photons
at the antenna. The antenna absorbs the energy
and hands the weak space signal to an amplifier.
From there, the signals are usually recorded on a
disk drive and processed by computer.

Radio telescopes detect asteroids (or any other
object) by initially sending a signal into space, and if
it bounces off an asteroid, the antenna receives that
signal – a “ping” and “echo”. The amount of time the
radio wave takes to make the round trip is used to calculate the distance from the dish to the
asteroid. The technique is called ranging and is the basis of RADAR (Radio Detection and
Ranging).

2016 EMC Proven Professional Knowledge Sharing 13
The following set of 5 images is based on the work of Emily Lakdawalla53 and depicts a radio dish sending a signal towards the asteroid . The asteroid is moving, rotating and irregularly shaped. The signal bounces off the closest part of the asteroid first , with subsequent waves bouncing back as they reach the farthest portions of the asteroid . As the dish receives and processes the reflected signals, a waveform image of the asteroid begins to appear . Eventually, the dish receives the entire reflected signal, including those parts bouncing off the farthest face of the asteroid . Signal reflects Signal reflects from closest from closest parts parts of of asteroid first asteroid first Reflected wavelengths compressed from parts rotating Radio dish sees Radio dish towards antenna, return signals at sends extended from many wavelengths signal parts rotating around broadcast away one wavelength wavelength wavelength broadcast wavelength broadcast wavelength broadcast wavelength time time time Since the object is irregular, rotating, and moving (left to right, near to far, etc.), the imagery taken over days would show multiple facets of the asteroid. For example, in this radar image taken of asteroid “2007 PA8”, these 9 reflected images were taken over a 2 week period and show multiple sides of this rotating and moving object. From the orbit diagram of November 5, 2012, the asteroid came within 0.0472 AU or 4 million miles from the radar dish on Earth54 (Earth’s “white” orbit appears next to the 2007 PA8 “blue” orbit.) The processing of the radar image would be able to estimate the size of the asteroid and its movement since the radio signals are transmitted and received at the speed of light. With a radar telescope, astronomers are not tied to reflective sunlight or radiation. By bouncing a signal off an object, day or night, clear sky or cloudy, the object is illuminated by reflected radio waves allowing them to evaluate its intensity, direction, orbit and other deduced data. 2016 EMC Proven Professional Knowledge Sharing 14
Ground-Based Telescopes
Telescopes can be located on Earth or in space, with pros and cons for each approach. For
example, Earth-bound telescopes can use very large mirrors such as the 10-meter mirror in the
Keck Observatory in Hawaii whereas the Hubble Space Telescope uses a 2.4-meter mirror.
Larger mirrors gather more light and ground telescopes generally cost less. Space-based
telescopes are free from Earth’s atmospheric distortions and can capture greater wavelengths
of light that would normally be filtered out by our atmosphere55. With that in mind, let’s take a
look at some of the major telescopes in use and their standing in the big data era.

Large Synoptic Survey Telescope - LSST - Optical Telescope
Scheduled to be operational in January 2022, the LSST’s goal is
to photograph space from Earth every few nights to find asteroids
and perhaps unlock the nature of dark energy. Using a wide field
of view telescope to record images to its 3.2 gigapixel CCD
camera, the LSST will take about 800 panoramic images a night
equaling 15 TB of raw data every day56. To put that into
perspective, the Sloan Digital Sky Survey (SDSS) in 2000 gathered in just a few weeks more
data than throughout the then-history of astronomy. In a matter of a few days, the LSST gathers
more data than the entire SDSS project57.

Over its ten year mission, hundreds of petabytes will be processed to produce 60 PB of data
and a 15 PB database catalog, thereby creating a 3D map of space effectively allowing a user
to “fly” through space58. The camera will take a 15-second exposure every 20 seconds59
covering 6 wavelengths from 320 nm near ultraviolet to 1050 nm near infrared, and is expected
to take over 200,000 pictures a year occupying well over a petabyte of uncompressed disk
space.

The LSST camera uses 189 4K x 4K CCD chips
arranged in a mosaic focal plane. In this image, you can
see the 21 replaceable electronic physical (x, y)
assemblies (called rafts), with each raft containing 9
CCD chips in a 3 x 3 mosaic. If you look at the center
raft, you will see the addressing scheme also uses (x, y)
with (0, 0) in the lower left and (2, 2) in the upper right.

2016 EMC Proven Professional Knowledge Sharing 15
The LSST’s camera is enormous.
 Pictured to the left, it weighs 6,200-
 pounds, and is 5.5 feet tall and 9.8
 feet wide. On the right is a picture of
 a staffer showing the relative size of
 the CCD mosaic.

The LSST will create unprecedented volumes of high-quality data – more than astronomers can
manually process every night. It will mark a revolution in how humans will explore space through
computer science. This effort is classified as a big data problem as the management and data
mining of this real-time data is paramount for astronomers to interpret the observations. Initial
computational requirements are estimated to require 3,000 16-core compute nodes at the
telescope’s location in Chile60. In 60 seconds, the captured image data must undergo a multi-
step parallel processing reduction to find asteroids and other moving objects, all before the next
batch of data comes in61. Once a day, raw data and metadata are sent 5,000 miles to a
supercomputer at the University of Illinois to be reprocessed and archived. Archiving the data
will initially require 150 teraflops of compute power, growing to nearly a petaflop by the 10th
year, and use 15 PB of disk space a year. The immense volume of data must be statistically
analyzed for low-level correlations to help reverse-engineer the results and determine the cause
and underlying cosmic physics – this is called the “inverse problem”62.

The 2010 prototype used 200,000 lines of C++ and Python code.63 “The Large Survey Database
(LSD) is a Python framework and DBMS for distributed storage, cross-matching, and querying
of large survey catalogs (>109 rows, >1 TB).”64 The processing complex is estimated to have a
source catalog of 350 billion rows and an object catalog of 37 billion rows, each with 200+
attributes, all representing 400,000 16-megapixel images65. The LSD uses partitioned tables
stored as compressed Hierarchical Data Format 5 (HDF5) files. HDF5 uses B-trees to index
table objects and works well with 3D data for faster access than the rows of an SQL database.
HDF5 can represent complex data objects and metadata much simpler and faster than a star
schema66,67. “Vertically, the tables are partitioned into sets of related columns (‘column groups’),
grouping together logically related data (e.g. astrometry, photometry). Horizontally, the tables
are partitioned into partially overlapping “cells” by position in space (lon, lat) and time (t).”68

2016 EMC Proven Professional Knowledge Sharing 16
Asteroid Terrestrial-impact Last Alert System – ATLAS – Optical Telescope
ATLAS was designed to be Earth’s asteroid collision “early warning” system. It scans space to
provide a day's warning for 30-kiloton "town killer” asteroid impacts, a week’s notice for a 5-
megaton 150-foot diameter "city killer" asteroid, and
three weeks of warning for a 100-megaton 390-foot
"county killer” strike69. (NOTE – the Chelyabinsk meteor
was estimated at 13 kilotons and 66 feet). ATLAS’s first
discovery (composite image to the right) was August 9,
2015, when it spotted asteroid “2015 PE312”, estimated
to be 200-500 feet in diameter based on its brightness70.

If ATLAS provides enough lead time, authorities can evacuate an impact area, or a tsunami
zone if the object strikes the ocean. With two ground-based telescopes 100 miles apart, ATLAS
robotically scans the sky four times every night seeking out NEOs by looking for movement
against the background of stars and galaxies. ATLAS may eventually have 8 telescopes.

The ATLAS system can analyze 500 MB/min to make detailed comparisons of images taken
 one hour apart71. The telescope observes the same area of space four times
 before software combines them into a single image. As this illustration
 4 CCD images minutes apart

 shows, algorithms subtract static
 Combined Static Possible
 images image asteroids “stars” and “planets” leaving only
 objects that appear to be moving.
 + - Objects moving in a straight line
 subtract between images become “suspect”
 asteroids. With a “suspect” asteroid, the system searches a database
 in real-time for this object using its coordinates and brightness data and
 issues an alert within 10 minutes after analysis72. More on this critical step in the
section “Using Hadoop To Spot An Asteroid”.

The ground-based ATLAS will have the same limitations as other telescopes of this variety – the
Sun makes it impossible to see what is directly behind it and its glare blocks out those reflective
asteroids in a perimeter around the Sun. That is what happened with the Chelyabinsk meteor –
it came from the direction of the Sun and was not visible. With ATLAS located in Earth’s
northern hemisphere, it is also unable to see into a major part of the southern sky. The Moon
also reflects the Sun’s light causing other asteroids coming from that direction to not be visible.

2016 EMC Proven Professional Knowledge Sharing 17
ATLAS exemplifies the blurred lines between astronomy and automation. A human would be
hard pressed to accomplish this mission without serious compute power. Each telescope will
have a 10.5 K x 10.5 K CCD equaling 110 megapixels and take 1,000 images a night73. That
equates to 150 GB every day or 55 TB/year/telescope. With two telescopes, 110 TB a year will
be generated, and if eight telescopes come on-line, they will generate almost a petabyte of data.

Satellite Telescopes
Hunting asteroids with a space telescope has many advantages over ground-based telescopes.
Space-based telescopes are not susceptible to the filtering of infrared and ultraviolet light by
Earth’s atmosphere, as well as the optical distortion caused by atmospheric turbulence. While
space telescopes cost more and are harder to repair, they allow astronomers to get clear
images of outer space. Let’s look at two space telescopes that will help us find asteroids.

NEOWISE – Optical Telescope
In 2009, NASA launched the 6 foot wide, 10 foot tall Wide-field
Infrared Survey Explorer (WISE) space telescope aboard a Delta
II rocket74. With solar panels for energy, WISE orbits 325 miles
above Earth and follows a Sun-synchronous path from the North
Pole to the South Pole75.

With infrared’s ability to find “dark” asteroids or ones that do not reflect a lot of visible light,
WISE uses four 1-megapixel CCDs of different infrared wavelengths to capture amazing images
of space76. This greatly enhanced infrared image of the dying
star Helix Nebula shows an asteroid’s red streaks. CCDs
made of Mercury-Cadmium-Telluride (MCT) capture the
infrared wavelength bands of 3.4 and 4.6 microns while
CCDs made of Arsenic-doped Silicon capture the 12 and 22-
micron bands77.

In this infrared illustration, WISE’s Scientist Dr. Amy Mainzer is holding a teacup. On the left,
there is not enough visible light to see any details. On the right, infrared shows many more
details. The same holds true in space when looking for
asteroids without the aid of visible light or when their surfaces
are not highly reflective. Dark asteroids absorb sunlight, so

2016 EMC Proven Professional Knowledge Sharing 18
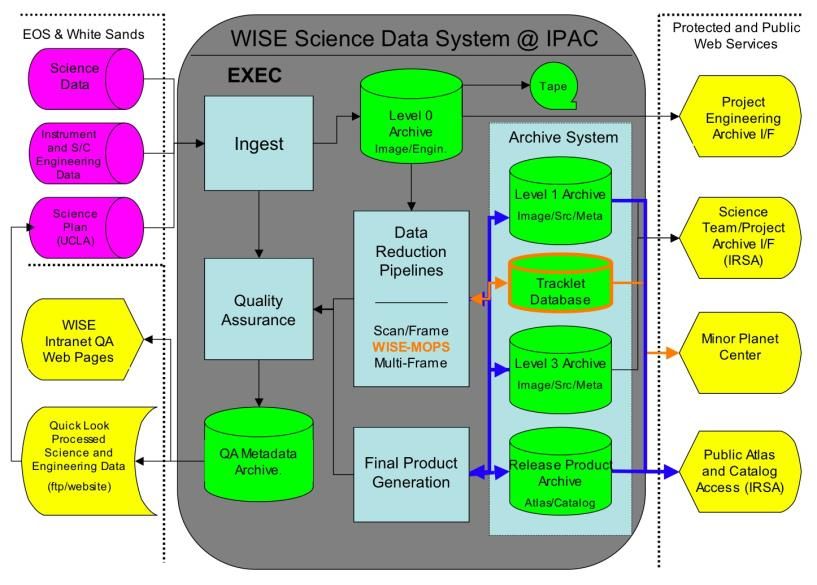
they get hotter and appear to glow with infrared detection, just like Dr. Mainzer. Every space object reflects infrared light, and the warmer they are the greater the amount of infrared light they produce. As a result, the WISE telescope needs to be colder than the objects it observes or it would pick up infrared from the telescope itself. When WISE was launched, it contained enough hydrogen to cool the telescope for 10 months. After that time, the Arsenic- doped Silicon CCDs failed even though the MCT CCDs continued to operate78. NASA renamed the WISE telescope NEOWISE (Near-Earth Object WISE) using just the surviving MCT CCDs. In February 2011, NEOWISE was “turned off” or decommissioned. In September 2013, NASA reactivated and reprogrammed NEOWISE to search for asteroids that could hit Earth as well as finding asteroids that could theoretically be redirected into a Moon orbit79. WISE takes a picture every 11 seconds and took 2.7 million of them in 2010. The Tracking and Data Relay Satellite System (TRDSS) transmits WISE imagery to ground stations using communication satellites operating at 300 megabits/s in the Ku/Ka-bands and 800 megabits/s in the S-band80. WISE radios data 4 times a day in 15-minute durations81. The computing complex located in the Infrared Processing and Analysis Center (IPAC) at the California Institute of Technology (Caltech) in Pasadena, California combines the images into a catalog for worldwide access82. The satellite uses stored commands for automatic controls such as attitude control and receives new sequences sent from the NASA Jet Propulsion Laboratory (JPL). The IPAC processes images EOS & White Sands WISE Science Data System @IPAC Protected and Public Web Services 83 Science following this block diagram . The Data EXEC ❷ Tape Project Level 0 Engineering Ingest module accepts Instrument and S/C Ingest Archive Image/Engin. Archive System Archive I/F Engineering NEOWISE data packets, telemetry, Data ❶ Level 1 Science Archive Science Plan Image/Src/Meta Team/Project and other data and puts it into the (UCLA) Data Archive I/F Reduction (IRSA) Pipelines Level 0 database . The Level 0 Quality ❸ Tracklet Database WISE Assurance Scan/Frame Intranet QA Minor images are then handed off to Data Web Pages WISE-MOPS Multi-Frame Level 3 Planet Center Archive Reduction Pipeline processing . QuickLook Image/Src/Meta Processed Public Atlas QA This pipeline removes instrument Science and Engineering Metadata Final Product Release Product and Catalog Data Archive Generation Archive Access Atlas/Catalog (IRSA) signatures and performs other QA (ftp/website) ❹ ❺ 84 work on the raw images . The WISE-MOPS portion of the pipeline finds the NEOs. The Final Product Generation documents the images and puts them in the Archive . 2016 EMC Proven Professional Knowledge Sharing 19
The processing of a raw image starts on the top left of this sequence. It is filtered, with new bad and previously bad pixels (shown in the yellow circle) removed85. In 2011, the WISE/IPAC processing used: 5 Sun/Oracle X4270 storage servers 15 Sun/Oracle J4400 SAS JBODs, H/W RAID, 3 X 18 TB usable per server; 270 TB total 42 node compute cluster; Dell 8‐core Xeon, 32 GB RAM, 0.5‐1 TB internal disk 3 Cisco 48‐port Catalyst 3750E switches with two 10 Gbit/s interfaces each Resource management RHE4 (cluster), Solaris/ZFS (servers), NFS3, Condor, Ganglia86 Gaia Space Telescope – Optical Telescope The European Space Agency used a Soyuz-STB rocket to launch an optical space telescope named Gaia in December 2013 for a 5-year mission primarily to create a 3D catalog of 1 billion objects in space, or roughly 1% of our Milky Way galaxy87. It uses an optical telescope and CCDs to capture images of stars in the 400 - 1000 nanometer wavelength and is expected to find thousands of planets the size of Jupiter, quasars, and the positions and velocities of over 200,000 asteroids and comets88. Unlike other space telescopes, Gaia orbits in what is known as Lagrange point or L2 – a stable place between the Earth and the Sun where a satellite is free of gravitational vibrations. Stationed 1 million miles from Earth, it will be unaffected by the same blind spot that causes Earth-bound telescopes to be unable to detect asteroids emerging from behind the Sun. Using 106 CCDs, each with 4500 x 1966 pixels for a mosaic of 1 billion pixels, Gaia will take images and collect makeup, position, motion, and other data on a billion stars and other objects 70 times over its 5-year mission. Each object will become a discrete Java object on Earth when processed. The data is transmitted over a 5 Mbit/s radio link during an 8 hour period each day. Gaia generates 50 GB of raw data daily, and by the time the mission ends, it will have created 200 TB of data. The data is stored in the main database and an object-oriented database management system from InterSystems Caché and processed by the Data Processing and Analysis Consortium (DPAC)89. The final product is estimated to equal one petabyte. 2016 EMC Proven Professional Knowledge Sharing 20
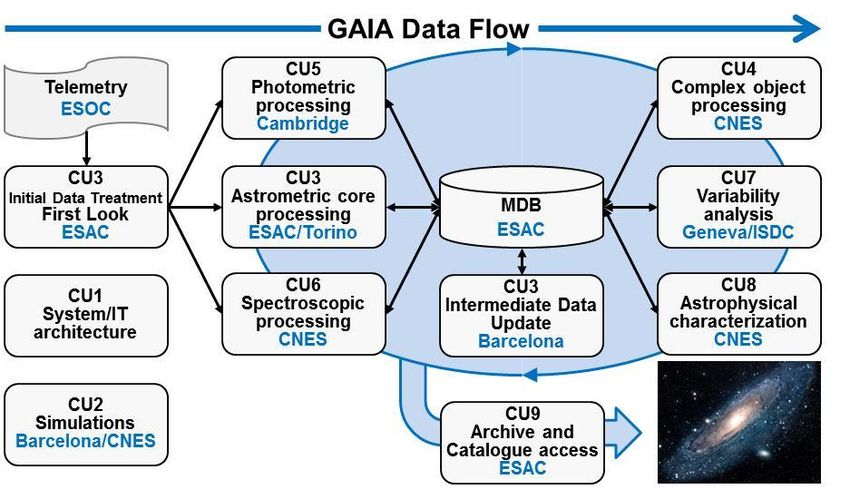
In 2013, Gaia was believed to be the largest astronomy data processing challenge to date90. To
process Gaia’s data, DPAC uses
a processing complex depicted
by the diagram to the right91. The
processing is performed by
equipment architected and
operated by over 400 European
scientists and software
developers from 24 countries
including France, Italy, UK,
Germany, Belgium, Spain, and Switzerland92. This “team effort” consortium has broken the Gaia
processing into 9 components to facilitate geographically distributed development. The
components are called Coordination Units (CU), 8 of which perform various aspects of
processing with the 9th handling the data archive catalog. CU1 and CU2 handle development
and simulations, and CU3, 5, and 6 handle the data processing of astrometric, photometric and
spectroscopic data. The CU3 is also known as the Astrometric Global Iterative Solution (AGIS)
and is designed to insert over 7 billion Java objects into the Caché database every day93.
Double star, orbital boundary, and solar system object analysis are performed by the CU4
component. CU7 tackles variable stars and CU8 handles spectral classification. Lastly, CU9 is
involved with Gaia data publication94.

The data processing would be distributed across the nations GAIA Data Processing Centers
 Coordination
listed in the table to the right. The DPAC requires that each CU Acronym Unit Location
 ESAC CU 1, 3 Madrid, Spain
uses the Java framework to be database-agnostic and run using BPC CU 2, 3, 9 Barcelona, Spain
 ISDC CU 7 Geneva, Switzerland
any vendor’s database95. IoA CU 5 Cambridge, England
 CNEX CU 4, 6, 8 Toulouse, France
 OATO CU 3 Torino, Italy
An enormous amount of processing, as part of the AGIS “astrometric core solution”, is needed
to create position and motion data for the observed objects. While the main database (center of
the data flow diagram on the top of this page) holds the Gaia data and the results of data
processing, the AGIS contains a subset of the data for up to 40 passes through 100 TB of Java
objects in a 4-week period96. Multiple AGIS Java programs ingest 50 billion discrete 600-byte
objects contained in the 100 TB data in just 5 days. AGIS finished results are stored in a
versioned copy of the main database.

2016 EMC Proven Professional Knowledge Sharing 21
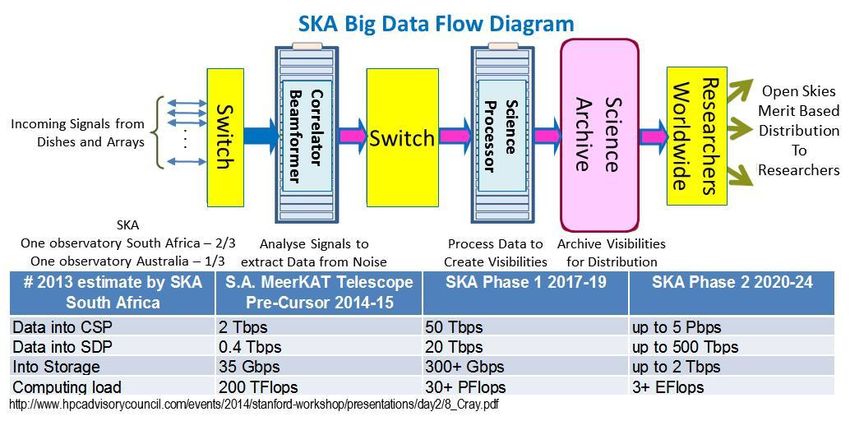
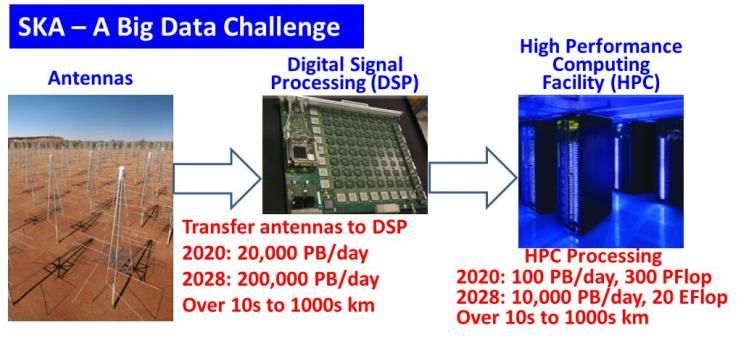
As an example of the processing power behind Gaia, the Barcelona,
Spain BPC data center in charge of CU2 simulations and CU3
Intermediate Data Updating (IDU) uses the “MareNostrum III”97
supercomputer that has 3,028 compute nodes using 16 core Intel
SandyBridge-EP E5-2670 processors (2.6 GHz), 32 GB of RAM and
500 GB of local disk. Interconnected with an Infiniband point–to–
point 10 Gb fiber optic network, the nodes utilize IBM’s General Parallel File System (GPFS,
now renamed to Spectrum Scale) mapped to 1.9 PB of disk space98.

In Toulouse, France, the Data Processing Center CNES (DPCC) is responsible for components
CU4, CU6, and CU8. They are handled with Dell servers used in both a Hadoop cluster and a
high performance compute cluster as pictured below99. CNES will have a big data mission to
assist in the processing of Gaia’s one petabyte of data stored in tables of 80 billion rows100.

The Square Kilometer Array – Mankind’s Largest Big Data Challenge – Radio Telescope
There is a new set of radio telescopes coming on-line called the Square Kilometer Array (SKA).
SKA will be the largest scientific instrument on the planet when completed101 and be 100 times
more sensitive than existing radio telescopes. The amount of data it is expected to generate will
dramatically push the boundaries of today’s computer science techniques.

With approximately 1/3rd of the telescopes located in Australia
and 2/3rds in South Africa, SKA will cover an area of
1,000,000 square meters, equaling the size of 187 American
football fields. Three different types of antennas will be used,
each capable of receiving specific data frequencies. The low-

2016 EMC Proven Professional Knowledge Sharing 22
frequency aperture array uses dipole antennas to handle the 50 to 350 MHz wavelengths,
acting in unison or as many smaller independent radio telescopes102,103. The mid frequency is
captured with dish antennas that cover the 350 MHz to 14 GHz spectrum while a subset in the
350 MHz – 4 GHz range is handled with larger traditional parabolic antennas.

With the ability to scan the sky 10,000 times faster than before104, the SKA requires innovations
in supercomputing, algorithmic analytics, and disk storage. The telescopes use a “Central
Signal Processor” (CSP) to forward the image data by high-speed communication links to
scientists working around the world. The Digital Data Backhaul (DDBH) network moves signals
from the telescope to the CSP, then to the Science Data Processor (SDP), and finally to local
SKA distribution centers. The distances, some measured in thousands of kilometers, data rates
to 27 terabits/second105 (almost 300,000 TB/day), and its timing requirements will stretch the
limits of modern telecommunications.

Initial SKA prototypes were named MeerKAT in
South Africa, and ASKAP and MWA in
Australia. MWA’s “Phase 1” will have 250,000
low-frequency antennas, increasing to a million
over time106. It should provide a much higher
resolution and will scan the sky 135 times faster
than existing radio telescopes.

In the first of multiple phases, telescopes will produce 160 TB of raw data per second (35,000
DVDs per second). With low-frequency range telescopes collectively generating 157 TB/s, and
mid frequency range telescopes generating 2 TB/s107, SKA is a big data computing project.
Individual telescopes will create up to 20 GB of raw data per second108. In total, up to 5
exabytes (EB) every day needs to be processed by a supercomputer, with the systems handling
156 zettabytes of data annually when fully operational. Data traffic is estimated at ten times the
 SKA Represents a Petabytes Exabytes Zettabytes
current global internet traffic109 with the Computing Revolution a year a year a year
 Data generated by SKA2 antennas ** 138,555,830 135,300 156
SKA requiring enough fiber channel Data generated by SKA1 antennas 13,855,583 13,530 16
 110 Global Internet Traffic 2013 430,080 420 0.5
cable to wrap around the Earth twice . SKA1 combined archive 6,656 6.50 < 0.01
 Business emails sent worldwide 3,000 2.90 < 0.01
The volume of data makes it impractical Facebook uploads 180 0.17 < 0.01
 Google searches 98 0.09 < 0.01
to move through a network, so it must YouTube 15 0.01 < 0.01
 CERN 15 0.01 < 0.01
somehow be processed where it finally NOAA 6 < 0.01 < 0.01
 Library of Congress 5 < 0.01 < 0.01
lands. ** SKA1 = first phase of SKA = 10% of total projected data
 Source: SpaceUp Toulouse - The Square Kilometre Array telescope
 https://www.youtube.com/watch?v=PkR6LAOgSII

2016 EMC Proven Professional Knowledge Sharing 23
As shown in this SKA Big Data
Flow Diagram, the radio dish and
array data rates rapidly increase
to 5 PB/s in Phase 2.
Researchers are able to review
the data and work with subsets,
perhaps in a cloud computing
model, after it lands in the
Science Archive to the right of the diagram.
 Antenna &
 Front-End Massive Data Flow,
The parallel architecture needed to process these rates and Systems Storage & Processing

volume sizes must take into account the worldwide
 Correlation > 1 Exaflop/s
geographic routing of data. Existing IT infrastructure simply
 > 7 Petabytes/s
cannot handle these data rates. Imagine the impact of taking Data
 800 Petabytes
 Product Temporary
 Storage 30 Petaflops/s
 Generation
an outage to cope with unplanned code upgrades or break-fix
 > 300 Gigabytes/s
issues. Here is a flowchart of the anticipated data rates. SKA High
 On-Demand
 Long Term Availability
 Storage Storage / DB Processing
is the very definition of a truly ambitious big data project.
 18 PB/year

SKA’s 500,000 telescopes will collect an enormous 14 EB of radio signal data and store 1 PB
every day. If you tried to store a petabyte of data on an EMC VNX2 using RAID 6(14+2), you
would consume 300 x 4 TB drives every day111. However, the critical issue is the compute
power and infrastructure to process a petabyte of data every day and not disk capacity per se.
The scalability, bandwidth, power consumption, and drive characteristics such as Input/Output
Operations per Second (IOPs) would dictate a far more elegant solution (if it even exists today).

 Processing Blade GGPU or MIC
The SKA design team initially used a conservative blade
 Disk 1 Disk 2 Disk 3 Disk 4
 M-Core - >10TFLOP/s

 M-Core - >10TFLOP/s

architecture design and extrapolated it to 2018/2020 to ≥1TB ≥1TB ≥1TB ≥1TB
 56Gb/s
handle future processing requirements. From the
LOFAR (Low-Frequency Array) low-power design112, To rack Host processor
 switches
 Multi-core X86
a Dell PowerEdge T620 using 8-core dual Xeon E5-
2600 processors with PCIe Gen3 15.75 GB/s expansion PCI Bus

Moore’s Law – every
 slots, 768 GB RAM, 32 x 2½” solid-state disk drive bays, 2 x 10 or 2 x 40
two years, the number GbE NICs, and 2 x 56 Gb/s Infiniband ports were envisioned. Using
of CPU transistors
doubles, effectively Moore's Law, these blades could have double to triple the processing
doubling computer
 power by 2020 and be capable of 64 TFlops.
processing power

2016 EMC Proven Professional Knowledge Sharing 24
Twenty of these 2U blades will be housed in a 42U rack. Each node, taking into 42U Rack
 Processing blade 1
 Processing blade 2
account memory, network interfaces, SSDs and other components, is expected to Processing blade 3
 Processing blade 4

consume 882 watts. Two 36 port Mellanox SX6536 Infiniband “leaf” switches
 Processing blade 5
 Processing blade 6
 Processing blade 7
connect to one 56 Gb/s port on each blade, delivering 74.52 Tb/s of switching Processing blade 8
 Processing blade 9
 Processing blade 10
capacity. Each rack would have an electrical power density of about 20 kW. Leaf Switch-1 56Gb/s
 Leaf Switch-2 56Gb/s
 Processing blade 11
Creating a low-profile SKA processing building block is essential to be able to power Processing blade 12
 Processing blade 13
 Processing blade 14
the overall processing complex necessary to handle the expected data rates. The Processing blade 15
 Processing blade 16
SKA 2013 “SDP Element Concept” architecture guide described a bulk storage Processing blade 17
 Processing blade 18
 Processing blade 19
 system incorporating a “scale-out” Xyratex ClusterStor 3000 which uses Processing blade 20

 the Lustre file system that is expandable to 30 PB and uses Infiniband to connect the
 blades. Its power consumption is 18.5 kW113. [Note: Lustre (Linux Cluster) is a
 parallel distributed file system used for large-scale cluster computing114.]

To explore the enormous processing power required over the entire SKA timeline, with a focus
on Phase 1 of SKA, IBM and the Netherlands Institute for Radio Astronomy (ASTRON) are
working to create a massively powerful computing system through advanced chip designs.
Called “Project DOME”, they will try to find energy efficient ways to Projects
 1. Algorithms and Machines
transport the huge data volumes between radio antennas to a central 2. Access Patterns
 3. Nanophotonics
location, and provide real-time data filtering and methods to store the 4. Microservers
 5. Accelerators
data. Ideally, they need to develop a 300 petaflop computer that uses 6. Compressive Sampling
 7. Realtime Communications
less than 8 MW of power, or more than 10 times the fastest
supercomputer with the same energy profile115. In total, ASTRON and IBM have mapped out 7
projects to handle this new SKA big data frontier. They include information management,
computer chip system design employing 3D stacked chips, optical interconnects, water cooling
and nanophotonics.

The software architecture is expected to include an Application layer, Common software layer,
 SKA subsystems and service components
High-Performance Computing (HPC)
 High-level UIF Toolkit SKA Common Software Application Framework
 APIs and Tools
services, and Operating System layers. The Access Monitoring Live Data Logging Alarm Configuration Scheduling
 Block
 Core Services Control Archiver Access System Service Management Service

designers envision a “loose coupling in the Base Tools
 Communication Database 3rd Party Tools Development
 Middleware Support and Libraries Tools

higher layers of the software stack…” with tighter Operating System

coupling for performance oriented lower layers116. Further subdivisions of each layer are likely.

The Base Tools layer contains Common Software development tools and run-time environment
on top of the operating system. This layer contains a Communication Middleware that handles

2016 EMC Proven Professional Knowledge Sharing 25
intra-application exchanges, a Database Support component providing administration, data access and abstraction application programming interfaces (API), and may include Cassandra, the Hadoop database HBase, or relational databases such as MySQL and Postgres. Third party tools and libraries might include astronomical libraries such as casacore, wcslib, HDF5, etc.117 “Development Tools comprises a comprehensive build system that supports recursive compilation, executing of unit and functional tests and creation of deployable packages (release process). It also provides wrappers on top of existing compilers such as make and/or SCons for C++ applications, Ant/Maven for Java applications and setuptools for Python.”118 Access control and authentication, archiving of monitor data, access to SKA real-time monitoring and control data, application logging, alarm tools, configuration management, and scheduling are part of Core Services. High-level APIs and Tools provide APIs, allowing packages to integrate and access core services. The User Interface Toolkit has APIs for the Graphical User Interface (GUI) including widgets for displays, log browsing, alarms, and tools to monitor and operate large scale control systems. The Science Data Processor binds hardware compute, network, software, and algorithms together to handle data rates exceeding the daily worldwide web traffic119. Planned to be online by 2020 and at “full power” by 2025, 100 petaflop supercomputers (100,000,000,000,000,000 floating point operations per second) will be needed to crunch SKA data120. Ultimately, exaflop supercomputers will be required. As of June 2015, the fastest supercomputer is China’s Tianhe- 2. Capable of “just” 34 petaflops, it could only handle 1/3 of SKA’s requirements121. The compute power is needed to process real-time image data from thousands of telescopes operating at thousands of frequencies. Some of the calculations include122: Removing corrupted data Calibrating each antenna Transforming the data onto a rectangular grid Applying Fourier transformations to convert the data an image in the sky Removal of data spikes from bright stars The process then iteratively combines parameters such as complex gains to eventually create a converged image. These steps are memory intensive and require massive data storage 2016 EMC Proven Professional Knowledge Sharing 26
capabilities. However, neither the processing power nor storage capabilities exist today on a
practical basis.

As we have seen in this section, SKA data rates will overwhelm the ability for astronomers and
data scientists to work with the raw data, pushing the analysis of patterns and correlations
beyond the limits of the human brain. SKA promises to redefine all that we associate with the
term big data – maybe we should call this “Ultra Big Data”?

Using Hadoop To Spot An Asteroid
With millions of asteroids in space, you would think it would be easier to find them. However,
their relatively small size poses a problem as they only appear to be tiny dots of light in the sky.
Is the dot a star and or an asteroid? In order to find an asteroid, telescopic images must be
compared, and an object that seems to move from one image to the next might be an asteroid.
In Piazzi’s time, the comparison was done manually, and as a result, few asteroids were found.

French physicists first used a camera for astronomy in 1845, but the film was not sensitive
enough to capture starlight123. These days, telescopes are far more sensitive and film cameras
have been replaced by CCD cameras. Algorithms now compare images with positive findings
reviewed by astronomers. Algorithmic methods have plusses and minuses. Algorithms that are
too sensitive can yield many “false positives”, and with lower sensitivity, it may miss the object.

The Catalina Sky Survey took 7 images of asteroid “2014 AA” on January 1, 2014124. This SUV-
sized asteroid weighed about 44 tons and burned up in our atmosphere the next day125. These
are 4 of those images126. At a high level, an Earth-bound telescope adjusted for planetary
rotation to
take CCD
images
minutes apart
of the same
 1 2 3 4
part of space. As mentioned in the ATLAS section of this paper, the images were aligned and
cleaned up through coaddition to allow image subtraction to isolate the asteroid.

2016 EMC Proven Professional Knowledge Sharing 27
You can also read