COUNTRY ASSESSMENT REPORT FOR LAO PDR - Strengthening of Hydrometeorological Services in Southeast Asia
←
→
Page content transcription
If your browser does not render page correctly, please read the page content below
COUNTRY
ASSESSMENT
REPORT
FOR LAO PDR

Strengthening of
Hydrometeorological Services
in Southeast Asia
ACKNOWLEDGMENTS

 This Country Assessment Report for Lao PDR is part of a study that aimed to strengthen the hydro-meteoro-
 logical services in Southeast Asia. The production was a collaborative effort of the World Bank, the United
 Nations Office for Disaster Risk Reduction (UNISDR), the National Hydrological and Meteorological Services
 (NHMS) and the World Meteorological Organization (WMO) with financial support from the Global Facility for
 Disaster Reduction and Recovery (GFDRR).

 The study investigated the capacity of the NHMS of five ASEAN Member States - namely Lao PDR, Cambodia,
 Indonesia, the Philippines and Viet Nam - to respond to the increasing demands for improved meteorological
 and hydrological information by various socio-economic sectors. Taking a regional approach, it recommended
 investment plans to improve the NHMS with the ultimate goal for reducing losses due to natural hazard-in-
 duced disasters, sustainable economic growth and abilities of the countries to respond to climate change.

 The Department of Meteorology and Hydrology (DMH) of Lao PDR supported the country assessment and
 coordinated the participation of various departments and ministries, including the Water Resources and
 Environment Administration (now Ministry of Natural Resources and Environment - MONRE), the Ministry of
 Agriculture and Forestry, Ministry of Public Work and Transport, Ministry of Health as well as the private
 sector. These agencies also reviewed the draft assessment report and its use within the context of the national
 consultation on the draft National Early Warning Strategy, organized by DMH and the World Bank Country
 Office in Lao PDR in February 2012.

 The Disaster Risk Reduction Division of the WMO provided technical inputs and facilitated peer review of the
 draft reports, which have resulted in significant quality improvements.

                                              CONTENTS
  EXECUTIVE SUMMARY								8
  1 LAO PDR IN A NUTSHELL								15
		1.1 General description							11
		1.2 Economic overview								12
		1.3 Climate									14
  2 SOCIO-ECONOMIC BENEFITS OF HYDROMETEOROLOGICAL SERVICES            15
		       2.1 Weather and climate dependent sectors					                15
		       2.2 Methodology for computing socio-economic benefits			      15
		2.3 Results and Analysis							17
		2.4 Summary of findings							23
  3 USER NEEDS ASSESSMENT OF HYDROMETEOROLOGICAL SERVICES
    AND INFORMATION 								                                           24
		3.1. Emergency preparedness and response					24
		3.2 Agriculture and food production						25
		3.3 Fishery									25
		3.4 Water resource management						26
		3.5 Energy production 								26
		3.6 Transport									27
		3.7 Aviation 									29
		3.8 Industry and urban development 						29
		3.9 Forest industry								30
		3.10 Construction								30
		3.11 Land use planning								30
		3.12 Tourism									31
		3.13 Insurance									31
		3.14 Health 									31
		3.15 Environment								33
         3.15.1 Water quality								35
         3.15.2 Air quality								35
		3.16 Climate change								33
		3.17 Media									33
  4 THE NATIONAL METEOROLOGICAL AND HYDROLOGICAL SERVICES
    IN LAO PDR IN A NUTSHELL 							                                   34
		4.1 Brief history									34
		4.2 General information								34
		4.3 Evaluation criterion								35
		4.4 Annual report								35
		4.5 Organizational structure							35
		4.6 Budget									36
		4.7 Accounting system 								36
		4.8 Human resources								36
		4.9 Training programmes 							37
		4.10 Visibility									37
		4.11 International memberships and networking					37
		       4.12 Cooperation with other providers of hydro-meteorological
		            services in Lao PDR							                               38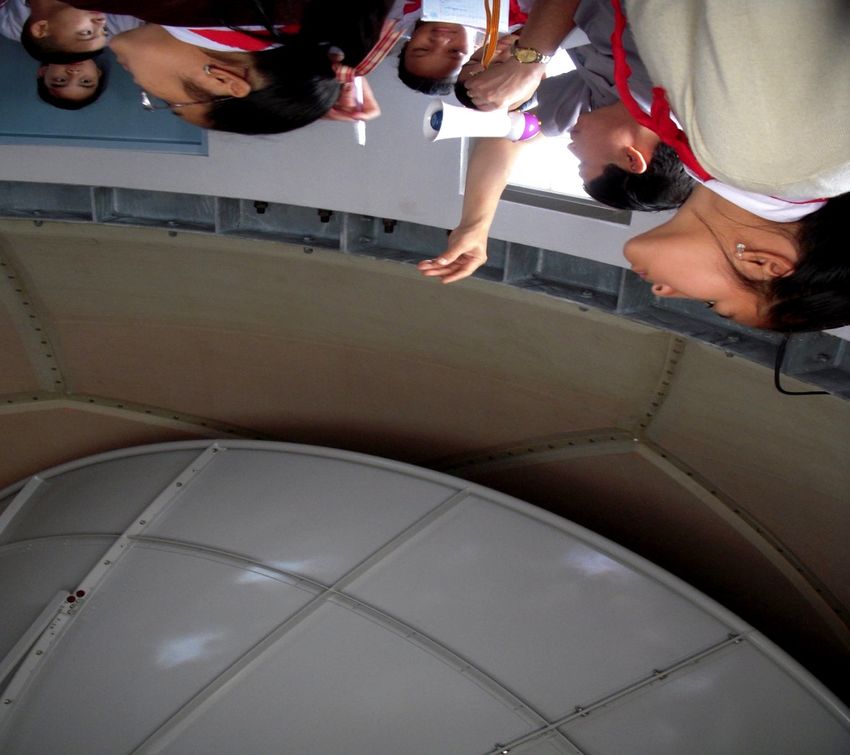
5 CURRENT SERVICES OF DHM 							                                          39
		5.1 Weather services								39
		5.2 Early warning System							41
		5.3 Climatological services							42
		5.4 Agrometeorological services							43
		5.5 Aviation services 								43
		5.6 Hydrological services 							43
		5.7 Marine services 								45
		5.8 Climate change services 							45
		5.9 Environmental services							45
		5.10 UV radiation								45
		5.11 R&D based Expert services							45
		5.12 Information services							47
   6 DMH NETWORK OF MONITORING STATIONS                     				48
 		       6.1 Surface network								                                         48
		6.2 Remote sensing observations						51
   7 MAINTENANCE, CALIBRATION AND MANUFACTURING OF
      MONITORING FACILITIES								52
		7.1 Meteorological observations							52
		7.2 Hydrological observations							52
   8 NUMERICAL WEATHER PREDICTION (NWP)                     				53
   9 INFORMATION AND COMMUNICATION TECHNOLOGY (ICT)                         		56
		9.1 Communication facilities							56
		9.2 Data Management								56
		9.3 IT infrastructure								56
		9.4 IT Personnel									58
		        9.5 Needs to improve communication system and data management		     58
   10 NATIONAL AND INTERNATIONAL COOPERATION AND DATA SHARING                 60
		 10.1 National 									60
		 10.2 International								60
   11 DEVELOPMENT PLANS PROPOSED BY DMH					63
   12 SUMMARY										66
   13 RECOMMENDATIONS TO STRENGTHEN THE
       METEOROLOGICAL AND HYDROLOGICAL SERVICES				68
   14 PROJECT PROPOSAL								71
		14.1 International cooperation							71
		14.2 ICT and data management							71
		14.3 Meteorological observation network 					71
		14.4 Hydrological stations							72
		14.5 Environmental observation							72
		14.6 Remote sensing network							72
		14.7 Visualization and editing tools						72
		14.8 Lightning detection system							72
		14.9 Climate change								72
		14.10 Training									72
   Persons Met During the Mission								74
   References										75
   A systematic Framework for Presentation of the Analysis of Meteorological
   and Hydrological Services								78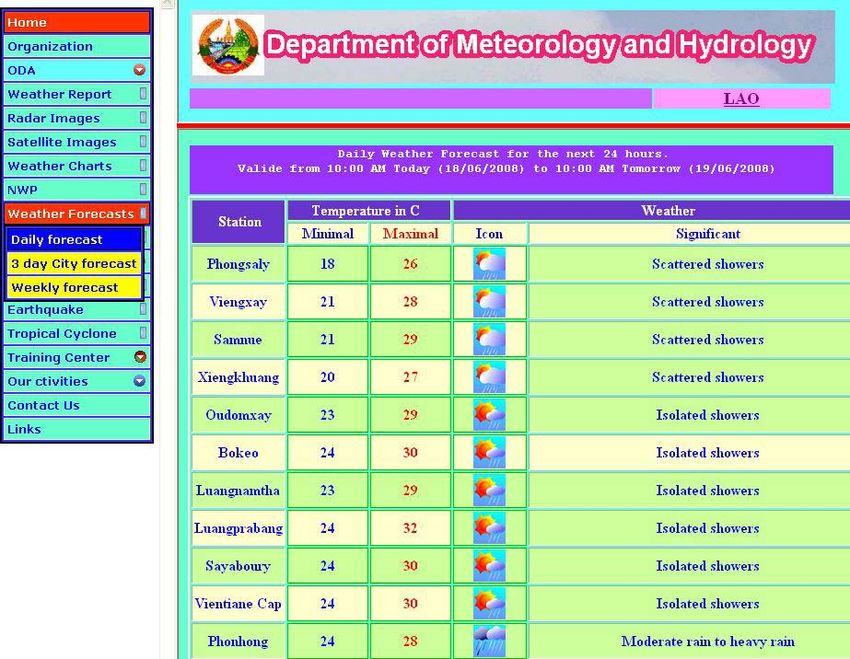
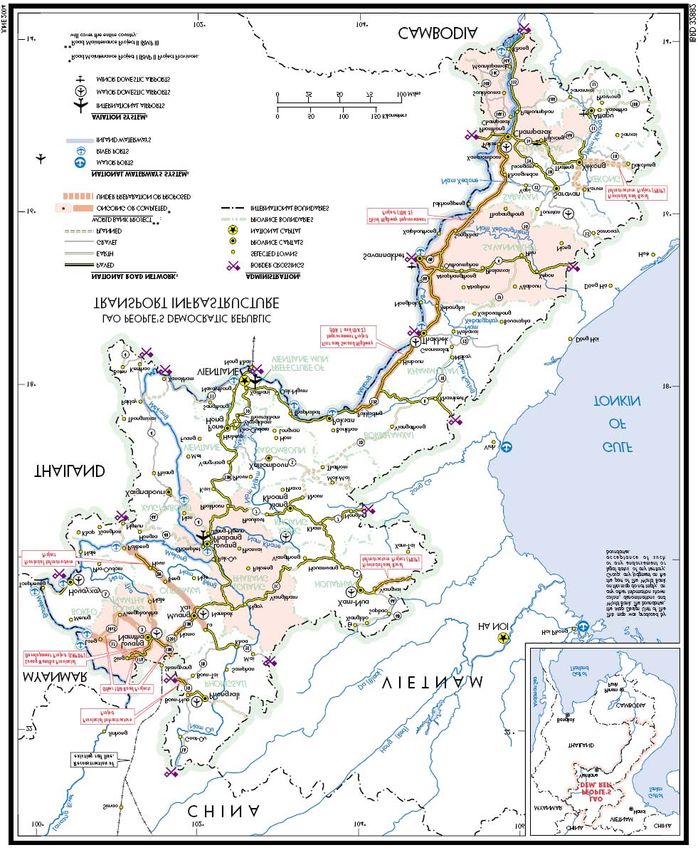
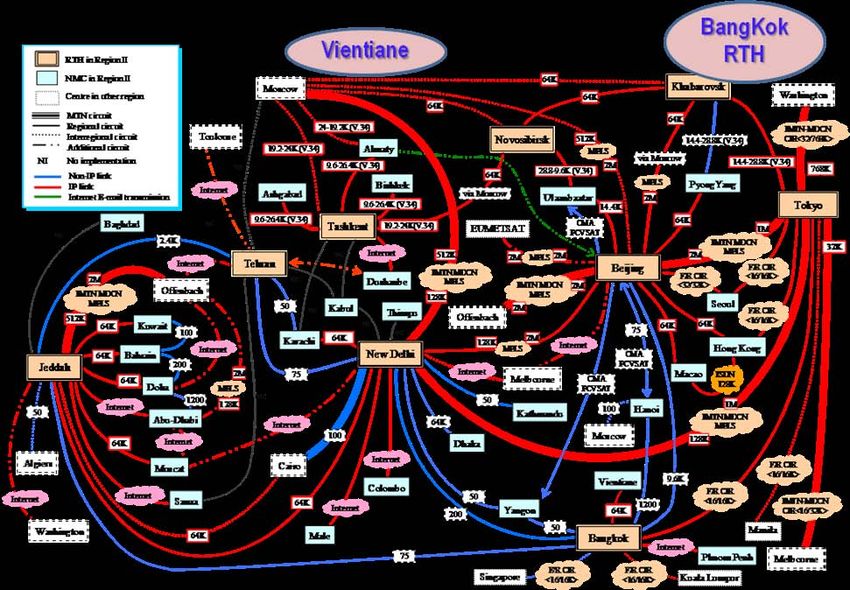
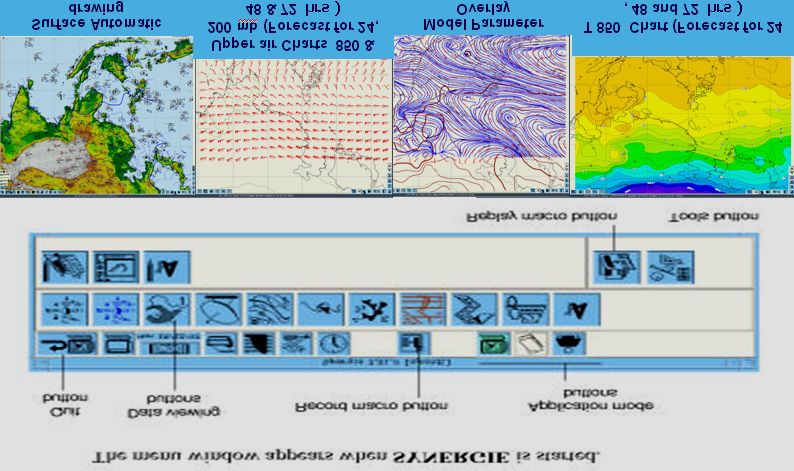
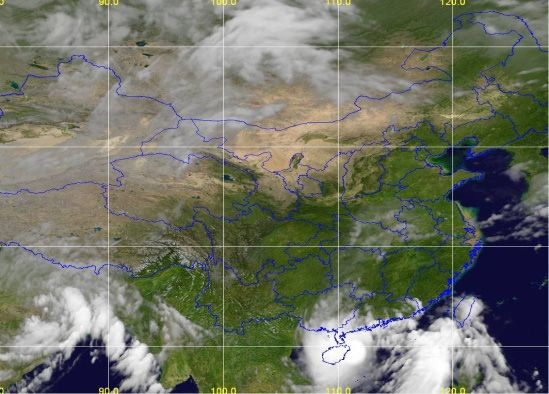
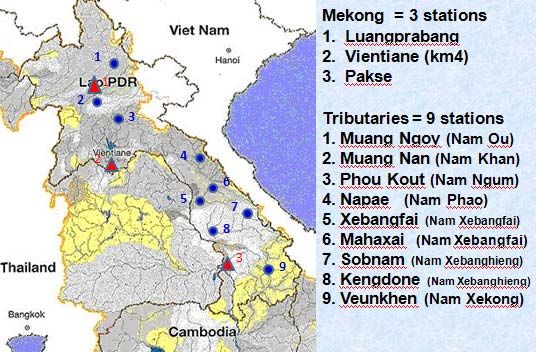
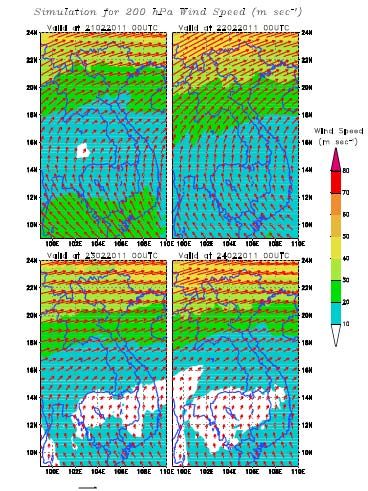
FIGURES
Figure 1      Schematic of linkages of Meteorological Services with EWS stakeholders
Figure 1.1    Geographical location of Lao People’s Democratic Republic
Figure 3.1    Lao PDR Transport infrastructure map from Lao PDR Transport Brief by Alberto Nogales,
		            May 1, 2004 version
Figure 4.1    DMH Headquarters at Vientiane Capital
Figure 4.2    Organization Structure of DMH
Figure 4.3    DMH on open house for elementary and secondary students
Figure 5.1    Weather forecast displayed at the DMH website
Figure 5.2    Flowchart of Forecast & Warning Dissemination in Laos
Figure 5.3    Severe weather warning dissemination
Figure 5.4    A sample display of the water level report at the website of DMH
Figure 5.5    Water level information at Mekong’s tributaries displayed at the DMH website
Figure 5.6    Network of radars used in the study
Figure 5.7    Homepage of the Department of Meteorology and Hydrology, Lao PDR
Figure 6.1    Network of observing stations and facilities of DMH Lao PDR
Figure 6.2    Meteorological network
Figure 6.3    Meteorological stations serving the aviation sector
Figure 6.4    Network of rainfall stations in 2007(left) and current (right)
Figure 6.5    Hydrological network
Figure 6.6    Network of seismic stations
Figure 6.7    Main components (left) of a seismic station (right) in Lao PDR
Figure 6.8    MRC Hydrological Cycle Observation Stations (HYCOS) in the left figure and data acquisition
		            system in the right
Figure 6.9    C-Band Doppler Weather RADAR
Figure 6.10   Satellite Ground Receiving Station
Figure 8.1    Radar image showing estimated precipitation
Figure 8.2    Satellite image (MTSAT)
Figure 8.3    Wind at 200 hPa product of RIMES
Figure 8.4    Outputs from the SYNERGIE software (from left to right): Surface drawing parameter, 850 hPa
		            emperature, upper wind and forecast chart overlay
Figure 9.1    Data collection facility for domestic stations
Figure 9.2    Topology of the Data Center
Figure 9.3    NWP products from ECMWF for Severe Weather monitoring and forecasting in Laos
		            using Synergie Version 3.4.0
Figure 9.4    Statistic webpage created by Dream Weaver software
Figure 10.1   Data Sharing Topology in Lao PDR
Figure 10.2   Data Exchange via WMO’s GTS in Region II (Asia)
TABLES
Table 2.4    Summary of damages caused by natural hazard-induced disasters, Lao PDR 2005-2008
Table 2.5    Actual and estimated socio-economic damages due to weather and climate-related disasters in Lao PDR,
		           1990-2029 (million US dollars)
Table 2.6    Estimated 10% reduction in the socio-economic damages, or the socio-economic benefits due to
		           improvements in NMHS in Lao PDR, 2010-2029 (million US dollars)
Table 2.7    Undiscounted and discounted operating and maintenance costs of improvements in NMHS in Lao PDR,
		           2010-2029 (Million US$)
Table 2.8    Options, Costs, Discounted Total Benefits, Discounted Net Benefits and Cost-Benefit ratios for
		           improve ments in NMHS in Lao PDR, 2010-2029
Table 3.1    Protocol in disseminating warning from the DMH to the NDMO
Table 4.1    Annual budget of DMH
Table 5.1    Warning Criteria for Tropical Cyclones, Storm and Strong Winds and Heavy Rains
Table 5.2    Accuracy rate of forecasts and warnings issued by DMH in 2008
Table 5.3    Desired accuracy of weather forecasts (in %) that could be achieved through better observations,
		           new tools and general strengthening of the DMH
Table 9.1    Communication facilities for transmission, reception & exchange of data & products
Table 11.1   On-going and proposed projects of DMH Lao PDR
Table 12.1   National capacities, gaps and needs of DMH Lao PDR
Table 12.2   Evaluation of DMH Forecast and Services
Table 14.1   Strengthening DHM Lao PDR’s as part of a regional cooperation project
ACRONYMS
ADB		       Asian Development Bank
AGL		       Assurances Générales du Laos
ADPC		      Asian Disaster Preparedness Centre
ASEAN		     Association of South East Asian Nations
AusAID		    Australian Agency for International Development
BCA		       Benefit-Cost Analysis
DMC		       Disaster Management Committee
DMH		       Department of Meteorology and Hydrology (of Lao PDR)
DRM		       Disaster Risk Management
DRR		       Disaster Risk Reduction
ECMWF		     European Center for Medium Range Weather Forecasting
EIA		       Environmental Impact Assessment
ETL		       Enterprise of Telecommunication of Laos
EWS		       Early Warning System
FAO		       Food and Agriculture Organization
GDP		       Gross Domestic Product
GFDRR		     Global Facility for Disaster Reduction and Recovery
GTS		       Global Telecommunication System
ICAO		      International Civil Aviation Organization
IWRM		      Integrated Water Resources Management
JICA		      Japan International Cooperation Agency
JMA		       Japan Meteorology Agency
KOICA		     Korean International Cooperation Agency
Lao PDR     Lao People Democratic Republic
LNMC		      Laos National Mekong Committee
MAF		       Ministry of Agriculture and Forestry
MCTPC		     Ministry of Communications, Transport, Post and Construction
MPWT		      Ministry of Public Works and Transport
MRC		       Mekong River Commission
MRC-HYCOS   Mekong River Commission Hydrological Cycle Observation System
NDMC		      National Disaster Management (steering) Committee
NDMO		      National Disaster Management Office
NESDP		     National Socio-Economic Development Plan
NMHS		      National Meteorology and Hydrology Services
NMS		       National Meteorological Service
NSCCC		     National Steering Committee on Climate Change
NWP		       Numerical Weather Prediction
PDMC		      Provincial Disaster Management Committee
RIMES		     Regional Integrated Multi-Hazard Early Warning System for Africa and Asia
RTH		       Regional Telecommunication Hub (assumed by Thailand Meteorological Department in Bangkok – RTH Bangkok)
TAFOR		     Terminal Aerodrome Forecast
TMD		       Thailand Meteorological Department
USAID		     United States Agency for International Development
WB		        The World Bank
WIS		       WMO Information System
WMO		       World Meteorological Organization
WREA		      Water Resources and Environment Administration
WRERI		     Water Resources and Environment Research Institute
EXECUTIVE SUMMARY

    The role of hydro-meteorological services
    Weather and climate affect all kinds of human activities.          risk of coastal flooding and also increase exposure
    Due to the serious impacts of recent weather and                   to vector-borne infectious diseases that threaten
    climate events in the region which affected economic and           human health. Moreover, tourism which is an
    business operations, the various sectors in the country            important source of income in many countries will
    are beginning to demand for the improvement of                     experience severe disruption due to sea level rise
    increasing hydrometeorological products and services.              and frequent occurrence of extreme weather and
    The frequent occurrence and increasing severity of                 climate events associated with climate variability
    extreme weather and climate events in the country                  and change.
    are seen as indications of a changing climate.
                                                                       As the impacts of climate change continue to
    As climate change progresses with time, the impacts                accelerate due to global anthropogenic climate
    will exacerbate and will affect all sectors in                     change, the National Meteorological and
    unprecedented ways, particularly in areas where                    Hydrological Services (NMHSs) will be faced
    water is a limited resource. On the other hand,                    with the increasing challenges and demands of
    tropical cyclones can bring extreme rainfall                       providing more accurate, timely and useful
    resulting in catastrophic flooding. The attendant                  forecasts, products and information. The core
    weather and climate extremes resulting to                          aspects of support that NMHSs provide to disaster
    floods and droughts can considerably decrease                      risk reduction (DRR) agencies and early warning
    agricultural productivity. Accelerated sea level rise              system (EWS) stakeholders are shown in Figure 1.
    due to global warming will expose more people to the

                                                Source : Golnaraghi, mgolnaraghi@wmo.int
                            Figure 1. Schematic of linkages of Meteorological Services with EWS stakeholders
4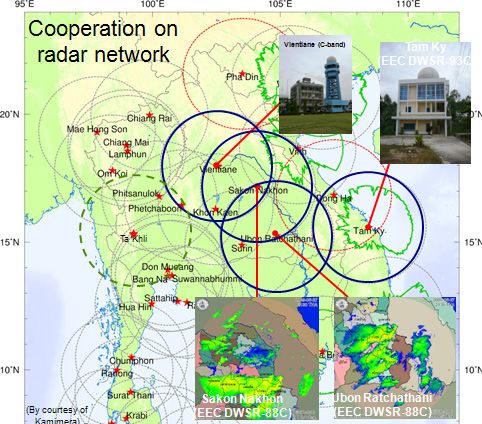
5
To be able to address these demands, it is necessary and urgent to put in place or to enhance the very basic
    requirements for an NMHS to function effectively as follows:
      1) adequate networks to monitor hydro-meteorological parameters;
      2) a robust communication system for data transmission, dissemination of forecasts and sharing of information;
      3) high speed computing system for data assimilation and numerical weather prediction;
      4) human resource equipped with appropriate trainings; and
      5) more interaction with users of weather and climate information.

    The trans-boundary nature of weather-causing phenomena would require collaboration among NMHS in the
    region. Hence, there is now an urgent need to enhance regional cooperation and data sharing which is
    currently being undertaken by the World Meteorological Organization (WMO) through its WMO Information
    System (WIS).

    Assessment of needs of improved
    hydrometeorological services in Lao PDR

    For generations, the people of Lao PDR especially            does not undertake research that can support the
    those living in remote areas with no access to information   improvement of its forecast products and other
    and warnings have used traditional knowledge and             information issued to the public. With its
    beliefs to anticipate and cope with environmental            limited physical and human resources, the DMH
    hazards. Scientific weather forecasting was formalized       cannot cope with the increasing demand for better
    in the country in 1955 with the establishment of the         services.
    National Meteorological Service (NMS). The NMS was
    mandated to provide weather and climate-related              With climate change, there is a great need for
    services for the country. In 1976, the NMS received an       improved hydrometeorological and environmental
    additional mandate of providing operational hydrological     services in Lao PDR. This will entail upgrading of
    work and it was accordingly renamed as the Department        the facilities and observing network of the DMH
    of Meteorology and Hydrology (DMH). Later in 1997,           as well as capacity building. Real-time collection
    the DMH also took charge of earthquake monitoring            of data from its observing network and dissemina-
    activities. It also provides weather services to aviation    tion of reliable, timely and accurate forecasts and
    and land transportation.                                     warnings to national and local disaster manage-
                                                                 ment organizations are important for effective
    Generally, the Department of Meteorology and Hydrology       disaster reduction management which should be
    (DMH) of Lao PDR is able to provide basic hydrome-           complemented by active community participation,
    teorological services for disaster reduction purposes.       among others. Observed data from its hydrome-
    However, compared to other countries in the region,          teorological network also need to be shared to other
    the DMH is lagging behind in terms of core capaci-           NMHS through regional/global data exchange in
    ties and forecasting technology. The department              order to improve numerical weather prediction.

6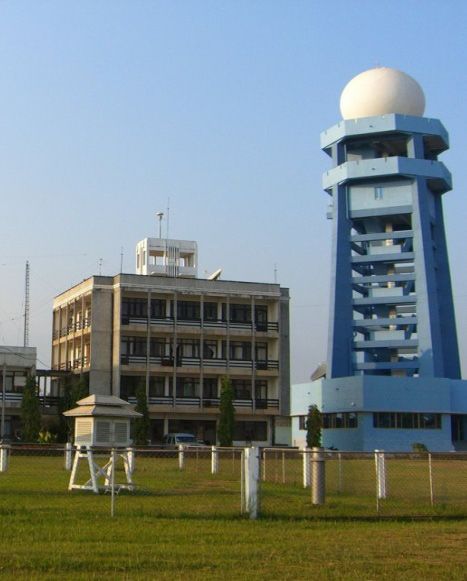
National set-up for production of
hydro-meteorological services in Lao PDR
The DMH is the provider of weather and climate related services for Lao PDR. It is responsible for the operation
and maintenance of all hydro-meteorological observation networks, and provision of weather and flood forecasts,
and severe weather warnings all over the country. It plays vital roles jointly with the National Disaster
Management Office (NDMO) to serve the National Disaster Management (steering) Committee (NDMC) in
decision making for taking prompt actions against hydrometeorological hazards. It also provides weather
services to aviation and land transportation. On issues concerning climate change, the DMH is the agency
responsible for providing scientific information to decision makers in government. It is also assigned as one of
the key agencies for the implementation of the National Strategy and Action Plan on Climate Change, including
National Adaptation Programme of Actions (NAPA). The DMH provides hydrometeorological data, forecasts
and warnings, and seasonal climate outlook for the climate change adaptation programme of Lao PDR.

The visibility of the DMH to the public and in the science community is generally good but still needs to be
enhanced. Lao PDR through the DMH is a member of the World Meteorological Organization (WMO) and the
Director-General of the DMH serves as the Permanent Representative with WMO. Lao PDR is also a member
of the Mekong River Commission (MRC) with DMH serving the Laos National Mekong Committee (NLMC) and
working closely with the MRC Secretariat.

It is a matter of serious concern that the adverse impacts of climate change are seen to be felt in many areas in
the country. It is therefore critical to prioritize the upgrading of the capabilities of the DMH in providing improved
hydrometeorological products and better delivery of services to minimize the ill effects of climate change in the
country.

State of affairs of the DMH
The DMH is a government agency under the Water              DMH’s vision is simple but service oriented, “Making
Resources and Environment Administration (WREA)             our forecasts essential to everyone everyday”. In its
and directly under the supervision of the Office of         current capacity, DMH may have somehow realized
the Prime Minister. The headquarters of the Depart-         this simple vision. But due to the remarkably grow-
ment of Meteorology and Hydrology of Lao PDR                ing demand in terms of quantity, quality and variety
is located at Souphanouvong Avenue, Ban Akard,              of weather and environmental services, DMH is now
Vientiane Capital. The existing building and its con-       having a hard time to meet these demands.
dition does not provide sufficient space and security
for modern IT technology.                                   The DMH has relatively limited technical, human and
                                                            financial resources to carry out its mission, compared
The DMH is composed of eight (8) divisions and              to most of the NMHSs in the Southeast Asian region.
in the early 2011, the Weather Forecasting and              Its office premises, observation network, production
Aeronautical Division was split into the Weather            systems, and its current financial resources are not
Forecasting Division and Aeronautical Division to           adequate to ensure the delivery of better products
address the increasing demand of weather services           and services to all sectors.
for aviation.
                                                                                                                         7
The DMH has a total number of 245 personnel, 70 of which are working at the headquarters and 175 are
deployed in the provincial stations. Out of these total manpower complement, there are only 14 personnel at the
Weather Forecast and Aeronautical Division doing round the clock monitoring and issuance of meteorological
and hydrological forecasts and the provision other related services for the entire country. Its workforce
is composed of 1 PhD, 9 MSc, 5 BS degree holders and 44 technicians, the others are undergraduates.
There is only one IT staff who is responsible for all the IT related requirements of the department.
Although the DMH plans to recruit young engineers to augment its human resources, the current salary level in
the government is among the main constraint in attracting qualified and talented applicants. The department
also needs to intensify its efforts in international cooperation and networking for the upgrading of the capacities
of its personnel.
DMH’s production and dissemination of hydrometeorological products and services is on average level. Through
collaboration with Meteo-France, the department acquired the SYNERGIE workstation for the processing and
display of meteorological charts and other relevant information needed in the production of forecasts and warn-
ings. However, the insufficient observing network in the country leaves the quality and accuracy of its forecast
products considerably lower compared with other NMHS in Southeast Asia. Currently, the DMH does not run
any numerical weather prediction model in support of its forecasting and warning services. However, this can
address by availing access to numerical products from advanced meteorological centers.
Among the deficiencies in the observing network of the DMH are limited meteorological and hydrological
stations, absence of upper air station, lack of radar coverage, and reliable telecommunication system for the
collection of data and dissemination of forecasts and warnings. Under its environmental services, the DMH
lacks capacity in greenhouse gas inventory and monitoring.
Project proposal to strengthen the DMH
To improve the capabilities of the DMH as the warn- transmission of data from field stations and for fast
ing agency for hydrometeorological hazards in order to dissemination of forecasts and warnings to the
meet the needs of key economic sectors in Lao PDR, public and other end-users.
a proposal is developed for upgrading its physical
resources and enhancing the capacities of its human On human resources, it is proposed to enhance
resources. On its physical resources, manual or analogue capacity building through the conduct of specialized
meteorological instruments should be replaced with training courses for DMH personnel to keep abreast
automatic weather observation system to enable DMH with the latest advancements in technology and
to establish additional observation sites even with its how these can be applied locally.
limited personnel complement. Additional upper-air The DMH has high confidence that the Lao PDR
observation stations and new lightning detection system Government will provide funds for the operation
should also be established to come up with a better and maintenance of the proposed enhancement of
representation of the vertical structure of the atmosphere its observation network. This willingness is shown
especially during occurrence of tropical cyclones and deep when the Ministry of Planning and Investment
mesoscale convective systems such as thunderstorms. approved the 5-year (2011-2015) plan for moderni-
Composite radar images from all radar equipment in zation of the DMH. This is important for sustainability
adjacent countries should be made available through of the project and continued strengthening of the
stronger regional cooperation. High speed telecom- services of the NMHS.
munication system is also necessary for real-time
8Investment plan
The primary objective of the proposed
investment plan is for DMH to provide LAO PDR A (USD) B (USD)
timely, accurate and reliable forecasts RIMES
and warnings on weather and climate International cooperation of experts 100,000 100,000
related hazards for the safety and well Communication systems
- Hardware + software 500,000 500,000
being of the people and in support
IT Center
of economic development in Lao - Hardware 100,000 100,000
PDR. This will be achieved through - Consulting 50,000 50,000
the upgrading of its facilities, capacity Data management
building, and research and develop- - Hardware and installation 560,000 560,000
ment. This entails some investment - Storage 125,000 125,000
particularly on the automation of - Consultation and training 100,000 50,000
hydrometeorological observing network Meteorological observation network
including telecommunication facilities. - automatic weather stations (P, T, U, ww, wd, G) 980,000 980,000
The cost can be reduced if regional - aviation weather observing station (AWOS) 1,000,000 1,000,000
cooperation is considered through - agrometeorological stations) 340,000 340,000
data sharing, technology transfer and - climate stations 187,600 187,600
capacity building. Joint projects on - automatic rain gauge 314,900 314,900
climate change and other regional Hydrological observation network
concerns could also be considered - automatic hydrological stations 704,000 440,000
to promote cooperation. Scholarship Environmental
grants and short-term trainings from - automatic air quality stations 10,000 26,500
international organizations can also be - Ozone & UV radiation 10,000 26,500
availed to improve the level of education Remote sensing network
and skill of DMH personnel. - upper air observations 1,780,000 890,000
- new weather radars (including towers) 6,000,000 2,000,000
A five-year investment plan is designed - lightning detection 100,000 135,000
and this does not include allocation - Satellite receiving station 100,000 135,000
for operation and maintenance cost Training 100,000 50,000
for the duration of the project. The two Research and development
investment options considered are: - impacts of climate change 100,000 50,000
- socio economic impacts 100,000 100,000
A. Strengthening of DMH as - national seminar on socio-economic benefits 100,000 100,000
“Stand-alone system” - end-user seminar 30,000 30,000
B. Strengthening DMH as part of Re Project management
- consultant 200,000 100,000
gional Cooperation
- local project coordinator 100,000 50,000
Total 13,843,00 8,389,000
9Economic value of weather forecasts
and hydrometeorological services in Lao PDR
For a stand alone option, the results of the computations show that using a 10% reduction in damages as a
measure of benefits, the total costs of NMHS improvements are US$18.98 million, discounted total benefits are
US$95.21 million, discounted net benefits are US$79.89 million and C/B ratio is 1:5.2.
Under the regional cooperation option, the results of the computations show that using a 10% reduction in
damages as a measure of benefits, the total costs of NMHS improvements are US$10.93 million, discounted
total benefits are US$95.21 million, discounted net benefits are US$84.28 million and C/B ratio is 1:8.7.
The Table below shows the Costs, Discounted Total Benefits, Discounted Net Benefits and Cost-Benefit ratios
for improvements in NMHS in Lao PDR 2010-2029.
Option Costs Discounted Total Benefits Discounted Net Benefits Cost/benefit
(Million US$) (Million US$) (Million US$) Ratio (C/B)
Stand Alone 18.32 95.21 79.89 1:5.2
Regional Cooperation 10.93 95.21 84.28 1:8.7
In retrospect, the following are the main findings of the computations done for Lao PDR:
• The discounted total and net benefits due to the improvements in the NMHS of Lao PDR, based even only
on the decrease in damages due to the improvements, are immense and more than enough to pay for the
cost of improvements;
• The C/B ratios based on the actual costs of NMHS improvements and the discounted values of the total
benefits from the improvements are generally better than the 1:7 ratio set by the WMO;
• The C/B ratio for the system with regional integration are better than the ratio for the stand alone system
which implies that being more efficient the former system is also more desirable; and
• The C/B ratios would improve further if the indirect benefits of the NMHS improvements, productivity gains
in the economy and the benefits beyond 2029 are included in the computation of benefits.
Environmental impacts of Financing of the proposed project
enhancement of the observation Funds for the implementation of the proposed
network project can not be supported out of the existing
budget allocation provided by the Government
Automation of observation network and upgrading of of Lao PDR to the department, hence, outsourcing
the other equipments and facilities of DMH will not is necessary. Foreign donors such as JICA,
produce any harmful effects on the environment. KOICA, USAID, AusAID and the World Bank could
Only the radar towers (typical height) will have some be tapped to provide funding support for the project.
visual impact on the environment and would require However, in the implementation of foreign assisted
the issuance of a permit by the proper authorities projects the government will be required to provide
prior to the implementation of the project. On the some counterpart funds. Assistance from advanced
other hand, the radar towers could be used as lookout national meteorological services in Asia and other
spots and information centers for the public. regions should also be pursued especially in the
area of capacity building in hydrometeorology.
In order to ensure sustainability of the project, the
Government of Lao PDR should allocate funds every
year for the operation and maintenance of the new
equipments and facilities after the completion of
10
the project.1.1 General Description
LAO PDR IN NUTSHELL
1
Modern-day Laos has its roots in the ancient
Lao kingdom of Lan Xang, established in the
14th Century under King Fa Ngum. For 300 years
Lan Xang had influence reaching into present-day
Cambodia and Thailand, as well as over all of
what is now Laos. After centuries of gradual
decline, Laos came under the domination of
Siam (Thailand) from the late 18th century until
the late 19th century when it became part of
French Indochina. The Franco-Siamese Treaty of
1907 defined the current Lao border with Thailand.
In 1975, the Communist Pathet Lao took control of
the government ending a six-century-old monarchy
and instituting a strict socialist regime closely
aligned to Vietnam. A gradual return to private
enterprise and the liberalization of foreign
investment laws began in 1988. Laos became
a member of ASEAN in 1997.
(http://www.retire-asia.com/lao-maps.shtml)
Figure 1.1 Geographical location of Lao People’s Democratic Republic
The data and information presented in the following sections are mainly taken from the World Factbook of
the Central Intelligence Agency, USA.
Geography and Land Use
• Location: Southeastern Asia, northeast of Thailand, west of Vietnam
• Total area: 236,800 km2; land area: 230,800 km2; water area: 6,000 km2
• Total land boundaries: 5,083 km
• Coastline: 0 km (landlocked)
• Maritime claims: none (landlocked)
• Terrain: mostly rugged mountains; some plains and plateaus
• Elevation extremes: lowest point: Mekong River 70 m; highest point: Phou Bia 2,817 m
• Land use: arable land: 4.01%; permanent crops: 0.34%; other: 95.65% (2005)
• Irrigated land: 1,750 km2 (2003)
• Total renewable water resources: 333.6 km3 (2003)
• Freshwater withdrawal (domestic/industrial/agricultural): total - 3 km3/yr (4%/6%/90%);
per capita - 507 m3/yr (2000)
11• Current environmental issues: unexploded ordinance; deforestation; soil erosion; most of the
population does not have access to potable water
• Main geographical feature: The Mekong river- forms a natural border with Thailand in most areas;
flows through nearly 1.900 km of Lao territory; with the main 13 tributaries from Lao PDR; catchment
area in Lao PDR: 213.060 km2 (26.8 % of total catchment)
People
• Population: 6,834,345 (July 2009 est.)
• Life expectancy at birth, total population: 56.57 years
• Ethnic groups: Lao 55%, Khmou 11%, Hmong 8%, other (over 100 minor ethnic groups)
26% (2005 census)
• Languages: Lao (official), French, English, and various ethnic languages
• Literacy (definition: age 15 and over can read and write): total population - 68.7%
Government
• Government type: Communist state
• Capital: Vientiane (Viangchan)
• Administrative divisions: 16 provinces (khoueng, singular and plural) and 1 capital city
Transnational issues
• Southeast Asian states have enhanced border surveillance to check the spread of avian flu; talks
continue on completion of demarcation with Thailand but disputes remain over islands in the Mekong
River; concern among Mekong River Commission members that China’s construction of dams on the
Upper Mekong will affect water levels.
1.2 Economic overview
The government of Laos, one of the few remaining one-party Communist states, began decentralizing
control and encouraging private enterprise in 1986. The results, starting from an extremely low base,
were striking - growth averaged 6% per year from 1988-2008 except during the short-lived drop caused
by the Asian financial crisis that began in 1997. Despite this high growth rate, Laos remains a country
with an underdeveloped infrastructure, particularly in rural areas. It has a rudimentary, but improving,
road system, and limited external and internal telecommunications. Electricity is available in urban areas
and in many rural districts. Subsistence agriculture, dominated by rice cultivation in lowland areas,
accounts for about 40% of GDP and provides more than 70% of total employment. The government in
FY08/09 received US$560 million from international donors. Economic growth has reduced official
poverty rates from 46% in 1992 to 26% in 2009.
Among others, the GDP growth capita growth performance of the country has slightly fallen from 7.9% in
2007 to 7.5% in 2008. The other economic indicators are as follow:
12Gross Domestic Product • Natural gas
• GDP (purchasing power parity): US$14.61 - production: 0 m3 (2008 est.)
billion (2009 est.) - consumption: 0 m3 (2008 est.)
• GDP (official exchange rate): US$5.721 billion - exports: 0 m3 (2008 est.)
(2009 est.) - imports: 0 m3 (2008 est.
• GDP – growth: 3% (2009 est.) - proved reserves: 0 m3 (1 January 2009 est.)
• GDP - per capita (PPP): US$2,100 (2009 est.) • Pipelines
• GDP - composition by sector - refined products 540 km (2009)
- agriculture: 39.2%; industry: 33.9%;
services: 26.9% (2009 est.) Exports and imports
• Budget: • Exports - commodities: wood products, coffee,
- revenues: US$937.1 million; expenditures: electricity, tin, copper, gold
US$1.123 billion (2009 est.) • Exports – partners: Thailand 35.4%, Viet Nam
15.5%, China 8.5% (2008)
Labor market • Imports – commodities: machinery and equip-
• Labor force: 2.1 million (2006 est.) ment, vehicles, fuel, consumer goods
• Labor force - by occupation • Imports – partners: Thailand 68.3%, China
- agriculture: 80%; industry and services: 10.4%, Viet Nam 5.8% (2008)
20% (2005 est.) • Natural resources: timber, hydropower,
• Unemployment rate: 2.4% (2005 est.) gypsum, tin, gold, gemstones
• Population below poverty line: 26% (2009 est.)
• Agriculture - products: sweet potatoes, Reserve, Debt, Aid
vegetables, corn, coffee, sugarcane, tobacco, • Reserves of foreign exchange and gold:
cotton, tea, peanuts, rice; water buffalo, pigs, US$715 million (31 December 2009 est.)
cattle, poultry • Debt - external: US$3.179 billion (2006)
• Industries: copper, tin, gold, and gypsum
mining; timber, electric power, agricultural pro Communications
cessing, construction, garments, cement, • Telephones - main lines in use: 97,600 (2008)
tourism • Telephones - mobile cellular: 1.822 million (2008)
• Industrial production growth rate: 2% • Radio broadcast stations: AM 7, FM 14, short
(2009 est.) wave 2 (2006)
• Television broadcast stations: 7 (includes 1
Energy station relaying Vietnam Television from Ha Noi)
• Electricity (2006)
- production: 3.075 billion kWh (2007 est.) • Internet hosts: 1,661 (2009)
- consumption: 3.068 billion kWh (2007 est.) • Internet users: 130,000 (2008)
- exports: 268 million kWh (2007 est.)
- imports: 475.9 million kWh (2007 est.) Transportation
• Oil • Airports - with paved runways
- production: 0 bbl/day (2008 est.) - total: 9
- consumption: 3,000 bbl/day (2008 est.) - 2,438 to 3,047 m: 2
- exports: 0 bbl/day (2007 est.) - 1,524 to 2,437 m: 4
- imports: 3,080 bbl/day (2007 est.) - 914 to 1,523 m: 3 (2009)
- proved reserves: 0 bbl (1 January 2009 est.)
13• Airports - with unpaved runways
- total: 32
- 1,524 to 2,437 m: 2
- 914 to 1,523 m: 9
- under 914 m: 21 (2009)
• Heliports: 1 (2009)
• Roadways: 29,811 km
- paved: 4,010 km; unpaved: 25,801 km (2006)
• Waterways: 4,600 km; note: primarily Mekong
and tributaries; 2,900 additional km are intermit
tently navigable by craft drawing less than 0.5 m
(2008)
• Merchant marine: total – 1 ship (1000 GRT
or over) 2,370 GRT/3,110 DWT; by type:
cargo 1 (2008)
1.3 Climate
Lao PDR has a typical monsoon climate with two distinct seasons: Rainy season from May to October and
Dry season from November to April. The southwest monsoon prevails from mid May to early October, while
the northeast monsoon dominates from early November to mid March. Generally, the average annual rainfall
ranges between 1400 mm and 2500 mm and exceeds 3500 mm over the central and southwest region.
Except in the northern part of the country, temperatures remain high throughout the year, with an
average highest temperature range between 35-380C and lowest temperature of about 16-18 0C. In the subtropical
regions of the north, the temperature range is much wider, cold air from China and Siberia occasionally
penetrates during the dry season, lowering air temperature to near zero. The maximum temperature
is 40°C (March, over low land) and minimum temperature is 0°C (high land).
Flood and drought are the main hazards in Lao PDR and both are dependent on the amount of rainfall. If the
annual rainfall is less than 2000 mm, drought sensitive areas will be affected. When more than 200 mm of
rainfall accumulate in 2 days, certainly this will lead to floods along the Mekong plain. Tropical cyclones are
not direct hazard, since their force is normally diminished once they have reached Lao PDR from the South
China Sea, but they can produce flood as a consequence of heavy rainfall. Up to three cyclones hit the
country annually, while flood, drought and landslides occur irregularly.
14SOCIO-ECONOMIC BENEFITS OF
HYDROLOGICAL AND
METEOROLOGICAL SERVICES
2
The increasing frequency of occurrence and severity of hydro-meteorological events in the country, especially
tropical cyclones, could result to higher human casualties and damages that can significantly slow down
economic development.
The assessment of the benefits of hydro-meteorological services, particularly the economic benefit-cost
analysis (BCA) can be a helpful tool in evaluating the benefits of upgrading the facilities of NMHS’s.
BCA’s can also be used as reference in identifying the investment areas (e.g. monitoring, modeling, research,
etc.) where funding support can be provided.
2.1 Weather and climate- data were collected from institutional sources.
dependent economic sectors These secondary data were enhanced by informed
Of the weather and climate-dependent economic assumptions provided by institutional key informants.
sectors of Lao PDR, agriculture, hunting, forestry In chronological order, the specific steps followed
and fishing as well as mining, manufacturing and in the measurement of the economic and social
utilities have been the most dominant contributors impacts of weather and climate-related disasters
to the national economy. In 2008, the individual and the potential benefits from planned NMHS
value added of these sectors respectively shared improvement for Lao PDR are the following:
44.2% and 27.3% to total value added (Table 2.1). - Identification of the different kinds of potential
Overall, the weather and climate-dependent direct economic and social damages resulting
economic sectors contributed 91.3% to total from weather and climate-related natural
value added in the same year. Because of this disasters and their affected economic and
large contribution, improvements in the NMHS social sectors;
that would reduce the damages due to weather - Determination of the different kinds of potential
and climate-related disasters will have very economic and social damages that have
significant impacts on the national economy. already been quantified by the institutional
and related data sources;
2.2 Methodology for computing - Collection of the quantified data of economic
socio-economic benefits and social damages;
- Measurement, based on certain assumptions,
The methodology employed for computing the of the increase/reduction in the value of
potential socio-economic benefits of planned economic and social damages as a result of
improvements in the NMHS done here is driven by the planned improvements in their NMHS;and
the availability of secondary data. The use of sec- - Measurement of the total economic and social
ondary data is necessitated by the limited time and benefits due to planned improvements in the
resources available for this work. The secondary NMHS.
15The weather and climate-related disasters and their potential direct impacts on the affected economic and
social sectors are presented below (Table 2.2). In addition to the potential direct impacts of weather and
climate-related disasters, there are potential indirect impacts on other sectors that have backward and forward
linkages to the mainly affected sectors. For instance, disruptions in agriculture may impact other sectors of the
economy through increases in the prices of agricultural goods and services in the market.
Table 2.1 Percent share of value added by weather and climate-dependent economic sector to Total
Value Added at 1990 constant prices of Lao PDR, 2000-2008
Sector 2000 2001 2002 2003 2004 2005 2006 2007 2008
Agriculture, hunting, 52.1 51.2 50.3 48.6 47.1 45.0 42.7 44.9 44.2
forestry, fishing
Construction 2.3 2.4 2.1 2.3 2.7 3.0 3.3 3.0 3.1
Mining, Manufacturing, 20.4 21.2 22.5 23.7 24.7 26.6 28.7 26.6 27.3
Utilities
Transport, storage and 5.8 6.0 6.1 6.3 6.5 6.3 6.3 6.4 6.3
communication
Wholesale, retail trade, 9.4 9.5 9.6 9.8 10.1 10.3 10.4 10.3 10.3
restaurants and hotels
Total 90.0 90.3 90.6 90.6 90.9 91.2 91.4 91.2 91.3
Source of data : United Nations Statistics Division
Table 2.2 Potential direct impacts of weather and climate-related disasters on different economic
and social sectors in Lao PDR
Economic/Social sector Potential Direct Impacts
Agriculture Lost income, disruption in operations, damaged irrigations, dams
and other agricultural infrastructure and facilities, etc.
Transportation & Lost income, disruption in operations, damaged transportation and
Communication communication infrastructure and facilities, etc
Economic Sectors Lost income, disruption in operations, damaged energy
Energy infrastructure and facilities, etc.
Tourism Lost income, disruption in operations, damaged tourism infrastructure
and facilities, tarnished image as a tourist destination, etc.
Human Settlements Lost and impaired human lives and property, reduction in land and
property values in affected areas, etc.
Health Lost income due to death or injury, disruption in operations, psychic
Social Sectors costs due to death or injury, cost of rehabilitation, etc.
Education Lost income, disruption in operations, opportunity costs of cancellation of
classes, rehabilitation costs of damaged schools and related property, etc.
Water Diminished water access and water availability, management and
control cost of water pollution, etc.
An examination of the secondary data available, however, showed that the data and information needed for
computing the value of the indirect impacts of weather and climate-related disasters are not available. Thus,
the computation done here considers only the direct socio-economic impacts of weather and climate related
disasters as generated from the institutional data sources.
Based on reduction of damages as a result of the planned improvement in the NMHS, the costs of the NMHS
improvements are taken in a succeeding section of this report. Based on the cost and benefit figures, the
cost/benefit (C/B) ratios are computed and compared with the ratio set by the WMO.
162.3 Results and analysis
Natural hazard-induced disasters
For the period, the country had 18 such disasters causing death to 145 people, homelessness to one million
people and injury to 463 persons. The disasters also affected more than 4 million individuals. In the same
period, annually on average, there was 1 disaster which occurred, 7 people who died, 50,000 persons who
were rendered homeless, 19 persons who were injured and 212.347 people who were affected (Table 2.3).
Table 2.3 Selected statistics related to weather and climate-related disasters
in the Lao PDR, 1990 to 2009
Number of disasters Number of persons Number of homeless Number of persons Number of persons
Year that occurred who died persons who were injured affected
1990 0 - - - -
1991 3 - - - 370,315
1992 2 32 - 252 269,027
1993 1 8 - 120 120
1994 1 - - - 190,000
1995 3 26 1,000,000 - 1,591,400
1996 1 30 - - 420,000
1997 0 - - - -
1998 0 - - - -
1999 1 - - - 20,000
2000 1 15 - - 450,000
2001 1 - - - 453,000
2002 1 2 - - 150,000
2003 0 - - - -
2004 0 - - - -
2005 0 - - - -
2006 0 - - - -
2007 0 - - - -
2008 1 6 - - 204,190
2009 2 26 - 91 128,887
Total 18 145 1,000,000 463 4,246,939
Average 1 7 50,000 19 212,347
Source of data: EM-DAT: The OFDA/CRED International Disaster Database
Notes:
a) In this table and the succeeding ones, the weather and climate-related natural disasters specifically include drought, extreme temperature,
flood, mass movement wet, storm and wildfire. Mass movement includes rockfall, landslide, avalanche and subsidence.
b) EM-DAT is a global database on natural and technological disasters that contains essential core data on the occurrence and effects of more
than 17,000 disasters in the world from 1900 to present. EM-DAT is maintained by the Centre for Research on the Epidemiology of Disasters
(CRED) at the School of Public Health of the Université catholique de Louvain located in Brussels, Belgium. The database is compiled from
various sources, including UN agencies, non-governmental organizations, insurance companies, research institutes and press agencies.
Priority is given to data from UN agencies, governments and the International Federation of Red Cross and Red Crescent Societies.
In terms of type of disaster, the disasters which occurred in recent years were mainly floods and storms. From
2005 to 2009, there were 2 floods causing death to 16 people and 1 storm causing death also to 16 people
in the country. 17Total socio-economic damages
The value of direct socio-economic damages caused The reduction in damages (Table 2.6) is assumed
by weather and climate-related disasters in Lao to start in 2012, a year after the start of the prject,
PDR for the 1990-2009 period and the estimated and increases up to 2016. A reduction in the
damages for the 2010-2029 period are presented economic damages of 2% annually from 2012
in Table 2.5. The estimated annual damages for to 2015 and 10% thereafter is further assumed
2010-2029 were computed as the average of the meaning that the effects of the improvement
actual annual damages for the 1990-2009 period gradually occur in equal increments until it reaches
adjusted to inflation taken from the World Develop- maximum effect by 2016 and onwards. While
ment Indicators of the World Bank. The average there are no available previous researches which
annual socio-economic damages for the 1990-2009 indicate the right percentage of damage reduction
period was at US$21.45 million and in the absence in damages which should be assumed, the 10%
of 2010 data is reflected as the estimated annual reduction in damages used here is based on in-
damages for that year. For the 1990-2009 pe- formed opinion of key informants and technical
riod, the total actual damages was US$429 million people and considered a conservative estimate.
while for the 2010-2029 period, the total estimated From 2010-2029 the estimated reduction in damages
damages was US$5,558.69 or average annual or the socio-economic benefits amount to US$
damages of US$277.93. These figures appear 542.99 million and the annual average reduction
large because they are still undiscounted but will is US$27.15 million.
drastically go down once discounted.
Table 2.6 also presents the discounted or net
It should be pointed out that damage data from the present value of the estimated reductions in
Annual Flood Report of the Mekong River Commission economic damages, or the socio-economic
are different from the damage data presented in benefits due to improvements of the NMHS of Lao
Table 2.5. In particular, this report shows that the PDR. The social discount rate used is 12% which
value of damages increased from US $28.56 millions is within the 10 to 12% used by the ADB for public
in 2005 to US$39.16 millions in 2008 or an aveage projects (Zhuang et al. 2007). The results show
annual damages of US33.86 million for the period that the total discounted socio-economic benefits
(Table 2.4). The average annual damages of US$21.45 from 2010 to 2029 are US$95.21 million while
derived from Table 2.5 are therefore lower and are the annual average benefits are US$4.76 million.
thus used in the computation here to be relatively These discounted figures are way lower than the
conservative in the estimation of damages and undiscounted figures shown in the same table.
consequently benefits of NMHS improvements.
Among the types of disaster, from 2005 to 2009,
floods caused no economic damages while
storms resulted to economic damages of US$100
million. Furthermore, in 1993 when annual
socio-economic damages were highest, these
damages were also caused by storms.
18Table 2.4 Summary of damages caused by natural disasters, Lao PDR 2005-2008
Sector Type of Damage Unit 2005 2006 2007 2008
Social Provinces affected No. 16 5 4
Districts affected No. 84 20 27 30
Villages affected No. 2,510 404 614 376
Families affected No. 85,553 13,549 35,097
People affected No. 480,913 89,849 118,074 104,819
People evacuated No. 356
Households affected No. 5,160 21 25,292 2,004
Households destroyed No. 29
People dead No. 4 5 2 7
Schools affected No. 116 13 11 63
Schools destroyed No. 29
Hospital/health center
locations affected No. 6 3 2 3
Hospital severely damaged No. 1
Agriculture Rice Crops affected/damaged Ha. 87,724 691,322 256,778 363.8
Rice crops destroyed Ha. 55,955
Subsidiary crops
affected/damaged Ha. 490.62 2005.9
Seedbed/nursery damaged kg 35,139
Cattle No. 351 343 720
Poultry No. 7,861 5,912 2,850
Livestock No. 2,124 298
Fishponds Ha. 296 98.2 136 473.8
Infrastructure Irrigation systems and water
channels damaged 3800US$ 259 sites 23 sites 197 sites
Canals destroyed m 14,787 53
Bridge damaged No. 5 2 10
Pumping Stations No. 82
Feeder roads affected Km. 119
National roads affected Km. 14 3.8
National and provincial
roads damaged m 70 314,378
Other facilities Water wells sites 929
Underground water well sites 812
Villagers toilette No. 4954
Total Estimate of Damage (Million US$) 28.56 39.16
* Note: Natural disasters include floods, tropical storms, and droughts. 2007 data is only for flash floods by tropical storm Lekima.
Source : Annual Flood Report. Flood Management and Mitigation Programme. Mekong River Commission. Available at
http://www.mrcmekong.org/free_download/research.htm.
19Table 2.5 Actual and estimated socio-economic damages due to weather and
climate-related disasters in Lao PDR, 1990-2029 (million US dollars)
Actual Damages Estimated Damages
Year Value Year Value
1990
- 2010 21.45
1991 1 2011 26.32
1992 25 2012 32.29
1993 302 2013 39.62
1994 - 2014 48.62
1995 - 2015 59.66
1996 - 2016 73.20
1997 - 2017 89.81
1998 - 2018 110.20
1999 - 2019 135.22
2000 1 2020 165.91
2001 - 2021 203.57
2002 - 2022 249.78
2003 - 2023 306.48
2004 - 2024 376.05
2005 - 2025 461.42
2006 - 2026 566.16
2007 - 2027 694.68
2008 - 2028 852.37
2009 100 2029 1,045.86
Total 429 5,558.69
Average 21.45 277.93
Source of data: EM-DAT: The OFDA/CRED International Disaster Database; World Development Indicators, World Bank
Note: There is no explanation from the source on what the specific damages are so it is assumed that these only include direct
damages. Average annual inflation rate is 22.7% from 1990-2009.
In the case of costs, there are two options for improvements in NMHS considered. The first, the stand-alone
option, is the case where the improvements are separate investments of the country while the second,
the regional cooperation option, means that the improvements are done as part of an integrated regional
system. Because of the efficiency effects of integration, the costs of the latter are lower than the former. The
undiscounted capital costs which will be spent at the start of the project for the stand-alone option is US$13.98
million while that with regional cooperation option is US$8.34 million. The discounted and undiscounted
operating and maintenance costs for the two options are provided in Table 2.7.
20Table 2.6 Estimated 10% reduction in the socio-economic damages, or the socio-economic benefits
due to improvements in NMHS in Lao PDR, 2010-2029 (million US dollars)
Year Undiscounted Value Discounted Value
2010 0.00 0.00
2011 0.00 0.00
2012 0.65 0.46
2013 1.58 1.01
2014 2.92 1.66
2015 4.77 2.42
2016 7.32 3.31
2017 8.98 3.63
2018 11.02 3.97
2019 13.52 4.35
2020 16.59 4.77
2021 20.36 5.23
2022 24.98 5.72
2023 30.65 6.27
2024 37.61 6.87
2025 46.14 7.53
2026 56.62 8.25
2027 69.47 9.03
2028 85.24 9.90
2029 104.59 10.84
Total 542.99 95.21
Average 27.15 4.76
Source of data: Table 2.5
The total costs of the NMHS improvements are the capital costs which are assumed to be spent at the
beginning of the project and therefore not discounted and the discounted O&M costs (Table 2.8). Again,
the undiscounted capital costs are US$13.98 million for the stand-alone option and US$8.34 million for the
regional cooperation option. The discounted O&M costs of US$4.34 million for the stand-alone option and the
US$2.59 million for the regional cooperation option are taken from Table 2.7. The discounted total benefits
are taken from Table 2.6. The discounted net benefits and C/B ratio are as defined earlier.
For the stand-alone system, the undiscounted plus discounted total cost of NMHS improvements is US$18.32
million while the discounted total benefits due to NMHS improvements is US$95.21 million when a 10%
decrease in damages is considered as benefits (Table 2.8).
For a system based on regional cooperation, the total cost of NMHS improvement is US$10.93 million
which is lower than the cost of a stand-alone system. Again, the discounted total benefits due to the NMHS
improvements are US$95.21 million when a 10% decrease in damages is considered as benefits. Therefore,
the discounted net benefits are US$84.28 million and the C/B ratio is 1:8.71. It is noted that the C/B ratios
generated above for both of the systems are similar to the C/B ratios computed by other studies on benefits
of meteorological and hydrological services. The derived C/B ratios are also higher than the WMO minimum
accepted ratio of 1:7 (Hautala et al., Tammelin 2007, Leviakangas et al. 2007).
21Table 2.7 Undiscounted and discounted operating and maintenance costs of improvements in
NMHS in Lao PDR, 2010-2029 (Million US$)
Undiscounted O&M Costs Discounted O&M Costs
Year Stand Alone Regional Cooperation Stand Alone Regional Cooperation
2010 0.00 0.00 0.00 0.00
2011 0.00 0.00 0.00 0.00
2012 0.14 0.08 0.10 0.06
2013 0.17 0.10 0.11 0.07
2014 0.21 0.13 0.12 0.07
2015 0.26 0.15 0.13 0.08
2016 0.32 0.19 0.14 0.09
2017 0.39 0.23 0.16 0.09
2018 0.48 0.28 0.17 0.10
2019 0.59 0.35 0.19 0.11
2020 0.72 0.43 0.21 0.12
2021 0.88 0.53 0.23 0.13
2022 1.08 0.64 0.25 0.15
2023 1.33 0.79 0.27 0.16
2024 1.63 0.97 0.30 0.18
2025 2.00 1.19 0.33 0.19
2026 2.45 1.46 0.36 0.21
2027 3.01 1.79 0.39 0.23
2028 3.69 2.20 0.43 0.26
2029 4.53 2.70 0.47 0.28
Total 23.86 14.23 4.34 2.59
Average 1.19 0.71 0.22 0.13
Note: O&M costs start in year 2012. In that year, O&M costs are estimated at one percent of the capital costs and then increases yearly at the
rate of inflation. The O&M costs are discounted using the social discount rate.
Table 2.8 Options, Costs, Discounted Total Benefits, Discounted Net Benefits and Cost-Benefit
ratios for improvements in NMHS in Lao PDR, 2010-2029
Option Total Costs Discounted Total Benefits Discounted Net Benefits Cost/benefit
(Million US$) (Million US$) (Million US$) Ratio (C/B)
Stand-Alone 18.32 95.21 76.89 1:5.20
Regional Cooperation 10.93 95.21 84.28 1:8.71
Source of data: Tables 2.6 and 2.7
22You can also read