Corn Production in Georgia 2021 - University of Georgia
←
→
Page content transcription
If your browser does not render page correctly, please read the page content below

Corn Production in Georgia 2021
Edited by:
 Corey Bryant

 Printing made possible by:
Georgia Agricultural Commodity Commission for Corn
Contents
2020 Corn Production in Georgia ............................................................................................................... 1
 Corey Bryant ........................................................................................................................................... 1
Agronomic Practices for Corn .................................................................................................................... 3
 Corey Bryant ........................................................................................................................................... 3
Corn Growth & Development ..................................................................................................................... 9
 Corey Bryant ........................................................................................................................................... 9
Fertilization ............................................................................................................................................... 13
 Glen Harris ............................................................................................................................................ 13
Scheduling and Managing Corn Irrigation ............................................................................................... 17
 Wesley Porter and Corey Bryant .......................................................................................................... 17
Weed Management in Field Corn ............................................................................................................. 23
 Eric P. Prostko – Extension Weed Specialist........................................................................................ 23
 Rotational Crop Concerns ..................................................................................................................... 28
Insect Control in Field Corn ..................................................................................................................... 32
 David Buntin ......................................................................................................................................... 32
Corn Disease and Nematode Management ............................................................................................... 46
 Bob Kemerait – Department of Plant Pathology .................................................................................. 46
Harvesting and Drying Corn ..................................................................................................................... 59
 Paul Sumner .......................................................................................................................................... 59
Protecting Stored Corn .............................................................................................................................. 64
 Michael Toews-UGA Entomology ....................................................................................................... 64
2020 Corn Outlook and Cost Analysis ..................................................................................................... 70
 Amanda R. Smith .................................................................................................................................. 70

2020 Corn Production in Georgia
 Corey Bryant
Corn production in Georgia continues to remain relatively stable over the past ten years (Table 1). As
farm production declined and shifted to a cotton/peanut rotation pre-2000, corn remained an important
crop to many as a benefit in the land rotation and vital to the diversity and stability of farm income. Corn
remains the third largest row crop in the state of Georgia and provides over $200 million dollars in
revenue for the ag economy. Georgia corn is also vital to the state’s livestock and ethanol industries. On
average, Georgia farmers produce more than 55 million bushels per year.
Table 1. Planted and harvested acres, and state average yield for corn grown in Georgia over the last 10 years.

 Year Planted Acres Harvested Acres Yield (bu/a)
 *
 2020 430,000 380,000 182
 2019 395,000 350,000 160
 2018 325,000 285,000 176
 2017 290,000 245,000 176
 2016 410,000 340,000 165
 2015 330,000 285,000 171
 2014 350,000 310,000 170
 2013 510,000 465,000 175
 2012 345,000 310,000 180
 2011 345,000 270,000 159
 *
 indicates preliminary data – subject to revision

Corn in Georgia
The majority of Georgia corn production is dent corn or field corn and agronomic production practices
vary by region. Across the state most of the corn is grown on 30 – 36-inch row spacings with some
growers going as wide as 40 inches and others going as narrow as 15 inches. In the Coastal Plain region
tillage systems are predominately conventional or strip-till whereas the Piedmont and Mountain regions
are predominately strip-till or no-till. Furthermore, in the Coastal Plain approximately 90% of the corn is
irrigated, compared to approximately 50% and 10% for the Piedmont and Mountain regions,
respectively. Irrigation is crucial in the Coastal Plain, where sandy soils with low water holding
capacities dominate, to achieve high yielding corn, while soils with greater water holding capacities and
shallow water tables in river bottoms help offset the effects of drought in the Piedmont and Mountain
regions.
Across all of these different production systems, Georgia corn growers have demonstrated the ability to
achieve great corn grain yields in the past. These yields have been achieved through adoption of modern
corn hybrids coupled with improved management technologies and careful attention paid to all
production practices. In 2020 multiple growers in Georgia had yields of 300+ bushels in irrigated
production systems and in 2019 a grower in north Georgia yielded 299 bushels in dryland production
systems. While many of these yields were achieved with great help from favorable environmental
conditions they were still a product of great management systems.
As you strive to increase you own corn yields the key is to carefully consider and track all of your
management decisions and practices throughout the growing season. Detailed field notes are not only a
 1
good way to understand what you did right during the growing season but more importantly to know
what went wrong. Knowing what went wrong during one growing season will help prevent the same
missteps in following years. The following chapters contain information gathered from years of research
in Georgia and will hopefully help you in making the best crop possible with maximum returns from
your 2021 corn crop.

 2
Agronomic Practices for Corn
 Corey Bryant
Soil Preparation
Your soil management program is the base on which your entire corn crop for the year is built. A good
soil management program: 1) protects the soil from water and wind erosion, 2) provides a weed-free
seedbed for planting, and 3) fractures root restricting subsoil hardpans or compacted layers. The land
should be worked no more than is necessary to achieve a smooth seed-bed or unacceptable moisture loss
can occur and compacted layers can be reintroduced. Water erosion is of greatest concern during the
winter months when high intensity rainfall occurs. Your best defense against water erosion is crop
residue left on the soil surface or a seeded cover crop, or adoption of no-tillage practices. Wind erosion
is of greatest concern on sandy Coastal Plain soils when strong spring winds occur after tillage
operations, and blowing sand can severely injure young corn plants. Your best defense against wind
erosion and “sand blasting” of a young corn crop is the adoption of conservation tillage practices such as
strip-till or slit-till.
Tillage
Compacted subsoil layers that restrict root growth are present in almost all Georgia soils. These
compacted subsoil layers can also restrict water intake of the soils and nutrient uptake by the plant.
Fracturing of the compacted layers is only achieved through deep tillage operations such as deep
turning, V-ripping, paraplowing, chisel plowing, or subsoiling. Research at many University and USDA-
ARS locations has demonstrated that in-row subsoiling increased corn yields more than 50% on soils
with compacted subsoil layers. Fracturing the compacted layer allows strong, well developed root
systems to form while providing greater area to exploit for moisture and nutrient availability.
Research from the Southeastern U.S. also demonstrates that full-zone fracturing of compacted subsoil
layers, such is achieved by paraplow, V-ripper, or turn plow, results in corn yields equivalent to in-row
subsoiling. The results of tillage studies conducted in Tifton, GA demonstrate that corn yields produced
in conservation tillage systems are equal to or greater than those with conventional tillage (Table 2).
While soils with greater clay content, such as those in the Piedmont and Mountain regions, may not have
to be subsoiled every year, sandy soils in the Coastal Plain easily reconstitute compacted subsoil layers
during the course of a single growing season.
Table 2. Corn yields from a tillage by crop rotation study conducted in Tifton, GA from 2003-2006.

 Tillage 2003 2004 2005 2006 Avg.
 Rip & Bed 163 178 189 203 184
 Strip 165 198 195 202 190
 Slit 148 195 200 199 186
 No-till 153 157 156 149 154
 Lsd P ≤ 0.10 NS 30 29 17

 3
Stand Establishment
Once you have established your base soil program the next most critical aspect of achieving maximum
yields and net returns is getting a good plant stand. The sensitivity of corn to different aspects of
planting, such as planting depth, highly variable spacing, and excess downforce, means that any misstep
in planting will likely lead to unacceptable stand establishment. You should inspect every component of
your planter for proper setup and functionality prior to planting the first seed of the year. Utilize the vast
knowledge base possessed by your County Extension Agent, UGA Precision Ag Specialist, and planter
companies to ensure all adjustments have been made properly for each field and field condition.
Remember, in many instances, once the seed furrow is closed the damage has been done and there is
no correcting the issue this year. Other key information to remember include:
 1) Calibrate your planter for proper seeding rates and seed drop.
 2) Ensure that disc openers are accurately aligned.
 3) Corn seed should be between 1.5 and 2-inches below the soil surface.
 4) Ensure adequate down pressure to close the furrow but not so much as to induce crusting.
 5) Ensure that the planter is level as you drive across the field.
Avoid planting when soil temperatures drop below 55o F as this will have detrimental effects on seed
germination. Variable seed emergence can reduce yields as much as 10-20% depending on the length of
delay. Generally, the greatest yields are achieved in fields where all plants have emerged within 12-24
hours of one another.
Hybrid Selection
There is no one corn hybrid that will fit every field in Georgia. Every year there is a vast array of
corn hybrids marketed by numerous companies in Georgia. Each hybrid varies from the others in
relative maturity; lodging, disease, and insect resistance; grain quality; yield potential; and adaptability
to differing geographical and production scenarios. Keep your production practices and field conditions
in mind when selecting hybrids for the year.
Proper hybrid selection is probably the most important decision you will make in determining final
yields. The best place to start when selecting corn hybrids is the previous year’s Corn Hybrid
Performance Bulletins (https://swvt.uga.edu/summer-crops/corn.html). This data will provide you with a
good reference yield potential for the different regions in the state when grown under good production
practices. After this consult your seed dealer’s fact sheets and sales reps to determine which hybrids they
recommend for your specific production system.
Any corn hybrid planted in Georgia should contain some level of resistance to leaf foliar diseases. This
is especially true in irrigated environments where increased humidity levels, fluctuating water
availability, and high populations will favor many diseases. Important foliar diseases to consider are:
northern and southern corn leaf blight, grey leaf spot, common rust, southern rust, anthracnose, and
maize chlorotic dwarf virus.
High grain quality ratings are also necessary to provide an opportunity for better marketing scenarios for
your crop. Grain quality measures are based on instances of ear rots and other pests which infect and
infest the actual ears. Selecting a hybrid with good husks can decrease moisture and insect penetration,
and minimize subsequent developments of ear or kernel diseases. Furthermore, hybrids with higher
grain quality ratings typically weather better during final dry-down.
 4
Hybrid relative maturity is another important consideration you must make when choosing seed for the
coming year. Generally, hybrids are classified as early, medium, or late maturity. Early and medium
maturing hybrids are typically better adapted to irrigated corn production than dryland production
because they, 1) mature 2 – 3 weeks earlier, 2) generally grow shorter and are less subject to lodging, 3)
may require less water due to the shorter growing season, and 4) are more suitable for use where large
acreages may require a harvest spread to improve harvest efficiency. Another key consideration point
when making relative maturity decisions is harvest timing. If you cannot harvest the field within 30 days
of reaching physiological maturity (i.e. black layer) then you should consider spreading out relative
maturities and/or planting dates. It is a good rule of thumb to not plant more in a day than you can
combine in a day. However, it is common for spring weather patterns do dictate planting rate more so
than harvest rate. If you must plant more acres in a day than can be harvested in a day it is advisable to
plant shorter and longer maturity hybrids in the same day to effectively space harvest timing.
Planting Dates
In order to increase your chances of avoiding yield limiting disease pressure corn should be planted as
early as possible. At planting soil temperatures at the 2-inch depth should be at or exceed 55o F.
Germination progresses slowly at temperatures between 55 and 60o F and emergence will take between 7
– 12 days. Conversely, germination will progress rapidly when corn is planted in soil temperatures
greater than 60o F and emergence will be prompt. If your 2-inch soil temperature is 55o F or above but
your forecasted weather could drop soil temperatures below this threshold then planting should be
delayed until warmer temperatures return. Pushing planting dates as early as possible also increases the
risk of frost or freeze damage to emerged corn. Typically, corn can withstand severe frost or freeze
damage without yield loss so long as the growing point is below the soil surface.
Optimum planting windows will vary based upon your location in Georgia. Corn planting can begin as
early as mid-March in South Georgia but may not begin until mid-May in north Georgia. Early planted
corn will traditionally out yield late planted corn regardless of region within the state. Delaying corn
planting into the summer can dramatically decrease yield potential. Generally speaking, yields decline
at a rate of ¾ bushels per day as you progress later in the planting window and can rise to about 2.5
bushels per day when planting after the optimal window. If corn planting is delayed into the summer
yield losses become much more dramatic. Studies in Tifton indicate that stress and disease tolerant
hybrids planted under irrigation in late-May to early-June only yield approximately 50% of mid-March
to early-April plantings.

 5
Plant Population and Row Spacing
There is no one plant population to maximize yield and net returns across all fields in Georgia. Optimum
populations vary according to soil type, hybrid, irrigation capabilities, and individual management
practices. Generally speaking, irrigated cropping systems can support greater plant populations than
dryland cropping systems. Current plant population recommendations for irrigated corn in Georgia are
between 28,000 to 36,000 plants per acre. Depending on your row spacing, irrigated corn populations
exceeding 36,000 plants per acre may reduce yields due to overcrowding and lodging. In dryland
cropping systems current plant population recommendations are between 18,000 and 20,000 plants per
acre in sandy soils. Those in regions with less sand content and more clay may be able to increase
dryland plant populations slightly due to increased water holding capacity. Exceeding 20,000 plants per
acre can work in dryland cropping systems on all soils in years of ample rainfall; however, the stress of
additional plants per acre would increase the likelihood of unacceptable yield loss in years of normal or
less than normal rainfall. Regardless of cropping system, seeding rates should exceed desired plant
populations by at least 10%. This over-planting will result in near desired final plant populations after
normal stand losses from uncontrollable factors.
Traditional row-spacings utilized in Georgia production is 36-inches. Many of the State’s high yield
corn growers have already made the switch to narrower rows such as 30- and 20-inches and a few have
even transitioned to 15-inch row spacing in corn. While row-spacings of 30 to 36-inches are adequate to
reach top yields, research has indicated that narrower row-spacings are associated with greater corn
yields (Table 3). Greater yields are achieved in narrow row-spacings by allowing plants to exploit more
soil area for moisture and nutrients while producing a fuller canopy to maximize total sunlight capture.
Table 3. Row spacing effect on corn yield from corn grown in Tifton, GA

 2003 2004 2005 2006 Avg.
 Row-Spacing (in)
 ----------------------------------- bu/acre -----------------------------------
 20 255 a* 263 a 230 a 267 b 254
 30 191 c 252 b 225 a 311 a 245
 36 232 b 250 b 202 b 257 b 235
 36 Twin 227 b 254 b 202 b 266 b 237
 *
 Numbers in a column followed by the same letter are not significantly different at P = .10

If you want to achieve the yield benefits associated with narrow row corn production but do not want to
or cannot invest the money in new implements then twin-row production systems may be an option. In
twin-row production systems it is crucial to achieve hardpan fracturing under the complete row and not
just in the seed-row. Standard straight shank subsoilers will only fracture a 6 to 7-inch zone at best
which does not cover both seed-rows within the single row. Switching to a paraplow subsoiler or v-
ripper will provide fracturing under the entire row but could delay field entry depending on rainfall
timing.
Table 4 illustrates plant populations at various row- and plant-spacings. This table should be used only
to estimate plant populations and not take the place of planter calibration. To double check your
calibration in the field, measure off the distance found in Table 5 and count the total number of seeds in
one row for that distance and multiply by 1,000 to get seed per acre. Repeat this procedure on several
other row units to ensure proper setup across the planter.

 6
Table 4. Approximate plant populations based on row-spacing and plant spacing within a row.

 Within row Plant Row Width (in.)
 Spacing (in.) 20 30 36 38 40
 4.5 38,700 36,700 34,800
 4.7 37,100 35,100 33,400
 5.0 41,800 34,800 33,000 31,400
 5.3 39,400 32,900 31,100 29,600
 5.5 38,000 31,700 30,000 28,500
 5.7 36,700 30,600 29,000 27,500
 6.0 34,800 29,000 27,500 26,100
 6.2 33,700 28,100 26,600 25,300
 6.5 32,200 26,800 25,400 24,100
 6.8 30,700 25,600 24,300 23,100
 7.0 29,900 24,900 23,600 22,400
 7.3 28,600 23,900 22,600 21,500
 7.5 27,900 23,200 22,000 20,900
 7.8 40,200 26,800 22,300 21,200 20,100
 8.0 39,200 26,200 21,800 20,600 19,600
 8.3 37,800 25,200 21,000 19,900 18,900
 8.5 36,900 24,600 20,500 19,400 18,400
 8.8 35,600 23,800 19,800 18,800
 9.0 34,800 23,200 19,400 18,300
 9.3 33,700 22,500 18,700 18,700
 9.5 33,000 22,000 18,300
 10.0 31,400 20,900
 10.3 30,500 20,300
 10.5 29,900 19,900
 10.7 29,300 19,500
 11.0 28,500 19,000
 11.5 27,300 18,200
 12.0 26,100
 12.5 25,100
 13.0 23,200
 13.5 23,200
 14.0

 7
Table 5. Length of row required for 1/1,000 th of an acre at common corn row-spacing in Georgia.

 Row Width (in.) Row Length for 1/1,000 acre
 20 26 ft. 2 in.
 30 17 ft. 4 in.
 32 16 ft. 3 in.
 36 14 ft. 6 in.
 38 13 ft. 9 in.
 40 13 ft. 1 in.

 8
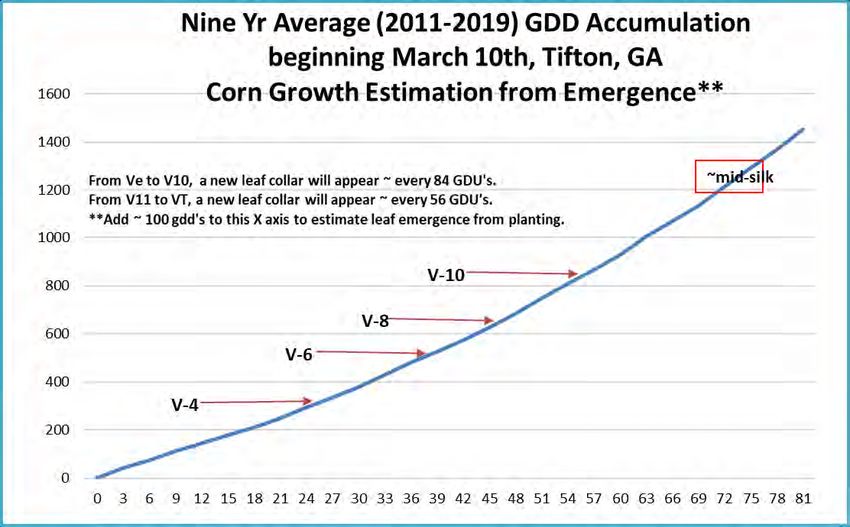
Corn Growth & Development
 Corey Bryant
Understanding corn growth and development and how the plant interacts with each input is the most
efficient way to profit from individual inputs. Your overall goal should be to provide each input
necessary for your yield goal at or shortly before the time it is needed. Corn yield is a function of the
interaction between the hybrid (genetics) and the environment. The growing environment includes soil
factors such as texture, pH, cation exchange capacity, organic matter, and compaction; climactic factors
such as sunlight, temperature, and water; and management factors such as crop protection and
competition. Ultimately, the management of all stressors to the best of your ability is the key to
obtaining maximum yields and net returns. Any stress the plant incurs can negatively affect growth rate
and yield components thus reducing potential yields. While preventing all stress may not be practical, it
is best to ensure that all practices you plan are conducted in a timely manner to have the best effect
possible.
Figure 1 illustrates a growth and development timeline of a corn plant. It is important to understand that
plant growth rate is driven by temperature. Measurements of cumulative heat, such as growing degree
units, are used to relate temperature to corn growth and development.

 A General Corn Growth & Development Timeline

 Kernel growth and fill

 Kernel initiation Kernel dev.

 Ear initiation and growth

 Tassel initiation and growth

 Internode elongation

 Leaf Growth and Appearance

 Leaf initiation
 Germination

 V4 V6 V12 V16 VT/ R2 R3 R4 R5 R6
 Emergence
 (VE)
 Plant

 R1

 University of Georgia Chart: Corn Growth and Development. Abendroth,
 Crop and Soil Sciences Elmore, Boyer and Marlay, Iowa State Univ., Ext.
 Pg. 4, PMR 1009, Mar. 2011

Figure 1. Typical growth and development timeline of a corn plant.

As corn grows and develops it will move through these growth stages very rapidly. Leaves are initiate
and continue to grow while the reproductive structures are initiated and growing. The plant’s first four to

 9
five leaves are visible inside the corn seed and will begin to grow following germination while the
remainder of the leaves initiated. In general, a corn plant may develop 18 to 20+ leaves depending upon
hybrid. Typically, all leaf initiation is completed by the V6 growth stage when tassel development is
initiated, followed shortly by initiation of the ear. At this point the plant will start determining the
number of rows on the ear. The initiation of florets (potential kernels) within a row soon follows and
continues growing until 7 to 10 days prior to silk emergence. Potential kernels near the base of the ear
develop first and progress towards the tip of the embryonic ear. The total numbers of harvestable grains
are related to those kernels that pollinate and begin filling at the R1 growth stage.
As you can imagine, it does not take long to transition from vegetative growth to reproductive growth. If
a plant is not healthy during the V3 to V5 growth stages it will not have time to recover by the time the
next yield component is determined. Stress during this time can undermine the overall yield potential of
the plant. Since growing degree units are used to relate temperature to the various growth stages, it is
important to know the different stages and understand how to calculate GDUs.
The following equation is used to calculate GDUs through the growing season:
 +
 = −
 2
Where Tmax is the maximum daily temperature but limited to 86o F, Tmin is the daily minimum
temperature but limited to 50o F, and Tbase is the base temperature set to 50o F. An example of this would
be the daily high temperature is 76o F and the daily low temperature is 58o F and the calculation would
be ((76 + 58) / 2) – 50 = 17 GDUs for that one day. If the daily high temperature exceeds 86o F then you
will not use the daily maximum temperature but the limit of 86o F as the Tmax.
When using GDUs to estimate corn growth stage it is important to know the approximate number of
GDUs required to advance from one growth stage to the next. Generally, a corn seedling will emerge
between 90 – 120 GDUs in the early spring. After emergence, a new leaf collar will appear at
approximately every 84 GDUs until V10 – V11, at which point the appearance of new collars is
accelerated at approximately every 56 GDUs.
While it is important to keep up with GDUs, you must recognize that GDU accumulation is variable in
each year. The variability in GDU accumulation between 2012 and 2013 is shown in Figure 2. If you do
not have a weather station on your farm, the easiest and most accurate source of weather data in Georgia
is found at http://www.georgiaweather.net. Make sure to select the weather station nearest to your farm.
The Georgia weather network can also calculate the number of GDUs for you. Select the icon “degree
day calculator” and begin the calculation using the day of emergence with 50o F as the base and 86o F as
the max. This tool will compare the current year with the previous three years. To be consistent, always
note the day of emergence in order to make valid GDU comparisons each year. If you choose to use
planting date, then always use planting date and not emergence. Whichever method you select just make
sure to be consistent across all years when making comparisons.

 10
V6 V6

Figure 2. Variability of GDU accumulation in a year between 2012 and 2013 in Tifton, GA when corn emerges on the same
date in each year.

The average number of days to accumulate GDUs required to reach various stages of growth is
illustrated in Figure 3. After emergence, it took an average of 26 – 27 days to get to V4 but only
averaged an additional 10 days to reach V6. This will give you an idea of how quickly corn plants can
transition through growth stages and how quickly a stress event can negatively influence yield.

Figure 3. Average number of days after emergence to accumulate enough GDUs to reach specified corn growth stages in
Georgia.

 11
Finally, it is important to know how to identify each growth stage by looking at the plant in the field.
Corn growth stages are split into V and R stages (Table 6). All these letters designate is if the plant is in
Vegetative growth stages or has transitioned into Reproductive growth. The most commonly used
method of determining vegetative growth stages is the “leaf collar method”. In this method growth
through the vegetative stages is determined by counting the total number of visible collars on fully
developed leaves. Corn enters reproductive growth stages once the silks emerge. Reproductive stages
are determined based off of the plant reaching specific landmarks with regards to pollination and kernel
development. Reproductive growth stages begin with R1 and continue through R6.
Table 6. Selected corn growth stages with when they appear and a brief description of each growth stage.

 Growth Stage Appearance Description
 VE Emergence Coleoptile emerges through the soil just prior to the first leaf collaring.
 V3 3 collars 3 Leaves have fully visible collars. Nodal roots are developing.
 6 Leaves have fully visible collars. The growing point is now above ground.
 V6 6 collars
 Tassel and ear development have begun and stress will affect yield potential.
 The lower 3 – 5 leaves are missing. Number of potential kernels is being
 V12 12 collars
 determined and stress will affect yield potential.
 V15 15 collars Potential kernel number is set.
 VT Tassel Last tassel branch is visible. Pollination is occurring.
 R1 Silking Silks beginning to emerge. Yield potential is VERY sensitive to stress.
 R2 Blister Ear length is complete. Max number of kernels is set.
 R4 Dough Kernel is at about 70% moisture.
 The top of the kernel has begun to dent. Milk line is visible and progressing
 R5 Dent
 downward.
 The black layer has formed at the base of the kernel and the plant has
 R6 Maturity
 reached physiological maturity. Moisture is approximately 30 – 35%.

 12
Fertilization
 Glen Harris
By nature, soils of Georgia are acidic and infertile; therefore, substantial quantities of limestone and
fertilizer are required for optimum fertility levels. Fertilizer recommendations are based on yield goals
and crop utilization. Corn harvested for silage requires more fertilizer than corn grown for grain
because silage removes from the field all the nutrients in the above ground plant parts. The removal of
potassium is especially great in corn harvested for silage compared to corn harvested for grain. A
comparison is given in Table 7 of the nutrients contained in grain and the stover.
 Table 7. Pounds of Nutrients Removed by the Grain and Stover of a 180-Bushel Corn Crop
 Grain Stover Total
 Nutrient
 —————— lbs/acre —————
 Nitrogen 170 70 240
 Phosphorus (as P2O5) 70 30 100
 Potassium (as K2O) 48 192 240
 Calcium 15 42 57
 Magnesium 16 34 60
 Sulfur 14 16 30
 Zinc 0.15 0.54 0.69

Liming
Many Georgia corn fields are naturally acidic. This acidity is primarily because of (1) increased use of
nitrogen in acid forming sources, (2) leaching of calcium and magnesium, and (3) nutrient removal by
high yielding crops. The advantages to liming such soils are:
 • Corrects soil acidity – Corn grows well in soil with a pH between 6.0 and 6.5 but is inhibited by
 a soil pH less than 5.7.
 • Supplies plant nutrients – All plants need calcium and magnesium for growth. Dolomitic liming
 materials containing these elements will increase yield on soil low in either or both of these
 nutrients.
 • Increases availability of other plant nutrients – Acid soils fix plant nutrients, especially
 phosphorus, in forms unavailable to plants. Liming acid soils will release fixed nutrients,
 making them more available to the growing crop.
 • Promotes bacterial activity – They break down soil organic matter to make soil nitrogen and
 other nutrients more available. Since most bacteria cannot live under very acidic conditions,
 liming acid soils increases bacterial activity.
Moreover, dolomitic limestone can be a source of magnesium. On the sandy soils of the Coastal Plain
area, magnesium is frequently a limiting nutrient. However, to be effective as a source of magnesium,
dolomitic lime must be applied several months prior to planting. If soil test results show that
magnesium levels are low and dolomitic limestone cannot be applied several months before planting,
apply a supplemental application of 25 to 50 pounds of elemental magnesium per acre before planting.

 13
Base Fertilization
Fertilizer recommendations depend on the soil fertility level as determined by soil tests and the yield
goal. Fertilization programs not based on soil tests may result in excessive and/or sub-optimum rates of
nutrients being applied. Take soil samples each fall to monitor the current fertility level. Use the yield
goal to determine the quantity of nitrogen, phosphate, and potash to apply. At high yield levels, the
balance of nutrients in relation to one another also is important.
 Nitrogen: In sandy Coastal Plain soils, nitrogen is very mobile. If excessive rainfall occurs or
excessive amounts of water are applied through the irrigation system, leaching losses of nitrogen can be
quite drastic during the growing season. To increase the efficiency of nitrogen recovery during the
season, split applications of nitrogen are recommended.
 Apply 25 to 30 percent of the projected nitrogen needs before or at planting. The remaining
nitrogen can be applied sidedress and/or injected through the center pivot systems (fertigation). If all the
nitrogen is applied with ground equipment, apply 50 to 75 pounds per acre at or before planting under
irrigated conditions and 20 to 50 pounds per acre in dryland environments and the rest when the corn is
12 to 16 inches tall.
 If nitrogen is to be injected through the irrigation system, apply 40 to 60 pounds at or before
planting and begin ground or injected applications of 30 to 60 pounds of nitrogen per acre when the corn
is 8 to 12 inches tall. Continue on a bi-weekly basis until the total required nitrogen is applied. Three to
five applications of nitrogen will be needed during the growing season.
 Nitrogen applications after pollination are NOT recommended unless a severe nitrogen
deficiency is detected.
 Phosphate and Potash: Apply all the phosphate and, on most soils, all the potash at or before
planting. Some of the phosphate requirements may be obtained through the use of starter fertilizer. On
deep sands, you should probably apply potash in split applications, half at planting and half at layby.
 Secondary and micronutrients: Corn requires a relatively large amount of sulfur, generally 20
to 30 pounds per acre. On deep sands, apply sulfur in split applications. All sulfur should be applied in
the sulfate (SO4) form. Applications with nitrogen may prove efficient.
 Base magnesium fertilization on soil tests. If the level is low, apply 25 to 50 pounds per acre of
water-soluble magnesium by layby.
 Zinc deficiency can be prevented by using three pounds per acre of actual zinc. Do not use zinc
unless soil test levels are low. If needed, apply pre-plant or at planting.
 Boron deficiencies can occur on sandy soils low in organic matter. Generally, use one to two
pounds per acre of boron applied in split applications. It is best to apply boron with the nitrogen
applications. The application of other essential nutrients should be based on plant analysis results.

Fertilizer Placement
The main objectives in fertilizer placement are to avoid injury to the young seedling and to use fertilizer
nutrients efficiently. Fertilizer applied too close to the germinating seed or emerging plant will cause
severe salt injury to the plant. With low soil moisture, the fertilizer salts will draw water away from the
plant roots causing the plants to wilt. It is important though to apply your nitrogen in a band near the
row (4 to 6 inches next to the row) particularly in soils where N easily leaches and where traffic rows
restrict root growth.

 14
Broadcasting fertilizer will help reduce the risk of fertilizer injury. Research shows that broadcasting
fertilizer is less expensive and just as efficient as banding on soils with medium fertility. If soil tests low
in phosphorus and potassium, it is better to place one-half of the needed fertilizer in a band near the row
and broadcast the rest.

Starter Fertilizer
Small amounts of nitrogen and phosphorus are often used as a starter or “pop-up” fertilizer. The main
advantage of starter fertilizer is better early season growth. Corn planted in February, March, or early
April is exposed to cool soil temperatures, which may reduce phosphate uptake. Banding a starter
fertilizer two inches to the side and two inches below the seed increases the chance of roots
penetrating the fertilizer band and taking up needed nitrogen and phosphorus.
Deduct the amount of nitrogen and phosphorus used in a starter fertilizer from the total nitrogen and
phosphorus needed for the season. However, total phosphate requirements of the corn crop can often be
supplied in the starter fertilizer. Since nutrients applied in starter fertilizers are a part of the total
fertilizer program, using this recommended practice is not very costly.
Currently, the most popular starter fertilizer is ammonium polyphosphate (10-34-0). Monoammonium
and diammonium phophates are equally effective. There is generally no advantage in using a complete
fertilizer (NPK) as a starter since applying phosphate is the primary objective. There is an advantage to
using additional N such as 28-0-0-5 particularly in sandy soils to encourage growth as soils warm.
Depending on your needs, a typical popup application is 6 to 7 gallons each of 10-34-0 and 28-0-0-5, as
described above.

Animal Manure
Animal manures such as poultry litter and lagoon water can be an excellent source of nutrients for corn.
It is important though to know the amounts of nutrients contained in the manure prior to making a
decision to use it as your main source of phosphorus and potassium. The majority of the nutrients
contained in the manure are readily available in the season. If you are using poultry litter, in general,
you should be able to use about 65% of the nitrogen and 80% of the phosphorus and potassium
contained in the litter the first year. For example, if your analysis is 50-50-50 per ton, and you apply
two tons per acre, then credit your fertility program 65 lbs of nitrogen, and 80 lbs of phosphorus, and
potassium the first year. At least 25% of the nitrogen should be available within the first two to three
weeks after application and the remainder throughout the season.

Plant Analysis
Soil tests serve as a sound basis for determining fertilizer requirements for corn; however, many factors
such as nutrient availability, leaching, and crop management practices may require modification in a
basic soil fertility program to maximize fertilizer use efficiency.
Plant analysis, a laboratory procedure used to determine the concentration of elements present in a plant,
can be used to (1) monitor the nutrient status of the plant and evaluate the appropriateness of the
fertilization program used, (2) confirm a suspected nutrient deficiency, or (3) detect low nutrient levels
before growth is affected.
Plant analysis usually consists of determining the concentration of the following essential plant
nutrients: nitrogen (N), phosphorus (P), potassium (K), magnesium (Mg), calcium (Ca), manganese
 15
(Mn), boron (B), copper (Cu), iron (Fe), zinc (Zn), and sulfur (S). The concentration found is a measure
of the plant’s nutrient status. The analysis is interpreted by comparing the concentration found to known
standards for the plant part and stage of growth when sampled. When the concentration of an element
falls outside the normally expected range, an evaluation and recommendation based upon the results and
information with the sample, is made. Information such as soil test level, soil type, and fertilizer and
lime applied is essential to properly evaluate a plant analysis and make a valid recommendation.
Do not substitute plant analysis for a soil test, but use it to determine (1) whether essential elements are
present in low, adequate, or excessive amounts in the plant and (2) whether the proper ratio of certain
elements exists. It is advisable to take plant samples throughout the growing season to monitor nutrient
status and detect any deficiencies or imbalances. What actually gets into the plant is really what counts
most. If a deficiency or imbalance is detected early enough, it can usually be corrected in time to
improve yield.

You can access the UGA plant analysis handbook at the following url:
http://aesl.ces.uga.edu/publications/plant/.

 16
Scheduling and Managing Corn Irrigation
 Wesley Porter and Corey Bryant
Irrigation requires a relatively high investment in equipment, fuel, maintenance and labor, but offers a
significant potential for stabilizing and increasing crop yield and proportionally net farm income.
Frequency and timing of water application have a higher impact on yields and operating costs than do
total amount of water. To schedule irrigation for the most efficient use of water and to optimize
production, it is necessary to frequently determine soil moisture conditions throughout the root zone of
the crop being grown. A number of methods for monitoring soil moisture have been developed and
employed with varying degrees of success. In comparison to investment in irrigation equipment,
scheduling methods are relatively inexpensive. However, there is a misconception that irrigation
scheduling equipment is too costly for the return. When properly utilized and coupled with grower
experience, a scheduling method can improve the grower’s chances of successful and profitable
production.

The utilization of any irrigation scheduling method is typically better than no plan or method at all,
particularly with corn. A good plan pays dividends in terms of yield, water-use efficiency (WUE) and
net returns. In corn, irrigating too late causes yield loss while irrigating too much wastes energy, water,
money and can leach or cause run-off of nutrients beyond the root zone. Unlike with cotton and peanuts,
the addition of too much water to corn does not directly reduce yields, but it can reduce net income due
to the added costs of additional irrigation applications without equivalent yield benefits. It is important
to note that studies have shown that a lack of irrigation and rainfall during peak consumptive periods can
deplete deep soil moisture, which is very difficult to replace via irrigation only. Thus, caution is advised
during high water requiring periods.

The most simple and practical way of scheduling corn irrigation is to use a moisture balance or
checkbook method. This method helps a grower keep up with an estimated amount of available water in
the soil as the crop grows. The objective is to maintain a record of incoming and outgoing water so that
an adequate balanced amount is maintained for crop growth. Growers require certain basic information
to use a checkbook method. This information typically includes the soil type of the field and/or soil
water holding capacity/and infiltration rate, expected daily water use of corn, and a rain gauge or access
to nearby rainfall information. An example of a checkbook method calculation is presented after Table
10. The UGA Corn Checkbook was developed from a historical average of evapotranspiration. This
method is very conservative and most often errors on the side of over irrigating rather than under
irrigating. However, caution is advised when utilizing the checkbook method alone as it was developed
from a historical average, and may not adequately address water requirements during extreme (either
wet or dry) years. This means that in years that are drier than average the checkbook method would tend
to under-irrigate and during years that are wetter than average it would tend to over-irrigate. The 2019
and 2020 production seasons were both prime examples of years in which we had abnormally hot and
dry weather. Many irrigation scheduling and application issues were observed during these years
because of this reason. In most “average” years these problems are masked by supplemental rainfall, the
lack of the rain during 2019 and 2020 made these problems very prevalent across the state. It should be
noted that the Checkbook alone does not account for soil water holding capacity. Thus, when using the

 17
Checkbook it is advised that soil information be considered to ensure adequate soil moisture is available
to the crop.
Checkbook type methods can be enhanced with other tools or methods such as the EASY pan method.
The UGA EASY (Evaporation based Accumulator for Sprinkler enhanced Yield) Pan
(https://extension.uga.edu/publications/detail.html?number=B1201-1) is designed to be easy to build and
operate, economical, and representative of the water used by the crop in humid areas. A couple of its
unique operating characteristics is the ability to read the unit from a distance and the fact that no record
keeping is required. This makes the Easy Pan a simple tool for scheduling irrigation. The float-based
mechanism is designed to represent both the effective root depth of a crop and the soil water holding
capacity. The covering screen on the pan unit is designed to limit evaporation to a level similar to the
evapotranspiration rate (water use) of the particular crop being grown.

Expert systems such as Irrigator Pro (software by USDA www.irrigatorpro.org), or other scheduling
softwares such as the SmartIrrigation Corn App are typically free and available to help you make
decisions regarding when to irrigate. Soil moisture measuring devices such as Meter® or Watermark®
(capacitance vs. tensiometric respectively) sensors can be used in conjunction with corn growth curves
to enhance irrigation scheduling as well. These devices provide instant readings of either soil moisture
content or tension in the root zone and can be used identify exactly when water is needed to replenish
the root zone.

Soil moisture sensors range in prices from $30 to $40 per sensor to $1000 + per sensor based on probe
type and associated data logging and telemetry capabilities. With these probes, data loggers (additional
expense) will be needed to log the data as the software is designed to accumulate the information. Each
data logger collects information from several probes that might be used in the field. Some devices have
the ability to collect and send information either through cellular, radio, or other wireless technology and
will vary in price and abilities. Thus, collection of information becomes simple and data can be directly
viewed on any computer, tablet, or smart phone. A few notable companies are: Meter
(www.metergroup.com); Irrometer (www.irrometer.com); and AquaSpy (www.aquaspy.com). There are
many other available devices on the market, it is up to the individual user to determine which type fits
their individual situation and need.

Tables 10 and 11 are provided to help you determine when to schedule irrigation by the checkbook
method. The estimated daily water use of corn is shown in Table 10. This table also provides growth
stage, days after planting and estimated water use in inches per day for hybrids with a relative maturity
of 115-119 days. Irrigation should be terminated at or just after black layer. Table 11 provides examples
of available water holding capacities of soils in Georgia.

 18
Table 10. Estimated Water Use of Corn in Georgia

 Days After
 Growth Stage
 Planting Inches Per Day

 0-7 .03
 Emergence and primary root developing.
 8-12 .05

 13-17 .07
 Two leaves expanded and nodal roots forming.
 18-22 .09

 23-27 .12
 Four to six leaves expanding. Growing point near surface.
 28-32 .14
 Other leaves and roots developing.
 33-36 .17

 Six to eight leaves. 37-41 .19

 Tassel developing. Growing point above ground. 42-45 .21

 Ten to twelve leaves expanded. Bottom 2-3 leaves lost. Stalks growing rapidly. Ear 46-50 .23
 shoots developing. Potential kernel row number determined. 51-54 .25

 Twelve to sixteen leaves. Kernels per row and size of ear determined. Tassel not visible 55-59 .27
 but about full size. Top two ear shoots developing rapidly. 60-64 .29

 Tassel emerging, ear shoots elongating. 65-69 .31

 70-74 .32
 Pollination and silks emerging.
 75-79 .33

 Blister stage. 80-84 .33

 Milk stage, rapid starch accumulation. 85-89 .34

 Early dough stage, kernels rapidly increasing in weight. 90-94 .34

 Dough stage. 95-99 .33

 Early dent. 100-104 .30

 Dent. 105-109 .27

 Beginning black layer. 110-114 .24

 Black layer (physiological maturity). 115-119 .21

The following example of the water balance or checkbook method demonstrates how to determine the
correct amount and how frequently to irrigate.

Example:

 19
Step 1. The soil type of the corn field is a Tifton soil series. In Table 11, look at the average available
 water holding capacity in in/ft increments (1.1 in/ft). Assuming a rooting depth of 24 inches (2
 ft), the total available water is 2.2 inches (2 ft x 1.1 in/ft)

Step 2. The corn crop is 65 days old. From Table 10, the daily water use is about .31 inches/day

Step 3. Determine the irrigation by setting a lower limit of available water due to soil tension. For this
 example use 50% of allowable soil water depletion. In other words, only half of the water in the
 root zone will be allowed to be depleted or is plant available. Therefore, 1.1 inches of water will
 be needed to replace the soil water that was either used or lost.

Step 4. Determine the amount of irrigation to apply by dividing the amount replaced by an irrigation
 efficiency. Assuming 75% as the irrigation efficiency, the amount of irrigation required is
 1.1/.75 = 1.47 or 1.5 inches.

Step 5. Determine the frequency of irrigation by dividing the amount of water replaced by water use per
 day. An example of frequency of water (either rainfall or irrigation) need:
 1.1 in /.31 in per day = 3.5 days.

Step 6. Therefore, it is necessary to apply 1.5 inches of water every 3.5 days to maintain 50% available
 water for 65-day old corn.

 20
Table 11. Examples of Available Water Holding Capacities of Soils in the Coastal Plain of Georgia

 Intake
 Available Water
 In/Hr for Bare Holding Capacity In:
 Soil Series Description Soil* In/Ft. Increments

 Faceville 1.0 1.3

 Greenville Sandy Loam, 6-12" 1.4

 Marlboro Moderate intake, but rapid in first zone 1.2 - 1.5

 Cahaba 1.2 1.0 - 1.5

 Orangeburg Loamy sand, 6-12" 1.0 - 1.3

 Red Bay Loamy subsoil, rapid in first zone, 1.2 - 1.4
 moderate in second

 Americus 2.0 1.0

 Lakeland Loamy Sand , 40 to 60 inches 0.8

 Troup Rapid permeability 0.9 - 1.2

 Norfolk Loamy sand, 1.3 1.0 - 1.5

 Ochlocknee 12-18" rapid permeability 1.4 - 1.8

 Dothan Loamy sand and 1.0 1.0 - 1.3

 Tifton sandy loam 6-12", moderate intake 0.8 - 1.0

 Fuquay Loamy sand, 1.5 0.6 - 8

 Lucy 24 - 36" 1.0

 Stilson Rapid permeability in first zone, 0.9

 moderate in second

 Wagram 0.6 - 0.8

* Increase soil infiltration rate in field where conservation tillage methods are used.

 21
IRRIGATION SCHEDULING
Probably the most important management decision about irrigation scheduling is yield potential and
water availability. For growers targeting yields of less than 150 bushels per acre or with less than 5
inches of water available, watch for visual signs of stress that occur just prior to tasseling. This will be
"leaf curling" typically occurring before noon. In this case a thorough application of water (up to 2.5
inches depending on soil type evenly distributed throughout a week) should be made as tassels begin to
emerge and another application of similar amount two weeks later. Do not adjust this timing unless very
heavy rainfall occurs. If water is still available a third application of the same amount could be made
two weeks after the second application. This would be considered a deficient or limited irrigation
strategy. Yield maximization is not expected in this type of irrigation strategy. This strategy is not
recommended unless there are very limited and specific cases.

Thus, if your field has a low yield potential, i.e. less than 150 bushels per acre or if you have a limited
supply of water to you should not irrigate until you see "leaf curl" at the tassel stage. At this point apply
2-2.5 inches of water every 14 days (1-1.25 inches back-to-back may be necessary) until you receive a
heavy rainfall or run out of water. In this case you would be deficit irrigating, and should not expect true
irrigated yields from this field, as the irrigation would be strictly supplemental.

Corn growers who have yield goals of greater than 150 bushels per acre and have an adequate supply of
water available (>7 gpm/acre of well capacity) should consider more advanced and precise methods of
irrigation scheduling to help eliminate ALL periods of drought stress. Visual stress should never be a
valid way to schedule irrigation if an adequate water supply is available. To effectively schedule
irrigation, soil moisture monitoring with remote data access is highly recommended. Devices such as
soil water potential sensors can be used to monitor water use and increase water-use efficiency by more
accurately scheduling irrigation events. Irrigation should be triggered whenever soil moisture levels
approach a recommended trigger level based on soil type. This system allows efficient water use and
promotes high yield potentials. Observe and make decisions on irrigation frequency and amount at a
minimum of a daily basis during peak water demand, based on soil moisture levels. Typically, these
decisions can be reduced to three times per week for the first 50 to 60 days after planting. However, if it
is dry during the early part of the season it is suggested that daily soil moisture checks be performed.
The addition of an irrigation scheduling regime will increase the management intensity of the irrigation
system. Thus, this should be expected and planned for once an advanced irrigation system is
implemented. However, the extra time and labor required for these decisions will typically be rewarded
by increases in yield and/or reductions in irrigation applied translating to an increase in WUE, thus net
farm income. Keep in mind irrigation system capacity so that you can better match the crop
requirements with the amount of irrigation available. For more in-depth irrigation scheduling
information contact your county agent.

 22
Weed Management in Field Corn
 Eric P. Prostko – Extension Weed Specialist
One of the most important aspects of field corn production is weed management. Uncontrolled weeds
not only reduce corn yields through their competition for light, nutrients, and moisture, but they can
severely reduce harvest efficiency. Before implementing a weed management plan for field corn,
several factors need to be considered including weed species, rotational crops, and cost/A.

Georgia’s Field Corn Weed Problems

The top 10 most troublesome weeds in Georgia field corn are as follows: 1) Texas panicum; 2)
crabgrass; 3) morningglory species; 4) pigweed species; 5) sicklepod; 6) nutsedge species; 7)
johnsongrass; 8) annual ryegrass; 9) Pennsylvania smartweed; and 10) Benghal dayflower.

Weed Competition in Field Corn

Uncontrolled weeds have caused field corn yield reductions in UGA weed science research trials that
range from 16% to 56% (34% average). If a weed management program in field corn is going to be
successful and economical, a thorough understanding of the competitive effects of weeds is important.

In regards to this area, three things must be considered: 1) How many weeds are there and when did the
weeds emerge in relationship to the crop?; 2) How much yield loss are they actually causing?; and 3)
When do the weeds need to be controlled in order to prevent significant yield losses?

Research has shown that weeds that emerge just prior to or at the same time as corn crop cause greater
yield losses than later emerging weeds. Consequently, the use of effective weed control programs from
20 to 45 days after planting (DAP) usually prevents yield losses due to weed competition. Weeds that
emerge 45 DAP will likely not cause competition-related yield losses but can have a negative influence
on seed quality and harvest efficiency (i.e. annual morningglory). Other research has shown that corn
can tolerate a certain level of weed pressure and that control strategies should only be implemented
when the potential yield losses caused by the weeds exceeds the cost of control (i.e. economic threshold
concept).
However, recent concerns about herbicide-resistant weeds have caused many growers to re-consider a
zero-tolerance policy for weeds with the goal of reducing seed-rain back into their fields.

The following table illustrates the influence of various weed species on corn yield:

 23
Table 1. Number of weeds/100 feet of row that cause yield reductions in field corn.

 Weed Corn Yield Loss (%)
 1 2 4 6 8 10

 Cocklebur or 4 8 16 28 34 40
 giant ragweed

 Pigweed or 12 25 50 100 125 150
 lambsquarters

 Morningglory 6 12 25 50 75 100
 or velvetleaf

 Smartweed or
 10 20 40 60 70 80
 jimsonweed

 Yellow
 400 800 800+ 800+ 800+ 800+
 Nutsedge

Source: Pike, D. R. 1999. Economic Thresholds for Weeds. University of Illinois, Cooperative Extension.

Field Corn Weed Management Strategies

The most effective weed management programs in corn use a combination of cultural, mechanical, and
chemical control strategies. Cultural practices include such factors as planting date, planting rate, and
row spacing. Cultural practices improve weed control by enhancing the competitive ability of the field
corn. Mechanical practices, such as cultivation, are a non-chemical method for controlling weeds
between rows. A multitude of herbicides are labeled for use in field corn and can be applied preplant
incorporated (PPI), preemergence (PRE), postemergence (POST), and post-directed (PDIR). A
complete update on the herbicides recommended for use in Georgia can be found at the end of this
section.
Atrazine

The foundation of weed management systems in all field corn production systems is atrazine. Atrazine
provides broad-spectrum control of many weeds with excellent crop safety. Atrazine can be applied
PPI, PRE, or POST (up to 12” tall). Numerous pre-mixtures are available that contain atrazine + a grass
herbicide (Bicep, Bullet, Guardsman, Lexar EZ, etc). Generally, these pre-mixtures will provide broad-
spectrum weed control when applied PRE. However, they are usually not very effective for the control
of Texas panicum. In order to protect both surface and groundwater, it is important to read and follow
 24
You can also read