Thembelihle Local Municipality - Local Economic Development Strategy March 2012
←
→
Page content transcription
If your browser does not render page correctly, please read the page content below
Thembelihle Local
  Municipality

Local Economic Development Strategy

            March 2012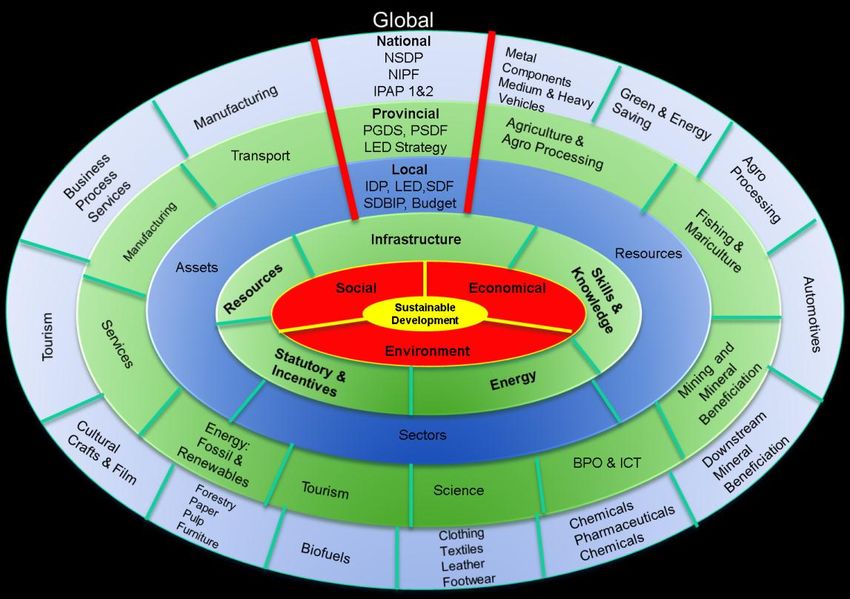
Contents

Section 1: Introduction ................................................................................................................. 1
   1.1. Background .................................................................................................................................. 1
   1.2. The LED Vision for Development ................................................................................................. 1
   1.3. The Purpose and Objectives of the Study .................................................................................... 2
   1.4. Geographic Context ..................................................................................................................... 3
      1.4.1. Thembelihle in Local Context ................................................................................................ 3
      1.4.2. Thembelihle in Regional Context .......................................................................................... 4

Section 2: Situational Analysis ...................................................................................................... 5
   2.1. Demographic Profile .................................................................................................................... 5
      2.1.1. The Population ...................................................................................................................... 5
      2.1.2. HIV/AIDS Prevalence ............................................................................................................. 7
   2.2. Socio-Economic Profile ................................................................................................................ 8
      2.2.1. Adult Education ..................................................................................................................... 8
      2.2.2. Poverty & Social Needs ......................................................................................................... 9
      2.2.3. Crime ................................................................................................................................... 13
   2.3. Economic Profile ........................................................................................................................ 14
      2.3.1. Economic Production & Growth ......................................................................................... 14
      2.3.2. The Character of the Local Economy .................................................................................. 17
   2.4. Labour Profile ............................................................................................................................. 17
      2.4.1. Overview ............................................................................................................................. 17
      2.4.2. Characteristics of the Labour Force .................................................................................... 19
   2.5. Institutional Profile .................................................................................................................... 20
      2.5.1. The Thembelihle Institutional Structure ............................................................................. 20
   2.6. Inferences for development ...................................................................................................... 22

SECTION 3: Potential Analysis ..................................................................................................... 23
   3.1. Introduction ............................................................................................................................... 23
   3.2. Agriculture ................................................................................................................................. 24
      3.2.1. Pixley Ka Seme Overview .................................................................................................... 24
      3.2.2. Thembelihle Overview ........................................................................................................ 24
      3.2.3. Factors in the Analysis of Development Potential .............................................................. 26

                                                                                                                                                        i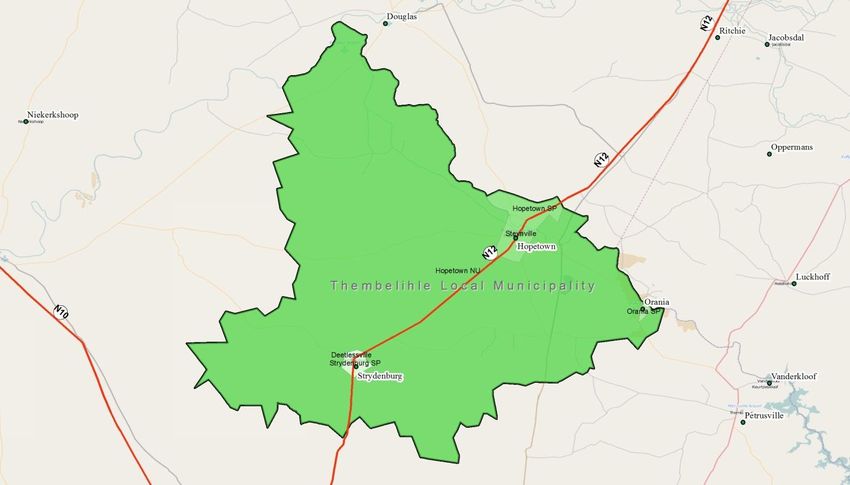
3.2.4. Development Potential ....................................................................................................... 27
   3.3. Mining ........................................................................................................................................ 28
      3.3.1. Pixley Ka Seme Overview .................................................................................................... 28
      3.3.2. Thembelihle Overview ........................................................................................................ 28
      3.3.3. Factors in the Analysis of Development Potential .............................................................. 29
      3.3.4. Development Potential ....................................................................................................... 32
   3.4. Manufacturing ........................................................................................................................... 33
      3.4.1. Pixley Ka Seme Overview .................................................................................................... 33
      3.4.2. Thembelihle Overview ........................................................................................................ 33
      3.4.3. Factors in the Analysis of Development Potential .............................................................. 35
      3.4.4. Development Potential ....................................................................................................... 38
   3.5. Utilities ....................................................................................................................................... 39
      3.5.1. Pixley Ka Seme Overview .................................................................................................... 39
      3.5.2. Thembelihle Overview ........................................................................................................ 39
      3.5.3. Water .................................................................................................................................. 40
      3.5.4. Development Potential ....................................................................................................... 43
   3.6. Retail and Wholesale Trade ....................................................................................................... 44
      3.6.1. Pixley Ka Seme Context ....................................................................................................... 44
      3.6.2. Thembelihle Context ........................................................................................................... 44
      3.6.3. Development Potential ....................................................................................................... 46
   3.7. Tourism ...................................................................................................................................... 46
      3.7.1. National and Provincial Context ......................................................................................... 47
      3.7.2. District and Local Context ................................................................................................... 47
      3.7.3. Development Potential ....................................................................................................... 48

SECTION 4: LED Framework ........................................................................................................ 49
   4.1. Local Development Context ....................................................................................................... 50
      4.1.1. Availability of Skills & Knowledge ....................................................................................... 50
      4.1.2. Available Energy .................................................................................................................. 51
      4.1.3. Development Incentives ..................................................................................................... 52
      4.1.4. Available Primary Resources ............................................................................................... 53
   4.2. Strategic Vision for Local Economic Development .................................................................... 55
      4.2.1. Development Pillars ............................................................................................................ 55
      4.2.2. Project Identification and Prioritisation.............................................................................. 58

                                                                                                                                                          ii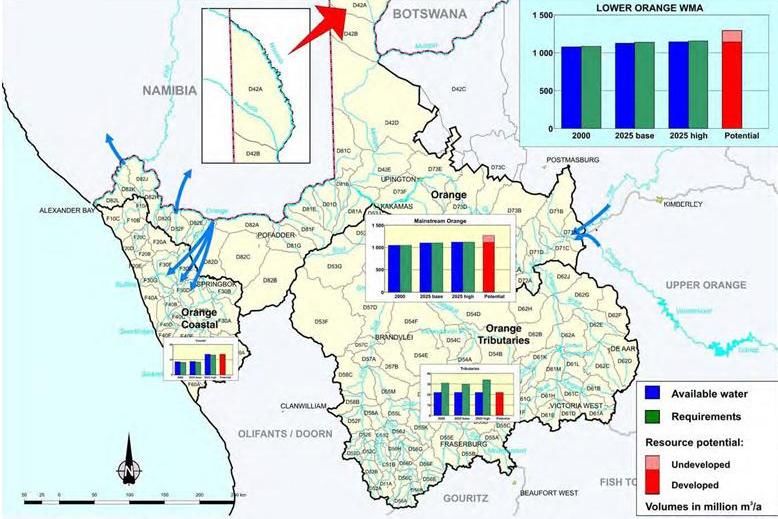
4.3. Policy Alignment ........................................................................................................................ 60
      4.3.1. New Growth Path................................................................................................................ 60
      4.3.2. The Industrial Policy Action Plan (IPAP2) ............................................................................ 61
      4.3.3. The Comprehensive Rural Development Programme ........................................................ 62
      4.3.4. The National Framework for Local Economic Development by CoGTA.............................. 63
      4.3.5. Northern Cape Provincial Growth and Development Strategy .......................................... 63
      4.3.6. Northern Cape Provincial Local Economic Development Strategy ..................................... 64
      4.3.7. Implications for Thembelihle .............................................................................................. 66

SECTION 5: Strategy ................................................................................................................... 67
   5.1. Economic Development ............................................................................................................. 67
   5.2. Institutional Development ......................................................................................................... 69
      5.2.1. The Thembelihle Institutional Structure ............................................................................. 69
      5.2.2. Institutional Recommendations for LED ............................................................................. 69

SECTION 6: Implementation Plan ................................................................................................ 71
   6.1. Strategy Implementation ........................................................................................................... 71
      6.1.1. Investment in business development and diversification .................................................. 71
      6.1.2. Further unlocking the potential of the Primary sector and beneficiation .......................... 72
      6.1.3. Improve the capacity and resources of the Municipality ................................................... 72
      6.1.4. Managing innovation .......................................................................................................... 72
      6.1.5. Incubators and Cooperatives as a platform for LED implementation ................................ 73
      6.1.6. The road to unlocking private sector investment ............................................................... 74
   6.2. Integrated Institutional Approach ............................................................................................. 78
   6.3. Phased Implementation Plan ..................................................................................................... 84
   6.4. Monitoring and Evaluation System ............................................................................................ 85
   6.5. The Way Forward ....................................................................................................................... 87

                                                                                                                                                 iii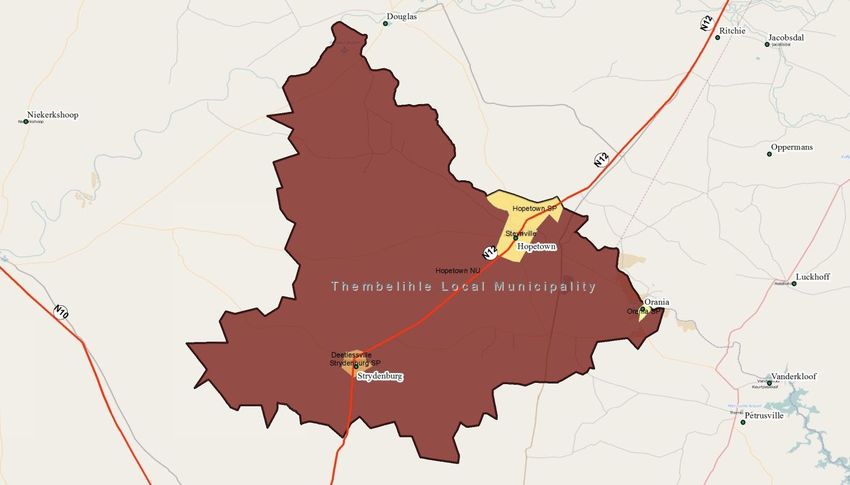
Thembelihle Local Municipality Local Economic Development Strategy
Section 1: Introduction
1.1. Background
Local Economic Development (LED) is an approach to sustainable economic development
that encourages residents of local communities to work together to stimulate local economic
activity that will result in, inter alia, an improvement in the quality of life for all in the local
community.
The Department of Economic Development and Tourism in the Northern Cape has recently
concluded the development of its Provincial LED Strategy in line with the Northern Cape
Growth and Development Strategy. These Strategies provide the foundation for Integrated
Economic Development Planning throughout the Northern Cape. To provide the necessary
implementation impetus at the local level, the Thembelihle Local Municipality embarked on a
process of developing its own LED Strategy in line with provincial planning imperatives.
1.2. The LED Vision for Development
The Municipality convened a community and LED role player Visioning Workshop on the 8th
of September 2011. During this workshop, participants highlighted the following main
visioning elements:
Sustainable development
Employment creation for local communities
Fast growing local economy
HIV/AIDS and crime free environment
An integrated and shared economy
These elements were then discussed and finally packaged into the following Vision
Statement:
“An integrated LED approach that creates sustainable
employment, with a growing local economy, free from HIV/AIDS
and crime that stands to benefit all.”
This vision for Local Economic Development sets the tone for the study, provides guidance
for analysis and informs the outcomes or recommendation of the Strategy.
Page |1
Thembelihle Local Municipality                               Local Economic Development Strategy

1.3. The Purpose and Objectives of the Study
The purpose of local economic development (LED) is to build up the economic capacity of a
local area to improve its economic future and the quality of life for all. It is a process by which
public, business and nongovernmental sector partners work collectively to create better
conditions for economic growth and employment generation to advance the economic
identity, based on a local competitive and comparative economic profile.

The aim of the Thembelihle LED Strategy is to build horizontal planning and development
consensus among the Local Municipality, local businesses and civil society towards building
the local economy together through a shared vision. The LED Strategy will also facilitate
vertical integration between local and other spheres of government to facilitate proper
regional planning alignment and development coordination in the District and Province. The
LED Strategy will focus on enhancing competitiveness and increasing sustainable growth,
while ensuring that this growth is inclusive.

The main objectives for the study have been identified as:
   1. Defining LED in the context of the Thembelihle Local Municipality.
   2. To develop a LED Development Framework and Strategy for the Municipality.
   3. Broadly assessing the provision for LED within the municipal area and more
      specifically, the institutional infrastructure and programmes available to implement
      LED initiatives.
   4. Broadly identifying economic opportunities broadly across the Municipal area.
   5. A proposed Implementation Plan to address gaps and solutions that contribute to a
      more coherent and coordinated LED approach.

The challenge of the project is to understand the current economic development imperatives
of the Thembelihle Local Municipality, within the context of the regional and larger economy,
as well as to understand the current institutional arrangements that support local economic
development.

In this context, the goal of the study has been formulated as follows:

   To formulate a LED Strategy for the Thembelihle Local Municipality aimed at
   enhancing competitiveness, information dissemination, investment facilitation
         and trade promotion and interpret and package this as a practical
  implementation strategy to guide investment and trade development in line with
                         the LED Vision and Objectives.

                                           Page |2
Thembelihle Local Municipality Local Economic Development Strategy
1.4. Geographic Context
1.4.1. Thembelihle in Local Context
Map 1.1 depicts the Thembelihle local municipal boundary. From this map, it is evident that
the municipal area includes the following main towns:
Hopetown (the seat of the Local Municipality)
Strydenburg
Orania
Map 1.1 – The Thembelihle Local Municipality, 2012
Source: Boundary data provided by the Municipal Demarcation Board, 2012
The municipal area encompasses a geographic area of some 6,986 km² which implies that
Thembelihle accounts for some 6.8% of the total District surface area. The local economy is
mainly agriculture-based and highly dependent on the Orange River, which runs through the
area. Although the area is well known for sheep farming, crops are also produced on the
banks of the river. Hopetown and Strydenburg are located next to the N12 highway, which
link the area to Kimberley and Cape Town (via its southbound connection to the N1).
Page |3
Thembelihle Local Municipality                             Local Economic Development Strategy

1.4.2. Thembelihle in Regional Context

Thembelihle is one of eight Local Municipalities in the Pixley Ka Seme District. The other
seven Municipalities are:
   1.     Siyancuma Local Municipality
   2.     Emthanjeni Local Municipality
   3.     Siyathemba Local Municipality
   4.     Umsobomvu Local Municipality
   5.     Ubuntu Local Municipality
   6.     Kareeberg Local Municipality
   7.     Renosterberg Local Municipality

Map 1.2 – The Pixley Ka Seme District Municipality, 2012

Source: Boundary data provided by the Municipal Demarcation Board, 2011

De Aar is the seat of the Pixley Ka Seme District Municipality (located in the Emthanjeni LM).
Hopetown is located some 181 km from De Aar and 123 km from Kimberley. Spatially,
Thembelihle is very distant from South Africa‟s largest consumer markets. In this regard, the
road transport distances illustrated by Table 1.1 would apply to LED initiatives.

Table 1.1 – Transport Distances from Thembelihle
City             Distance from Hopetown (km)
Upington                                     388
De Aar                                       181
Kimberley                                    123
Bloemfontein                                 283
Cape Town                                    833
Johannesburg                                 602
Pretoria                                     662
Durban                                       915

                                         Page |4
Thembelihle Local Municipality                             Local Economic Development Strategy

Section 2: Situational Analysis
The purpose of this Section is to describe the current reality of the area in the context of the
larger region, Northern Cape and South Africa. The situational analysis forms the basis for
the LED Strategy and sets the point of departure.

In order to plan for Local Economic Development, a good understanding of the economic
base, markets and how the local economy functions is vital. The situational analysis
investigates the economic and socio-economic trends of Thembelihle and provides base
data to identify and prioritise important issues for consideration in the LED planning process.
This facilitates an understanding of local resources, local businesses, what they produce,
where businesses‟ inputs come from, the marketplace, etc.

2.1. Demographic Profile
The local population of an area and its socio-economic implications lie at the root of the need
for LED planning and decision making by both government and the private sector. In the
strategic planning process this information informs forecasting and scenario development
towards potential future outcomes.

This sub-section intends to provide basic data on the local population in regional and
national context. Population growth trends will be illustrated to enable the study team to plan
for adverse situations, explore opportunities and to extrapolate the future. Local communities
form an integral part of the local economy. They are the primary source of labour and
entrepreneurship for economic growth and also the consumers of local products and
services. It is thus vital to analyse demographic indicators to provide the proper context for
socio-economic and economic realities as well as for strategic planning.

2.1.1. The Population

The local and regional population is illustrated by Table 2.1. From this Table, it is evident
that Thembelihle had a local population of almost 15,000 people during 2010.

Table 2.1 – The Local and Regional Population
Region                             2004         2006                  2008            2010
South Africa                    46,745,940    47,827,370            48,911,245      49,991,472
Northern Cape                    1,088,672     1,089,227             1,093,823       1,103,918
Pixley Ka Seme                      190,396      185,334               180,082         179,507
Thembelihle Local Municipality       16,549       15,743                14,839          14,606
Source: Quantec Research, 2012

In regional context, this meant that Thembelihle contributed 8.1% to the District and 1.3% to
the population of the Northern Cape.

                                         Page |5
Thembelihle Local Municipality                                                                                                                         Local Economic Development Strategy

Figure 2.1 – The Thembelihle Population Age & Gender Profile, 2000 & 2010
                                       Age & Gender Profile, 2000                                                                                              Age & Gender Profile, 2010

                 80 +                                             0.3       0.5                                                          80 +                                              0.5        0.8

               75 - 79                                            0.3       0.6                                                        75 - 79                                         0.8            0.6

               70 - 74                                           0.6        0.6                                                        70 - 74                                       1.2                1.3

               65 - 69                                      1.1               1.2                                                      65 - 69                                       1.4                1.2

               60 - 64                                      1.3                   1.5                                                  60 - 64                                       1.3                        2.2

               55 - 59                                 1.6                         1.8                                                 55 - 59                                 2.2                               2.7

               50 - 54                                2.0                             2.0                                              50 - 54                               2.7                                 2.6

               45 - 49                              2.3                                 2.3                                            45 - 49                                2.2                                     3.1
  Age Cohort

                                                                                                                          Age Cohort
               40 - 44                          2.8                                         2.8                                        40 - 44                               2.4                                2.2

               35 - 39                          3.0                                         3.0                                        35 - 39                          3.2                                      2.7

               30 - 34                     3.5                                                3.5                                      30 - 34                         3.5                                            3.3

               25 - 29                    3.9                                                     4.1                                  25 - 29                   4.2                                                    3.6

               20 - 24                   4.1                                                        4.3                                20 - 24             4.8                                                              4.1

               15 - 19             4.9                                                               4.8                               15 - 19       6.5                                                                           5.3

                10-14        5.9                                                                               6.1                      10-14              5.0                                                                          5.9

                  5-9        6.0                                                                                6.4                       5-9                     3.9                                                             4.8

                 0-4         5.8                                                                          5.4                            0-4                       3.7                                                      4.0

                         8         6            4            2          0         2           4            6          8                          8         6            4             2          0          2          4            6         8
                                                             % of Population                                                                                                           % of Population

                                                      Male         Female                                                                                                      Male          Female

Source: Quantec Research, 2012

The Age & Gender Profile of the local population is illustrated by Figure 2.1. With regards to
this profile, the following observations were made:

 1. There were slightly more females (50.6%) than males (49.4%) among the local
    population during 2010. This balance has been maintained over the past decade.
 2. The working age group (15 to 64) contributed 64.9% to the local population in 2010.
    This age group has increased proportionately (from 59.3% to 64.9%) in relation to the
    other age groups. In absolute terms, however, the working age group decreased slightly
    from about 9,900 people in 2000 to 9,500 in 2010.
 3. The working age population is slightly male dominant.
 4. The age dependency ratio declined from 0.7 in 2000 to 0.5 dependents (children & the
    elderly) in 2010 for every working age adult.
 5. Since 2000, the proportion of children under the age of 15 declined by 3.9% (on average
    per annum). This means that the age profile of the local population is becoming older.
    The number of children in the area declined from almost 6,000 during 2000 to about
    4,000 in 2010.

The population of Thembelihle declined from almost 17,000 people in 2000 to just below
15,000 in 2010 (see Figure 2.2). This implies that the population contracted by 1.4% on
average per annum. This growth rate is relatively lower than the Pixley Ka Seme DM, which
contracted 0.7% p.a. The decline of the Thembelihle population was mainly driven by lower
fertility rates.

                                                                                                           Page |6
Thembelihle Local Municipality Local Economic Development Strategy
Figure 2.2 – Population growth in Thembelihle between 2000 & 2010
17,500
17,000
16,500
16,000
15,500
15,000
14,500
14,000
13,500
13,000
2000 2001 2002 2003 2004 2005 2006 2007 2008 2009 2010
Thembelihle LM
Source: Quantec Research, 2012
The death rate (i.e. the number of deaths per 1,000 people in year) experienced a relative
increase from 10.8 in 1995 to 12.2 during 2010. During 2010, the death rate for Pixley Ka
Seme was 11.9 deaths per 1,000 people, while it was 13 for the Northern Cape and 16.4 for
the South African population. The reason for the lower death rate in the study area was
mainly the result of lower HIV/AIDS prevalence rates when compared with South African
averages.
2.1.2. HIV/AIDS Prevalence
The prevalence rate for HIV/AIDS in South Africa, the study area and the region is illustrated
by Figure 2.3. During 2010, the HIV/AIDS prevalence rate of the Thembelihle population was
5.2% compared to the District rate of 6.5%. These rates compared well to the Northern Cape
(7.6%) and South African (12.6%) averages in the same year.
Figure 2.3 – HIV/AIDS Prevalence Rates between 2000 & 2010
14.0%
12.0%
10.0%
8.0%
6.0% 4.8% 5.0% 5.2%
4.3% 4.6%
3.7% 4.1%
4.0% 2.9% 3.3%
2.4%
1.9%
2.0%
0.0%
2000 2001 2002 2003 2004 2005 2006 2007 2008 2009 2010
South Africa Northern Cape Pixley ka Seme DM Thembelihle LM
Source: Actuarial Society of South Africa, 2012
Page |7Thembelihle Local Municipality Local Economic Development Strategy
Since 2000, the number of people living with HIV/AIDS in the Thembelihle municipal area
more than doubled from about 300 to almost 800 people in 2010. This means that while the
local population compares well with South African averages (in terms of HIV/AIDS) the
prevalence rate is expanding faster in Thembelihle (at 8.9% p.a.) when compared with South
Africa (at 5.5% on average per annum since 2000).
2.2. Socio-Economic Profile
2.2.1. Adult Education
The levels of adult education (persons older than twenty years) in Thembelihle and the
larger region are illustrated by Table 2.2. From this Table, it is evident that 17.5% of local
adults did not complete any type of formal education whatsoever. This observation is in line
with the District average, but above the provincial and national average.
Table 2.2 – The levels of Adult Education in Thembelihle and the larger region, 2010
South Northern Pixley Ka Thembelihle
Level of Adult Education
Africa Cape Seme DM LM
Grade 0/No schooling 10.8% 12.7% 18.6% 17.5%
Grade 1/Sub A 1.3% 1.3% 1.7% 3.2%
Grade 2/Sub B 1.9% 1.9% 2.5% 2.5%
Grade 3/Standard 1 2.5% 3.0% 3.7% 4.3%
Grade 4/Standard 2 3.1% 3.9% 4.0% 4.7%
Grade 5/Standard 3 3.3% 4.4% 5.4% 5.3%
Grade 6/Standard 4 4.2% 5.7% 5.4% 5.6%
Grade 7/Standard 5 5.7% 7.3% 7.6% 6.8%
Grade 8/Standard 6/Form 1 7.0% 8.7% 8.6% 8.2%
Grade 9/Standard 7/Form 2 6.4% 7.0% 6.5% 6.0%
Grade 10/Standard 8/Form 8.8%
9.2% 9.8% 8.1%
3/NTC1
Grade 11/Standard 9/Form 5.4%
12.1% 7.2% 5.9%
4/NTC11
Grade 12/Standard 10/Form
19.8% 17.4% 13.4% 15.2%
5/Matric/NTC111
Less than matric & certif/dip 2.8% 2.3% 2.4% 1.2%
Certificate with Grade 12 2.0% 1.9% 1.7% 1.0%
Diploma with Grade 12 3.3% 2.5% 2.2% 2.0%
Bachelor's Degree 2.2% 1.2% 0.9% 0.8%
Bachelor's Degree and 0.9%
1.0% 0.7% 0.9%
Diploma
Honours degree 0.9% 0.6% 0.3% 0.3%
Higher Degree (Master's, 0.4%
0.7% 0.4% 0.3%
Doctorate)
Total 100.00% 100.00% 100.00% 100.00%
Source: Quantec Research, 2012
Page |8Thembelihle Local Municipality Local Economic Development Strategy
In terms of the proportion of adults who obtained a tertiary qualification, Thembelihle (5.3%)
fared worse that the District (6.3%) and Northern Cape (7.3%).
The adult education profile of Thembelihle did improve over the past ten years. Since 2000,
the number of adults with a matric certificate increased from about 900 (or 19.3% of the adult
population) to about 1,200 in 2010 (i.e. an average growth rate of 0.8% per annum).
2.2.2. Poverty & Social Needs
2.2.2.1. Household Access to Services
A total of around 4,000 household dwellings were estimated to exist in the Thembelihle
municipal area during 2010. This accounted for some 8.6% of all household dwellings in the
District, which ranked Thembelihle sixth among Pixley Ka Seme‟s Local Municipalities. Since
2000, the number of dwellings grew by only 0.1% on average per annum. This positive
growth rate is in contrast to the negative population growth rate (i.e. 1.4% p.a.), which
implies a housing shortage in Thembelihle.
Table 2.3 – Household Access to Services, 2000 & 2010
Household Indicator 2000 2010 Access Growth
House or brick structure 2,896 2,377 63.3% -2.0%
Electricity 2,739 3,362 82.8% 2.1%
Piped Water 3,872 3,904 96.6% 0.1%
Refuse removal 2,441 2,582 64.2% 0.6%
Flush or chemical toilet 2,221 2,702 66.8% 2.0%
Source: Quantec Research, 2012
Table 2.3 illustrates the type of dwellings found in Thembelihle and the level of household
access to municipal services. In this regard, the following observations were made:
1. More than 63% of household dwellings found in Thembelihle can be classified as
houses or brick structures on separate stands. This indicator is somewhat lower
when compared with the average for Pixley Ka Seme (80.1%) and the Northern Cape
(77.4%). Some 15.5% of local dwellings can be described as shacks.
2. More than 82% of household dwellings found in Thembelihle have access to
electricity. This indicator is on par with the District and Provincial average. Since
2000, the number of households with access to electricity grew by 2.1% on average
per annum.
3. More than 96% of household dwellings found in Thembelihle have access to piped
water. The area rated on par in terms of this indicator when compared with Pixley Ka
Seme (96.8%) and the Northern Cape (96.2%).
4. Around 64% of local households enjoyed a weekly refuse removal service by the
Local Municipality, compared to 76.2% in Pixley Ka Seme and 68.8% in the Northern
Cape.
5. Approximately 67% of local households have access to flush or chemical toilets. This
indicator is in line with the District (67.8%) and Provincial (67.8%) average. Those
households that do not have access to flush or chemical toilets, mainly make use of
pit latrines as their main source of sanitation.
Page |9Thembelihle Local Municipality Local Economic Development Strategy
2.2.2.2. Household Income & Expenditure
Trends in the level of monthly household income are portrayed by Figure 2.4. From this
Figure, it is evident that households in Thembelihle experience lower levels of income (on
average) when compared with the other regions illustrated in Figure 2.4. During 2010, the
average monthly income per household was R4,795 in Thembelihle, slightly higher than the
District average of R7,652.
Since 2001, household income has grown by 7.3% on average p.a. in Thembelihle
compared to 8.7% in Pixley Ka Seme and 9.1% in the Northern Cape. This means that there
is a growing welfare gap between households in Thembelihle and the larger region. Income
from sources other than labour remuneration has also been increasing. Such non-
remuneration income mostly includes social grants and other forms of transfers. Over the
past nine years the monthly non-remuneration income contribution (per household)
increased from R769 in 2001 to R1,213 in 2010 (i.e. by 5.2% p.a.). This means that local
communities are becoming more dependent on social grants (and other transfers).
Figure 2.4 – Household Income per month, 2001 - 2010
18,000
16,000
14,000
12,000
10,000
Rand
8,000
6,000
4,000
2,000
-
2001 2002 2003 2004 2005 2006 2007 2008 2009 2010
South Africa Northern Cape Pixley ka Seme DM Thembelihle LM
Source: Quantec Research, 2012
From a community development perspective, one should also consider the distribution of
income among local households to reflect the gaps between local income levels. A simple
average (as indicated by Figure 2.4) may provide a skewed picture of reality if there are a
few households that receive incomes that are substantially higher (or lower) than others in
an area. From Table 2.4 it is evident that the distribution of income among local households
is indeed highly skewed. Around 63% of local households earn less than R3,200 per month
and are regarded as poor. In comparison, some 67.8% of households in Pixley Ka Seme
and 63.8% in the Northern Cape fall in this category. The largest income group (representing
29.3% of local households) in Thembelihle are households who earn between R1,600 and
R3,200 per month. One the other side of the income scale, it can be observed that
households who earn more than R12,800 per month only represent 7.2% of households in
Thembelihle, compared to 7.7% in the District and 9.9% in the Province. Overall, 36.8% of
local households earn 80.5% of all income in Thembelihle (representing the income gap). In
Pixley Ka Seme, this gap is relatively the same with 32.2% of households earning 82.8% of
all income.
P a g e | 10Thembelihle Local Municipality Local Economic Development Strategy
Table 2.4 – Household Income Distribution, 2007
Northern Pixley Ka Thembelihle
Monthly Income South Africa
Cape Seme DM LM
R1 - R400 6.2% 4.4% 4.7% 2.4%
R401 - R800 11.1% 9.8% 9.1% 5.5%
R801 - R1 600 23.5% 25.1% 26.8% 26.0%
R1 601 - R3 200 23.7% 24.5% 27.1% 29.3%
R3 201 - R6 400 14.2% 16.4% 16.2% 19.8%
R6 401 - R12 800 9.4% 10.0% 8.3% 9.8%
R12 801 - R25 600 6.6% 5.8% 4.7% 4.3%
R25 601 - R51 200 3.5% 2.8% 1.7% 2.1%
R51 201 - R102 400 1.2% 0.7% 0.4% 0.7%
R102 401 - R204 800 0.4% 0.3% 0.7% 0.0%
R204 801 or more 0.3% 0.3% 0.2% 0.1%
Source: Statistics South Africa – Community Survey, 2007
Trends in the level of monthly household expenditure are portrayed by Figure 2.5. From this
Figure it is evident that households in Thembelihle have experienced only moderate
increases in expenditure levels (7.4% on average p.a.) over the past decade in comparison
with Pixley Ka Seme (9.0%) and the Northern Cape (9.2%).
Figure 2.5 – Household Expenditure per month, 2000 - 2010
16,000
14,000
12,000
10,000
Rand
8,000
6,000
4,000
2,000
-
2000 2001 2002 2003 2004 2005 2006 2007 2008 2009 2010
South Africa Northern Cape Pixley ka Seme DM Thembelihle LM
Source: Quantec Research, 2012
Table 2.5 illustrates the distribution in household consumption expenditure in the study area
and the larger region. From this Table, it is evident that households in all the areas under
observation spend most of their disposable income on food, beverages and tobacco.
Households in Thembelihle spend about 22% of their income on this product group.
P a g e | 11Thembelihle Local Municipality Local Economic Development Strategy
Table 2.5 – Household Consumption Expenditure, 2010
Household Expenditure South Northern Pixley Ka Thembelihle
Item Africa Cape Seme DM LM
Furniture, household
1.6% 1.3% 1.1% 0.9%
appliances, etc.
Personal transport equipment 4.2% 3.8% 3.7% 4.7%
Recreational and
1.4% 1.6% 1.7% 1.7%
entertainment goods
Other durable goods 0.7% 0.6% 0.6% 0.7%
Clothing and footwear 5.2% 4.3% 4.0% 2.8%
Household textiles,
1.4% 1.2% 1.0% 0.8%
furnishings, glassware, etc.
Motor car tyres, parts and
1.4% 1.2% 1.2% 1.5%
accessories
Recreational and
0.8% 0.9% 0.9% 1.0%
entertainment goods
Miscellaneous goods 0.5% 0.6% 0.6% 0.6%
Food, beverages and tobacco 26.4% 27.3% 26.5% 22.4%
Household fuel and power 3.5% 3.0% 3.1% 1.9%
Household consumer goods 4.0% 3.9% 3.8% 2.9%
Medical and pharmaceutical
1.8% 1.8% 1.9% 2.8%
products
Petroleum products 3.5% 3.2% 3.0% 3.7%
Recreational and
0.8% 0.7% 0.8% 1.2%
entertainment goods
Rent 12.3% 14.7% 15.2% 15.2%
Household services, including
2.7% 2.7% 2.8% 2.8%
domestic servants
Medical services 6.1% 6.0% 6.3% 7.1%
Transport and communication
8.9% 8.9% 9.1% 10.0%
services
Recreational, entertainment
4.3% 3.9% 3.9% 4.0%
and educational services
Miscellaneous services 8.8% 8.5% 8.7% 11.2%
Total 100.00% 100.00% 100.00% 100.00%
Source: Quantec Research, 2012
Although this expenditure profile would also be skewed in relation to the income profile, it
does reveal that local communities spend a larger part of their income on “necessary” items
rather than “luxury” items.
2.2.2.3. Access to Social Grants
During 2007, some 4,000 people in Thembelihle received social grants which accounted for
8.9% of such grants in the District. The most popular grant received by dependents in all four
regions under observation was the child support grant. In Thembelihle almost 1,900 people
received this grant during 2007. In fact, the child support grant made up 46.8% of all social
grants received in Thembelihle, slightly lower that Pixley Ka Seme and the Northern Cape.
These regions are, however, less dependent on the child support grant when compared to
the South African average of 64.5% during 2007.
P a g e | 12Thembelihle Local Municipality Local Economic Development Strategy
Figure 2.6 – The distribution of Social Grants, 2007
70.0%
60.0%
50.0%
40.0%
30.0%
20.0%
10.0%
0.0%
South Africa Northern Cape Pixley ka Seme DM Thembelihle LM
Source: Statistics South Africa – Community Survey, 2007
In Thembelihle, some 900 people received an old age pension while about 1,000 received a
disability grant during 2007.
2.2.3. Crime
During 2010, some 875 crimes were reported at police stations in the Thembelihle municipal
area. Since 2005, the total number of reported crimes has increased by 1.6% on average
per annum. Table 2.6 presents the distribution of crimes reported at local police stations
during 2010.
In Thembelihle, the most crimes were reported at the Hopetown (735 reported incidents)
police station during 2010, followed by Strydenburg (140 reported incidents). In this regard,
the following observations were made:
Hopetown – The most common type of reported incidence here during 2010 was
common assault, followed by drug-related crimes. The number of crimes reported at
the local police station increased from 699 in 2005 to 735 in 2010.
Strydenburg – The most common type of reported incidence here during 2010 was
also common assault, followed by assault with the intent to inflict grievous bodily
harm. The number of crimes reported at the local police station increased from 109 in
2005 to 140 in 2010.
Table 2.6 – Incidence of Crime reported at local Police Stations, 2010
Type of Crime Hopetown Strydenburg
Common assault 129 25
Assault with the intent to inflict grievous bodily harm 93 24
Drug-related crime 98 18
All theft not mentioned elsewhere 88 7
Stock-theft 46 23
Burglary at residential premises 63 4
Malicious damage to property 51 4
Burglary at non-residential premises 41 11
Total Sexual Crimes 26 7
P a g e | 13Thembelihle Local Municipality Local Economic Development Strategy
Type of Crime Hopetown Strydenburg
Crimen injuria 15 4
Theft out of or from motor vehicle 15 2
Common robbery 15 0
Murder 9 4
Attempted murder 10 0
Commercial crime 8 0
Driving under the influence of alcohol or drugs 7 0
Culpable homicide 5 2
Theft of motor vehicle and motorcycle 4 1
Aggravated Robbery 3 1
Neglect and ill-treatment of children 2 2
Arson 3 0
Shoplifting 3 0
Public violence 0 1
Kidnapping 1 0
Illegal possession of firearms and ammunition 0 0
Total 735 140
Source: The South African Police Service, 2011
Overall, the most common type of crime during 2010 in Thembelihle was common assault
(154 reported incidents), followed by assault with the intent to inflict grievous bodily harm
(117 reported incidents).
2.3. Economic Profile
The following sub-section provides an analysis of the local economy in the context of the
National, Provincial, and District environment.
2.3.1. Economic Production & Growth
Gross Domestic Product (GDP) is defined as the market value of all final goods and services
produced within an area in a given period of time. The size of an economy is usually
measured by its Gross Domestic Product. This value is equal to the economic wealth of the
area; all the things of economic value that can be bought or sold that have been produced in
the area in one year.
The Sectoral GDP Profile of Thembelihle is illustrated by Figure 2.7. From this profile, it is
evident that the economy is highly unbalanced and dominated by the Government Services
sector, which contributed R59 million (or 21.8%) to the local economy in 2010. This sector
was followed by the Trade (19.3%), Finance (18.9%) and Agriculture sectors (17.7%).
Since 2006, the local economy contracted by 0.5% on average per annum. The fastest
growing sectors during this period were Utilities (8.5%) and Construction (3.9%).
The local economy in District context is illustrated by Figure 2.8. From this profile, it is
evident that none of the local economic sectors made a significant contribution to that of
Pixley Ka Seme. Overall, the local economy contributed 7.8% to the District economy during
2010.
P a g e | 14Thembelihle Local Municipality Local Economic Development Strategy
Figure 2.7 – Sectoral Economic Profile of Thembelihle, 2006 - 2010
70
60
50
40
R'million
30
20
10
-
2006 2008 2010
Source: Quantec Research, 2012
An economic growth correlation can be observed between the local economy and the
District. This is mainly due to the dependence of both economies on Agriculture (i.e. similar
economic growth drivers).
Figure 2.8 – Sectoral Economic Profile of Thembelihle compared to Pixley Ka Seme,
2010
1,400
1,200
1,000
R' million
800
600
400
200
-
Pixley ka Seme Thembelihle LM
Source: Quantec Research, 2012
P a g e | 15Thembelihle Local Municipality Local Economic Development Strategy
The local economy grew by 1.7% during 2009/10 compared to the District (1.7%), Provincial
(2.3%) and National (2.8%) growth rates (see Figure 2.9). From 2000 to 2010, an average
growth rate of 0.8% can be observed in Thembelihle which was inadequate to create
sufficient jobs in the local economy to reduce the unemployment rate.
Figure 2.9 – Economic growth Profile in local and regional context, 2000 - 2010
8.0%
6.0%
4.0%
2.0%
0.0%
00-01 01-02 02-03 03-04 04-05 05-06 06-07 07-08 08-09 09-10
-2.0%
-4.0%
-6.0%
South Africa Northern Cape Pixley ka Seme Thembelihle LM
Source: Quantec Research, 2012
Table 2.7 illustrates the ten year average annual economic growth rates (2000 to 2010) in
Thembelihle and the larger region. From this Table is evident that growth in the local
economy was mainly driven by Utilities (9.6% p.a.), and Construction (3.0% p.a.). The other
sectors in the local economy contracted, or grew very little over the past ten years.
When compared to the larger region, it can be observed that local agricultural production
contracted while the sector expanded on District and Provincial level.
Table 2.7 – Average Annual Economic Growth by Sector, 2000 - 2010
Pixley Ka Seme Thembelihle
Sector South Africa Northern Cape
DM LM
Agriculture 1.7% 3.0% 2.0% -2.1%
Mining 0.1% -1.3% -5.0% 1.0%
Manufacturing 2.3% 2.6% 3.9% 0.3%
Utilities 1.8% -0.5% -0.7% 9.6%
Construction 8.3% 5.4% 2.8% 3.0%
Trade 3.1% 2.5% -0.2% 0.6%
Transport 5.0% 4.1% -1.3% -1.9%
Finance 5.9% 4.3% 6.6% 5.5%
Services 2.8% 2.9% 1.3% -1.5%
Total 3.5% 1.9% 1.7% 0.8%
Source: Quantec Research, 2012
P a g e | 16Thembelihle Local Municipality Local Economic Development Strategy
Overall, the Finance sector experienced more robust growth within Thembelihle (5.5% p.a.)
and Pixley Ka Seme (6.6% p.a.) in comparison with the Northern Cape average.
2.3.2. The Character of the Local Economy
A location quotient compares the local share of economic activity in a particular industry to
the regional share of economic activity in the same industry. The result reveals the degree of
local specialisation in each industry. If the location quotient for a particular industry is
between zero and one, the study area is less specialised than the region, while location
quotients greater than one reveal greater specialisation of the industry in the local economy
than in the regional economy. Also, observing location quotients over time show if an
industry is becoming more or less specialised in an area.
Figure 2.10 – Comparative Advantage (Location Quotient), 2000 & 2010
Location Quotient (2000) Location Quotient (2010)
4.5 4.5
4.0 4.0
3.5 3.5
3.0 3.0
2.5 2.5
2.0 2.0
1.5 1.5 Comparative Advantage
Comparative Advantage
1.0 1.0
0.5 0.5
0.0 0.0
Northern Cape Pixley ka Seme Thembelihle LM Northern Cape Pixley ka Seme Thembelihle LM
Source: Quantec Research, 2012
The location quotients for Thembelihle, Pixley Ka Seme, the Northern Cape and South Africa
are compared in Figure 2.10. From the 2010 profile, it is evident that Thembelihle has a
comparative advantage in agriculture and trade (in relation to the District) with LQ values of
1.1 and 1.4 respectively.
2.4. Labour Profile
2.4.1. Overview
The 2010 sectoral distribution of the labour force in South Africa, the Northern Cape, Pixley
Ka Seme and Thembelihle is illustrated by Figure 2.11. From this profile, it is evident that
most workers in Thembelihle are employed in the Government Services sector (around 800
workers), followed by Agriculture (about 700 workers) and the Trade (about 550 workers)
sectors.
Figure 2.12 provides a closer comparison between the sectoral labour profiles of Pixley Ka
Seme and Thembelihle. When compared to the District, it can be observed that the labour
force of Thembelihle is highly concentrated in the Agriculture and Trade sectors, while the
other regions under observation have a more balanced labour distribution.
Local and regional trends in total employment are depicted by Figure 2.13. From this Figure,
it is clear that total employment in Thembelihle has declined over the past decade from
some 4,000 jobs in 2000 to almost 3,000 jobs during 2010. Over a ten-year period, this could
be translated to an average annual decline of 3.9%. Over the same period, employment in
P a g e | 17Thembelihle Local Municipality Local Economic Development Strategy
Pixley Ka Seme declined by 1.3% on average per annum, while that of the Northern Cape
and South Africa increased by 0.9% and 0.5% respectively.
Figure 2.11 – Sectoral distribution of the Labour Force, 2011
45.0%
40.0%
35.0%
30.0%
25.0%
20.0%
15.0%
10.0%
5.0%
0.0%
South Africa Northern Cape Pixley ka Seme Thembelihle LM
Source: Quantec Research, 2012
Figure 2.12 – Sectoral distribution of the Labour Force, 2011
35.0%
Services
30.0%
Sector's contribution to Thembelihle's employment (%)
Agriculture
25.0%
Trade
20.0%
15.0%
10.0%
Manufacturing
5.0%
Construction
Utilities
Finance
Mining
0.0% Transport
0.0% 5.0% 10.0% 15.0% 20.0% 25.0% 30.0% 35.0% 40.0% 45.0%
Sector's contribution to Pixley ka Seme's employment (%)
Source: Quantec Research, 2012
P a g e | 18Thembelihle Local Municipality Local Economic Development Strategy
Figure 2.13 – Local and Regional Trends in Total Employment, 2011
8.0%
6.0%
4.0%
2.0%
0.0%
00-01 01-02 02-03 03-04 04-05 05-06 06-07 07-08 08-09 09-10
-2.0%
-4.0%
-6.0%
-8.0%
South Africa Northern Cape Pixley ka Seme Thembelihle LM
Source: Quantec Research, 2012
Employment growth is broken down by sector in Table 2.8. From this Table it is evident that
employment in the Agriculture (-10.5% p.a.) has been in steep decline over the past decade,
followed by Manufacturing (-5.7% p.a.) and Transport (-3.2% p.a.). When these employment
trends are compared with those observed for GDP (see Table 2.7) it is noted that total
employment declined over the past decade (by 3.9% p.a.), while the economy grew by 0.8%
per annum in GDP terms. This phenomenon is referred to as “jobless growth” which implies
that the local economy is becoming less labour intensive and more capital intensive. In
Thembelihle this is especially so with regards to agriculture.
Table 2.8 – Average Annual Employment Growth by Sector, 2000 - 2010
Sector South Africa Northern Cape Pixley Ka Seme Thembelihle
DM LM
Agriculture -7.3% -5.5% -6.2% -10.5%
Mining 2.8% 3.9% 0.5% 7.1%
Manufacturing -1.2% -3.2% -2.4% -5.7%
Utilities 1.1% 2.5% 1.8% 13.4%
Construction 0.1% -0.3% -3.4% -1.9%
Trade 1.1% 2.2% -0.5% 0.4%
Transport 2.1% 3.1% -2.1% -3.2%
Finance 2.6% 5.3% 7.6% 8.6%
Services 1.6% 3.1% 1.4% -1.9%
Total 0.5% 0.9% -1.3% -3.9%
Source: Quantec Research, 2012
2.4.2. Characteristics of the Labour Force
Key labour and employment indicators for Thembelihle and the larger region are presented
by Table 2.9 below:
From this Table the following observations were made:
While the number of jobs increased in South Africa and the Northern Cape between
2000 and 2009, it declined in Pixley Ka Seme and Thembelihle.
P a g e | 19Thembelihle Local Municipality Local Economic Development Strategy
During 2009, the unemployment rate for Thembelihle was estimated at some 37.3%,
which was relatively higher than the District average. The unemployment rate has
increased rapidly in Thembelihle over the past decade.
The labour force participation rate indicates the portion of working-age adults who
are employed and those actively seeking employment. Since 2000, the portion of
such adults decreased from 53.1% to 51.3%. This reflects that there are fewer local
jobs available, as well as the fact that unemployed adults are increasingly becoming
discouraged in their search for employment.
Compared to the other regions under observation, a small portion of workers (10.2%)
in Thembelihle can be classified as highly skilled, while more than 51% of workers
can be regarded as semi- or unskilled workers.
Table 2.9 – Regional Employment Indicators, 2000 & 2009
South Africa Northern Pixley Ka Thembelihle
Labour Indicators Cape Seme DM LM
2000 2009 2000 2009 2000 2009 2000 2009
Labour force ('000) 11,502 12,261 245 272 44 41 4 3
Unemployment rate 30.2 25.1 27.0 27.6 27.7 33.0 19.0 37.3
(%)
Labour force 61.1 52.0 52.5 53.3 54.0 53.6 53.1 51.3
participation rate (%)
Highly Skilled Workers 12.3% 12.7% 10.7% 11.7% 9.4% 10.9% 7.5% 10.2%
Skilled Workers 39.3% 42.7% 35.4% 39.7% 34.3% 38.6% 32.8% 38.1%
Semi- and unskilled 48.4% 44.5% 53.8% 48.6% 56.3% 50.6% 59.7% 51.7%
workers
Source: Quantec Research, 2012
2.5. Institutional Profile
Thembelihle‟s commitment to Local Economic development must be facilitated through a
dedicated administration and bureaucracy. This means that the Municipality‟s institutional
structure must be configured in such a way that it supports LED and that the whole institution
is geared towards integrated planning and implementation.
2.5.1. The Thembelihle Institutional Structure
Towards the end of making informed recommendations for implementing the LED Strategy
from an institutional perspective, it is important to outline the main objectives of the Strategy
to inform the Municipality‟s organisational structure. These objectives are:
1. To facilitate and promote employment creation and poverty alleviation among local
communities.
2. To promote internal and external investment into the local economy that would
promote the growth of existing businesses, as well as the establishment of new
businesses.
3. To ensure that local entrepreneurs and SMMEs are provided with the necessary
support to establish and grow their businesses.
4. To implement strategies, programmes and projects that would create an
environment conducive to investment and business growth.
5. To engage and interact with potential private sector investors.
6. To actively promote and market the local area to internal and external investors, in
terms of local investment opportunities, planned infrastructure developments by the
Municipality and development by other private investors.
P a g e | 20Thembelihle Local Municipality Local Economic Development Strategy
7. To investigate approaches for lowering the cost of doing business in the area, as
well as possible investment incentives aimed at strategic locations and economic
sectors (such as Agriculture & Tourism).
8. To plan for, evaluate, manage and implement LED programmes as a coordinated
effort between the Directorates of the Municipality and other role players.
9. To spearhead and drive community interaction, participation and buy-in of LED
initiatives in local communities.
10. To act as the guardian of local people by ensuring that LED initiatives benefit them
and that LED implementation occurs in such a way that labour intensive methods
are applied.
11. To facilitate local access to and taking full advantage of LED and other development
support programmes and funding sources provided by government, the private
sector and other institutions (such as DTI & IDC programmes and venture capital).
Due to the high levels of poverty, the concentrated nature of the local economy and the
growing unemployment rate, it is strongly recommended that an LED Directorate be
established that reports directly to the office of the Municipal Manager.
Diagram 2.1 – Recommended Institutional Structure for the LED Directorate
Director Local Economic
Development
Secretary
Support Officer: Agriculture & Manager: Investment
Tourism Marketing and LED
Diagram 2.1 illustrates the recommended institutional structure for the LED Directorate, in
line with the LED Strategy Objectives. This structure is deemed to be appropriate to drive
and manage the LED functions of the Municipality due to the following reasons:
The Structure aligns with the LED development objectives and is therefore geared
towards implementation.
The Structure has been streamlined to promote cooperative planning and integration
within the broader Municipal structure.
The Structure makes provision for hands-on management backed up by the
necessary support.
The Structure allows for clear and predictable performance monitoring of the LED
Directorate, as well as the officials assigned to it.
The Structure allows for Investment Marketing which is seen as a vital part of the
LED Strategy.
P a g e | 21Thembelihle Local Municipality Local Economic Development Strategy
2.6. Inferences for development
Based on the discussion and data presented in this Section the following inferences for
development can be drawn:
1. Thembelihle had a local population of almost 15,000 people during 2010. In regional
context, this meant that Thembelihle contributed 8.1% to the District and 1.3% to the
population of the Northern Cape.
2. Since 2000, the proportion of children under the age of 15 declined by 3.9% (on
average per annum). This means that the age profile of the local population is
becoming older. The number of children in the area declined from almost 6,000
during 2000 to about 4,000 in 2010.
3. The population of Thembelihle declined from almost 17,000 people in 2000 to just
below 15,000 in 2010. This implies that the population contracted by 1.4% on
average per annum.
4. Some 17.5% of local adults did not complete any type of formal education
whatsoever. Since 2000, the number of adults with a matric certificate increased from
about 900 (or 19.3% of the adult population) to about 1,200 in 2010 (i.e. an average
growth rate of 0.8% per annum).
5. A total of around 4,000 household dwellings were estimated in the Thembelihle
municipal area during 2010. This accounted for some 8.6% of all household
dwellings in the District, which ranked Thembelihle sixth among Pixley Ka Seme‟s
Local Municipalities. Since 2000, the number of dwellings grew by only 0.1% on
average per annum.
6. Since 2001, household income has grown by 7.3% on average p.a. in Thembelihle
compared to 8.7% in Pixley Ka Seme and 9.1% in the Northern Cape. This means
that there is a growing welfare gap between households in Thembelihle and the
larger region.
7. Around 63% of local households earn less than R3,200 per month and are regarded
as poor. In comparison, some 67.8% of households in Pixley Ka Seme and 63.8% in
the Northern Cape fall in this category.
8. During 2007, some 4,000 people in Thembelihle received social grants, which
accounted for 8.9% of such grants in the District. The most popular grant received by
dependents in all four regions under observation was the child support grant. In
Thembelihle, almost 1,900 people received this grant during 2007.
9. The local economy is highly unbalanced and dominated by the Government Services
sector, which contributed R59 million (or 21.8%) to the local economy in 2010. This
sector was followed by the Trade (19.3%), Finance (18.9%) and Agriculture sectors
(17.7%).
10. Most workers in Thembelihle are employed in the Government Services sector
(around 800 workers,) followed by Agriculture (about 700 workers) and the Trade
(about 550 workers) sectors. Total employment in Thembelihle has declined over the
past decade from some 4,000 jobs in 2000 to almost 3,000 jobs during 2010. Over a
ten-year period this could be translated to an average annual decline of 3.9%.
P a g e | 22You can also read