Summary Assessment of the Canary Islands
←
→
Page content transcription
If your browser does not render page correctly, please read the page content below

ESIC European Service Innovation Centre
        REPORT

Summary Assessment of
the Canary Islands
        Prepared by:

        Henri Lahtinen (Ramboll Management Consulting)
        Kimmo Viljamaa (Ramboll Management Consulting)
        Bianca Buligescu (MERIT)
        René Wintjes (MERIT)

        November 2013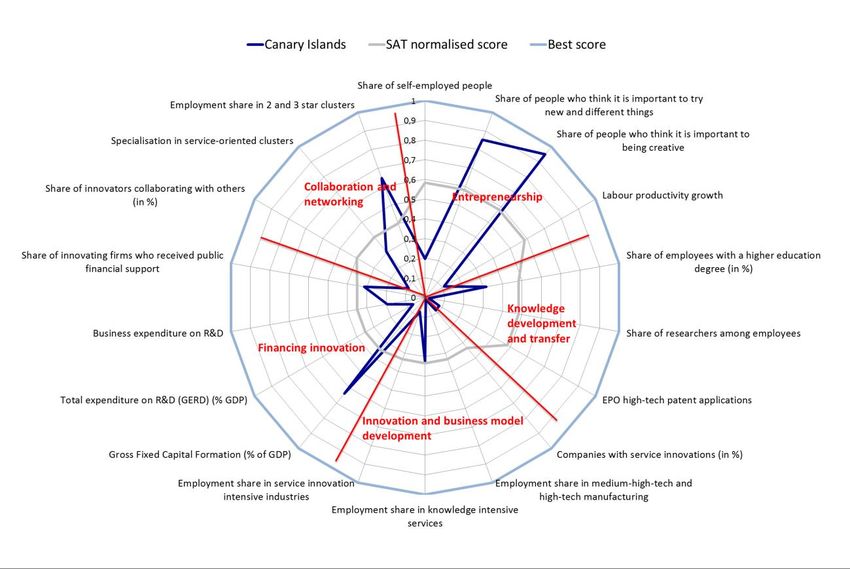
ESIC in Brief
Increasingly service innovation plays an instrumental role in the transformation and upgrading of traditional
economic sectors and industries into more productive, competitive and high value-added business eco-
systems. Considered as being multi-dimensional in nature, service innovation comprises innovation in
services, service sectors or service industries that are provided by service entrepreneurs and service firms.
It also takes place in manufacturing industries, adding further value and contributing significantly to overall
productivity and profitability. There is a growing need to assess, analyse and demonstrate what impact
service innovation has on industrial change and to assist Member States and regions towards a greater
understanding of service innovation as a driver of industrial transformation and future competitiveness.

The European Service Innovation Centre (ESIC) is a two-year initiative commissioned by the European
Commission’s Directorate-General for Enterprise and Industry to capture and demonstrate the dynamics and
large-scale impact of service innovation as well as to assess how service innovation impacts on
competitiveness, industrial structures and regional development. It will also focus on assessing the
implications and impacts of service innovation on employment structures, economic patterns and on value
creation.

Primarily, ESIC will provide customised advice to six selected model demonstrator regions (the Canary
Islands, Emilia-Romagna, Limburg, Luxembourg, Northern Ireland and Upper Austria). The initiative will also
help other Europe’s regions and Member States to make better use of the transformative power of service
innovation in strengthening existing and emerging industries and markets and to develop better industrial
policies and smart specialisation / cluster strategies. The goal of creating a favourable eco-system for
service innovation will boost supportive infrastructures and business conditions that, in turn, will facilitate
the take-up of innovative services throughout the economy.

           This work is a part of a service contract for the Enterprise and Industry Directorate-General of the European Commission.

                                  The views expressed in this report, as well as the information included in it,
              do not necessarily reflect the opinion or position of the European Commission and in no way commit the institution.
Table of Contents
1. The Challenge 1
2. Regional Performance and Potential 2
2.1. Socio-economic context for service innovation 2
2.2. Regional benchmarking 14
2.3. Opportunities and demands for service innovation 17
2.4. Assessment of regional performance 19
3. Regional Policy and Policy mix 21
3.1. Innovation policy and institutional background 21
3.2. The policy mix 23
3.3. Assessment of the regional policy mix 27
4. Large-Scale Demonstrator Strategy for the Future 33
5. Conclusions 40
Appendix A – Bibliography 41
Appendix B - Stakeholders consulted 43
Appendix C - Regional benchmarking analysis 44
Appendix D - Institutional fabric relevant for service innovation 48
Appendix E - Policy measures for service innovation 50
This work is a part of a service contract for the Enterprise and Industry Directorate-General of the European Commission.
The views expressed in this report, as well as the information included in it,
do not necessarily reflect the opinion or position of the European Commission and in no way commit the institution.Introduction
A strong, healthy, high value-added services sector is essential for the efficient operation of a modern
economy, for facilitating commercial transactions and for enabling the production and delivery of other high
value added goods and services. Service innovation represents the systematic development, design and
testing of new and/or improved service offerings, processes and business models, using multidisciplinary
social science, engineering and technology-enabled models, methods and tools. As it addresses the whole
economy and not only the service sector, service innovation is very relevant to achieving the EU2020 goals
of smart, sustainable and inclusive growth.
In this context, the European Service Innovation Centre is instrumental in pointing up the innovation
potential of service activities across Europe and supporting the assessment of how regions can both unlock
their service innovation potential and increase their economic performance significantly.
The purpose of this summary assessment report is to assess whether the regional policy mix of the Canary
Islands is conducive to the emergence of new business sectors/models or the transformation of existing
sectors/models, via the application of service innovation processes and concepts. This includes a mapping of
the economic change induced by service activities and service innovation and also an assessment of policy
options and policy support measures. Based on the analysis, the report provides policy recommendations for
a systemic approach to policies and better support for innovative companies, which offers a favourable
business environment conducive to structural change.
The report was prepared by Bianca Buligescu (bianca.buligescu@maastrichtuniversity.nl), Henri Lahtinen
(henri.lahtinen@ramboll.com), Kimmo Viljamaa (kimmo.viljamaa@ramboll.com) and René Wintjes
(r.wintjes@maastrichtuniversity.nl). The contents and views expressed in this report do not necessarily
reflect the opinions or policies of the Member States or the European Commission.
Copyright of the document belongs to the European Commission. Neither the European Commission, nor any
person acting on its behalf, may be held responsible for the use to which information contained in this
document may be put, or for any errors which, despite careful preparation and checking, may appear.
This work is a part of a service contract for the Enterprise and Industry Directorate-General of the European Commission.
The views expressed in this report, as well as the information included in it,
do not necessarily reflect the opinion or position of the European Commission and in no way commit the institution.Executive Summary
The region of Canary Islands demonstrates significant potential for the future. The archipelago, consisting of
seven islands, each with its own characteristics, attracts visitors all-year round. The flow of tourists has
sustained the local economy, which has several challenges to address including unemployment, especially
among young people, lower GDP per capita compared with mainland Spain and low levels of investment in
research and development in the private sector, which is dominated by micro-sized companies.
There are also certain framework conditions that present additional challenges to the future development of
the region. One of these is location, which creates additional costs for infrastructure and services, whilst
others include, for instance, tax and trade regulations. To tackle these issues, the Canary Islands have
chosen to focus on tourism as the key industry, as well as on other sectors that are important such as
environmental services, energy and the management of natural resources, transport and logistics and ICT.
Tourism is facing increasing competition, and the market is also becoming more diverse, due to an increase
in new niche markets. Therefore there is a need for a change towards a more versatile tourism sector that
can be supported by, and serve as leverage for, other industries.
The service sector, and especially tourism and construction, are the cornerstones of the Canary Islands’
economy with services contributing considerably to the value added. Employment in all sectors decreased
notably between 2008 and 2011, which hit services and construction the hardest, but this fall was
accompanied by a growth in labour productivity. Employment rates in knowledge intensive services and
service innovation intensive industries have, however, increased. While the total expenditure on R&D
(GERD) has remained stable, business expenditure has dropped between 2000 and 2010.
This assessment combines information derived from the European Service Innovation Scoreboard in terms
of structural indicators, the ESIC study visit and desk study of interviews, documents and other data, as well
as the self-assessment tool (SAT) that portrays the views of the regional stakeholders. When the five
functions of the innovation system - entrepreneurial activities, knowledge development and transfer,
innovation and business model generation, financing innovation and growth, and collaboration and
networking - are considered, the following observations can be made.
While the entrepreneurial spirit is high, the level of entrepreneurship is lower than in other locations with a
strong tourism sector, such as the Balearic Islands or Greece. The policies supporting entrepreneurial
activities are largely supply-oriented and tend to focus on traditional R&D.
Knowledge development and transfer is hampered by a lower level of education compared with EU27,
despite a relatively high share of tertiary education and excellence in certain sub-fields such as astrophysics
and renewable energy. Also, the related structural indicators are below the EU27 average. In addition,
awareness of service innovation is modest. It seems that knowledge generated in the universities and public
research institutes is not transferred to enterprises and vice versa, and there are not enough policies
supporting knowledge transfer between, and across, sectors as well as amongst students, researchers,
academics and entrepreneurs.
Regarding innovation and business model generation, the region of the Canary Islands is not a hotspot for
innovation, and consequently, innovation constitutes a function in which there is both the potential and the
room for improvement. The public sector is responsible for a large share of R&D, and non-technological
innovation is less common in the region than in mainland Spain or in Europe on average. Skills supportive of
innovation have been identified as a challenge, but there are only a few related policies implemented by the
Canary Office of Research, Innovation and Information Society (ACIISI). The need to use new business
models to create innovations is not yet fully reflected in the strategies and policies of the Canaries. ACIISI
can be seen as a forerunner in this context, and it should raise awareness of the importance and impact of
new business models and innovation amongst all actors in the innovation system.
Although the structural indicators suggest that financing innovation and growth is at a good European level,
the findings of the study, as well as the self-assessment, indicate a more challenging situation. Much of the
funding is derived from the EU structural funds and is used mainly for traditional R&D rather than creating
and implementing new business models and innovations. Taking a business to the next level often requires
seed or venture capital funding and access to such funding has been increasingly difficult on the Canaries.
New support measures have recently been created, but their feasibility and impact have yet to be assessed.
Furthermore, administration and bureaucracy are also hindering access to funding.
The number of sectoral networks and cluster organisations suggest a high level of collaboration and
networking. Cooperation seems, however, to take place in silos, both in the public and private sectors,
instead of being horizontal and cross-sectoral and this divide is reflected in the policy mix that contains
mainly traditional, cluster-based measures. There is relatively little specialisation in clusters that cut across
This work is a part of a service contract for the Enterprise and Industry Directorate-General of the European Commission.
The views expressed in this report, as well as the information included in it,
do not necessarily reflect the opinion or position of the European Commission and in no way commit the institution.the manufacturing and service sectors. Also, the share of innovative SMEs which collaborate with their peers
is very low compared to the average levels of Spain or EU27.
In conclusion, the current policy mix and administrative setting is not fully conducive to regional
transformation and the revitalisation of the regional economy. Based on the assessment of the regional
policy mix, all five functions of the innovation system can be improved. This might include:
Evaluating current support measures and developing the mix accordingly;
Increasing knowledge development and transfer by supporting the cross-fertilisation of ideas;
Involving more actors in innovation and business model generation by raising awareness and providing
suitable platforms;
Embracing all forms of innovation and taking a step away from traditional R&D; and
Decreasing the administrative burden faced by enterprises hoping to innovate and grow on the Canary
Islands, as well as internationally.
The large-scale demonstrator approach of the Canary Islands represents a good start, as a group of
important challenges has been identified, which suggests a need to diversify the regional, essentially
tourism-based, economy but there are several factors linked to existing framework conditions, which cannot
be solved by the regional authorities alone. However, the SAT results indicate a more positive view of the
existing situation compared with that of the ESIC team.
This work is a part of a service contract for the Enterprise and Industry Directorate-General of the European Commission.
The views expressed in this report, as well as the information included in it,
do not necessarily reflect the opinion or position of the European Commission and in no way commit the institution.1. The Challenge
The Canary Islands are a well-known tourist destination and receive an average of 12.5 million tourists per
year. The archipelago is characterised by several other factors such as being one of the EU’s outermost
regions and having a higher population density but a lower GDP per capita than mainland Spain.
Other economic indicators illustrate slow growth rates accompanied by high unemployment, especially
amongst the younger population. The enterprises on the islands are mainly micro-sized as such a
description fits 90% of all businesses. This is reflected in the low level of investments in private sector
research, development and innovation. Services are very important to the regional economy, as they
accounted for 82.38% of the regional gross added value in 2012. Tourism is considered to be a
strategic sector, as it represents 29.6% of the regional gross added value and 34.7% of the employment.1
The Concept Note identifies the following challenges for the Canary Islands: “the islands are located far
from mainland Spain, bringing additional costs for infrastructure and services (e.g. ICT, energy and
transport). Paradoxically, it has also suffered from a slow adoption of e.g. solar and wind energy sources
due to regulation, despite very good natural conditions. It also appears that some tax and trade regulations
aimed at protecting local industries may have had a negative effect on innovation. Future development is
seen to depend on submarine cables and relate to the absence of an adequate legislative
framework tailored to the specificities of the archipelago market. Although there are two universities on
the Islands, the educational level of labour force is rather low.”
To tackle these types of challenges the Canary Islands continue to build on strategic sectors such as
environmental services including the greening of industries, energy and the management of natural
resources, transport and logistics and, of course, tourism. Attention will also be paid to primary and
secondary sectors through the introduction of new environmental technologies and new business models.
As indicated in the Concept Note of the Canary Islands, the year-round tourism has demonstrated
resilience during economic turmoil and can be, on one hand, considered a real strength of the region.
The tourism sector, on the other hand, is in a state of stagnation and lacks the new and innovative
approaches needed to induce sustainable economic growth into the archipelago. Therefore, the Canary
Islands wish to develop a more versatile tourism sector that is supported by, but serves as leverage for,
other industries.
Key points:
The Canary Islands is a region faced with several challenges: location, high population density
accompanied by low GDP per capita, unemployment, dominance of micro-sized companies reflected in
the low level of private sector RDI investments and a legislative framework not supportive to the
development of the Canary Islands’ market;
There are also many opportunities such as a constant flow of tourists, an abundance of solar and wind
energy and the specific characteristics of each of the seven islands.
1
IMPACTUR 2012. Estudio del impacto económico del turismo sobre la economía y el empleo de las islas Canarias
European Service Innovation Centre - 12. Regional Performance and Potential
2.1. Socio-economic context for service innovation
The Canary Islands is one of the outermost regions in Europe. It is close to Africa, which is only 100
kilometres away, whereas the distance to mainland Spain is over 1,000 kilometres. More than two million
inhabitants live on the seven islands of El Hierro, Fuerteventura, Gran Canaria, La Gomera, Lanzarote, La
Palma and Tenerife; the majority of population lives on the two main islands – Gran Canaria and Tenerife –
while only 10,000 people live on El Hierro.2 Each island is different, having its own characteristics. Only
4.6% of the total population of Spain inhabit the Canary Islands, yet the average population density is more
than twice the Spanish average. When taking into account the flow of tourists, the two main islands, in
particular, are heavily congested.
Measured by population as well as by the contribution to national GDP, the Canary Islands are ranked eighth
among the 17 Spanish regions. Although the economy on the islands has not grown, it has not decreased
either, due to the resilience of the tourism sector to economic turbulence. The GDP per capita on the
islands at € 18,935 is, however, significantly below both the Spanish level of € 22,291 and the EU27
average of € 25,600. Unemployment is also an issue, almost every third member of the whole working
population was seeking work and, more alarmingly, nearly two thirds of all young people were
unemployed, in 20123.
The companies on the Canary Islands are mainly small and micro-sized, which is reflected in the low level
of private R&D. The R&D investments of companies have slightly decreased between 2000 and 2010, while
the level remains moderate due to the high concentration of SMEs in the service sector and the significant
number of self-employed workers that is more than half of the total number of companies. Public sector
administration accounts for 50.1% of the total R&D on the islands and a further 20% is provided by the
higher education institutions (HEIs).
The economy is dominated by the service sector, especially tourism and construction. Services account for
82.38% of GDP, followed by construction (7.76%), industry (4.43%), energy (4.33%) and agriculture
(1.1%). There are no notable differences compared to mainland Spain except for the share of the industry
sector, which is almost 9% lower on the Canary Islands. This is partly due to a lack of raw materials, the
peripheral location and the small local market.
Key points:
The majority of the population lives on the two main islands (Gran Canaria and Tenerife) making them
heavily congested;
The regional economy has not been affected to a large extent by the economic downturn due to the
resilient tourism sector. Tourism is a service-intense sector, and services account for more than 80 per
cent of GDP.
Sectoral structure and innovation orientation
The structure of the Canary Islands’ economy can be seen to be very specific, in particular, when
considering the relative weight of services. The contribution of tourism to the Canary GDP is extremely
significant. According to the European Cluster Observatory, tourism and hospitality was the only 3-star
cluster in Canary Islands in 2010, whilst construction and tobacco were rated as two 2-star clusters. The
relative importance and volume of tourism is also clearly visible in the accommodation statistics. In 2011,
there were 42,757 nights spent at tourist accommodation per 1000 inhabitants in the Canary Islands, while
the relevant figures for Spain was 8,447 and for EU-27 it was 4,711 (Source: Eurostat).
In 2010, the employment structure of Canary Islands had:
Almost 25% of the labour force in public administration, education and health care;
17% in the wholesale and retail trade, repair of motor vehicles and motorcycles;
14% in accommodation and food services;
2
RIS3 Canarias draft, march 2013
3
Eurostat news release 78/2013. Unemployment in the EU27 regions in 2012. 22.5.2013
European Service Innovation Centre - 2 9.5% in professional scientific, technical and service support activities;
9.1% in construction, 8.4% in arts, entertainment, recreation, activities of extra territorial organisation
and bodies; 5.8% in extractive industries, electricity, gas, steam, sewage and waste management;
5.5% in transport and storage; and
1% in information and communication.
In total, services generate 81.6% of the value added, compared to 69.9% at national level, employ 85% of
the labour force and 83% of the firms in Canaries operate in services4. Out of the total value added
generated by services, 40% is generated by commerce, repair of motor vehicles, transport and storage,
accommodation5 and food services, 22% by public administration and defence, education and human health
and social work activities, 11.5% by real estate activities and 7.9% by professional scientific and technical
activities and administrative and support service activities6. The importance of services and agriculture in
the employment structure has grown over time, whereas the relative importance of construction and
industry has decreased. Services employ 5% more workers and agriculture 0.2% more, whereas industry
decreased by 0.3% and construction contracted by 5.1% (Figure 1). Within the total G and I sector, the
percentage of people employed is shrinking, whereas the share of people employed in transport and storage
and in accommodation and food services is increasing (Table1).
Total employment dropped by 11.2% over the period 2008-2011. All sectors experienced an overall
decrease in employment, with construction and services witnessing the largest. Within services, the largest
decreases in employment were experienced by commerce, repair of motor vehicles, transportation and
storage, accommodation and food services with 2.4% and by professional, scientific and technical activities,
administrative and support service activities with 1%. Within services, the smallest decreases have been
experienced in real estate, information and communication and in financial and insurance activities.
However, these sectors employ very few people out of the total labour force.
Figure 1: Employment on the Canary Islands measured by the share out of the labour force
Employment by sector % out of the labour force
Services 85
79,8
Construction 7,2
12,3
Industry 5,7
6
Agriculture and fishing 2,1
1,9
0 20 40 60 80 100
2011 2008
Figure 2 illustrates a faster decline in the total number of companies in Canary Islands compared to Spain.
Trends in the evolution of the number of companies are different by sector, whereas the total number of
companies declined, some sectors experienced a net increase in the number of companies such as: Energy
and Water, ICT, Education and Services and Other Sectors compared to 2008 (Table 2). However this
increase in the number of companies reflects a fragmentation of companies as employment declined in these
sectors (Table 1). Although potential entrepreneurship is higher than in Spain 14.9% versus 12.1%, very
few actually realise their plans of establishing a company in Canary Islands and the total early stage
entrepreneurial activity is 4.6% (lower than the Spanish average of 5,7%). Moreover the rate of the survival
4
Confederacion Canaria de Empresarios, (2012), “Informe annual de la Economia Canaria. 2011”, p.328
5
Accommodation refers to the tourist industry
6
Confederacion Canaria de Empresarios, (2012), “Informe annual de la Economia Canaria. 2011”, p.328
European Service Innovation Centre - 3of newly founded companies is very low in the Canary Islands at 7.2% and this rate is even lower than the
Spanish average of 8.7%.
Figure 2: Illustration of the number of companies in Spain and on the Canary Islands
European Service Innovation Centre - 4Table 1: Sectoral employment structure of the Canary Islands: Source INE, CRE 2008-2012, reference year 2008. Own elaboration
Employment structure by type of sector
Total employment Employment Employment % out of the labour force
variation %
2008 2009 2010 2011 2011-2008 2008 2009 2010 2011
Agriculture and fishing 16.5 16.1 16.1 15.9 -0.1 1.9 2.0 2.1 2.1
Industry 51.6 44.8 42.9 43.3 -1.0 6.0 5.7 5.6 5.7
Construction 105.3 75.7 69.7 55.3 -5.8 12.3 9.6 9.0 7.2
Services 685.9 649.3 642.6 648.3 -4.4 79.8 82.6 83.3 85.0
Commerce, repair of motor vehicles, 327.2 302.9 298.5 306.8 -2.4 38.1 38.5 38.7 40.2
transport and storage, accommodation and
food services
Information and communication 9.5 8.3 8.1 8.1 -0.2 1.1 1.1 1.1 1.1
Financial and insurance activities 13.3 12.7 12.3 12.0 -0.2 1.5 1.6 1.6 1.6
Real estate 13.0 11.4 11.1 12.4 -0.1 1.5 1.5 1.4 1.6
Professional scientific and technical 90.0 83.5 81.3 81.2 -1.0 10.5 10.6 10.5 10.6
activities, administrative and support
service activities
Public administration and defense; 169.7 169.6 169.7 167.7 -0.2 19.7 21.6 22.0 22.0
education human health and social work
activities
European Service Innovation Centre - 5Arts, entertainment and recreation, activities 63.2 60.9 61.6 60.1 -0.4 7.4 7.7 8.0 7.9
of extraterritorial organizations and bodies
Total employment 859.3 785.9 771.3 762.8 -11.2 100.0 100.0 100.0 100.0
The Business Confidence indicator includes an indicator of overall business conditions and business confidence and is based on survey data asking companies for a
direction of change or tendency by reference to a ‘normal’ state, e.g. production level. Spanish companies were asked at the end of 2012 about their expectations in
terms of turnover, sales, employment and investment for their companies for 2013. Spanish companies had a negative expectation regarding the in turnover, sales,
employment and investment and had positive expectations regarding exports (CES, 2013). Turnover, sales, employment and investment experienced a decline in
2012, only exports grew by 20%, less than what it was expected. Overall, the actual results and expectations for 2012 followed the same direction expect for sales,
where a modest improvement was expected but instead a large decline was experienced. More than half of the companies surveyed on factors impeding economic
and business activity identified a decline in demand and also financial difficulties as the being most important factors, while very few identified lack of adequate
equipment or a shortage of skilled labour (Table 3). There is very little variation across sectors in the importance of increased competition, except for the
construction sector, which has experienced little increased competition but a higher decline in demand than the average (Table 4, Figure 4). The construction and
industry sectors experienced more financial difficulties than average, due to the fact that these sectors have been hit hardest by the crisis, and they have
experienced a higher decline in demand than average along with commerce (Figure 3). Transport and accommodation, as well as commerce, experienced an
increase in competition but the difference compared to the average was not so large (Figure 3, Table 4).
European Service Innovation Centre - 6Table 2: Number of companies in various industries
Number of companies
2008 2012
Variation
(2008=100%)
Agriculture and mining 61 52 85.24
Manufacturing 6071 4663 76.80
Energy and water 458 601 131.22
Construction 22659 15700 69.28
Hotels commerce and transport 63725 58991 92.57
ICT 1642 1815 110.53
Financial services 2608 2588 99.23
Real estate 5031 4843 96.26
Business services 23770 22801 95.92
Education and services 7586 8657 114.11
Other activities 9859 10470 106.19
Total 143470 131181 91.43
Source: CES, 2013 based on the Spanish National Institute of Statistics, Central Business Directory
Table 3: Factors that limited business activities in Canary Islands in 2013
Increased Decline in Financial Shortage Lack of Other
competition demand difficulties of adequate causes
Factors limiting adequate equipment
entrepreneurship skilled
activities in labor
Canary Islands in
2013
Lanzarote 47,6 83,9 60,5 14,5 7,3 39,5
Fuerteventura 43,6 89,7 56,4 13,7 9,4 35
Gran Canaria 37,2 80,3 46,8 6,3 3,7 31,2
Tenerife 40,1 88 58,1 6,3 6,7 28,9
La Gomera 27,8 74,1 68,5 5,6 3,7 38,9
European Service Innovation Centre - 7La Palma 39,8 88,2 68,8 9,7 7,5 46,2
El Hierro 25,6 83,7 72,1 7 4,7 32,6
Canarias 39,3 84,7 57,3 8,5 6,1 33,9
Source: CES, 2013 based on the Spanish National Institute of Statistics, Central Business Directory
Table 4: Factors that limit business activities in Canary Islands in 2014
Factors limiting Increased Decline in Financial Shortage Lack of Other
entrepreneurship competition demand difficulties of adequate causes
activities in adequate equipment
Canary Islands in skilled
2013 labor
Lanzarote 54,7 71,5 53,3 13,9 11,7 26,3
Fuerteventura 43,2 73,6 54,4 17,6 12,8 40,0
Gran Canaria 43,3 76,2 39,0 4,7 4,3 26,4
Tenerife 39,4 77,0 54,0 7,0 9,1 26,8
La Gomera 32,1 69,6 46,4 5,4 5,4 30,4
La Palma 53,8 84,0 64,2 10,4 7,5 45,3
El Hierro 19,2 94,2 65,4 11,5 11,5 36,5
Canarias 43,0 76,8 51,2 9,0 8,4 30,8
Source: CES, 2014 based on the Spanish National Institute of Statistics, Central Business Directory,
Notes: Base reference period 2013
Table 5: Factors that limited business activities in Canary Islands in 2013 by industrial sectors
Increased Decline in Financial Shortage of Lack of Other
competition demand difficulties adequate adequate causes
skilled labor equipment
Construction 27,3 89,8 79,7 11,7 8,6 37,5
Industry 39,4 86,9 65 5,8 8 38,7
Commerce 43,7 91,2 47,4 7,4 3,7 32,6
Transport and accommodation 43,5 84,1 52,4 11 8,5 35,4
Other services 37,6 76 55 7 3,5 29,5
TOTAL 39,3 84,7 57,3 8,5 6,1 33,9
Source: CES, 2013, elaborated based on Indicators of Business Confidence in Canary Islands: trimestrial series
ISTAC
European Service Innovation Centre - 8Figure 3: Factors limiting business activity by sectors
Source: CES, 2013, elaborated based on Indicators of Business Confidence in Canary Islands: trimestrial series
ISTAC
Table 6: Established business ownership rate versus potential entrepreneurship
TEA1 TEA1 Established Established Potential3 Potential3
Canary Spain Business Business entrepreneurship entrepreneurship
Islands Ownership Ownership Canary Islands in Spain
Rate 2 in Rate2 in
Canary Islands Spain
Year
2004 4,21 5,15 ND ND 7,7 5,4
2005 5,83 5,65 8,77 7,71 7,2 5,9
2006 7,83 7,27 5,07 5,45 7,8 6,3
2007 9 7,62 6,09 6,38 8,5 6,7
2008 7,16 7 8 9,1 9,5 7,5
2009 4,83 5,1 5,1 6,4 7,2 5,5
2010 3,6 4,3 5,7 7,7 9 6,7
2011 6,9 5,81 6,4 8,8 11,3 9,7
2012 4,6 5,7 7,2 8,7 14,9 12,1
Source: CES 2013, based on Global Entrepreneurship Monitor 2013
European Service Innovation Centre - 9Notes:
1. TEA represents total early stage entrepreneurship activities which combine nascent entrepreneurship and
businesses that were established less than three and half years half ago;
2. Established Business Ownership Rate measures the percentages of businesses that have remained active
over the last 42 months;
3. Potential entrepreneurship captures the percentage of individuals who are planning to start a business in
the next three years.
Figure 4: Innovative behaviour of Canary SMEs, relative to Spain and EU
ES7 Canarias (ES)
BUSINESS INNOVATION
Product or process innovators (%)
Marketing or organisational innovators (%)
Innovative SMEs collaborating with others (%)
SMEs innovating in-house (%)
0 10 20 30 40 50 60 70 80 90
Performance relative to ES Performance relative to EU
Source: Regional Innovation Scoreboard 2008. Data are normalized CIS 2008 data.
Key points:
Entrepreneurial spirit is high, yet the level of self-employment is rather low and the region has less
entrepreneurship than, for instance, the Balearic Islands or Greece, which are also locations with a
strong tourism sector. Furthermore, R&D intensity is not high and companies often lack an international
orientation;
Despite the share of tertiary education being close to the EU average, there is still room for
improvement concerning the general level of education. A brain drain and a high level of unemployment
among the young, educated population are also a challenge. However, the Canary Islands excel in
technological sub-fields such as astrophysics and renewable energy;
The Canary Islands have not yet capitalised on their potential for innovation and business model
generation, partly due to the bureaucratic administrative structures. The region also lacks an innovation
culture in the tourism sector. The public sector is mainly responsible for R&D targeting technological
innovation, which is reflected in the share of SMEs that are non-technological innovators, and this share
is significantly below that of Spain;
Financing innovation and growth has been a challenge for the Canary Islands and this is reflected in the
low levels of private sector R&D expenditure, as well as in the share of SMEs investing in in-house
innovation activities. Considerable amounts of EU funding target traditional R&D based development,
instead of focusing on non-technological innovation;
Several sectoral networks and cluster organisations exist on the Canary Islands but the share of
innovative SMEs collaborating with others is very low. In addition, there do not seem to be many inter-
sectoral links in the region, but the local policy networks are relatively good;
Tourism contributes significantly to the Canary Islands’ GDP, with the tourism and hospitality cluster
being the only 3-star cluster in the region;
A quarter of the labour force works in public administration, education and health care;
European Service Innovation Centre - 10 Services generate over 80% of value added, exceeding the national average by ten per cent. The
relative importance of services and agriculture has increased whilst that of construction and industry has
decreased;
Overall employment has decreased by more than 10% between 2008 and 2011 and this has most
affected the construction and services sectors.
Strengths and weaknesses of the innovation system
The Canary Islands’ innovation system has been reviewed according to the functions of innovation systems,
as defined in the ESIC Concept Note. An overview is presented below of the five functions of entrepreneurial
activities, knowledge development and transfer, innovation and business model generation, financing growth
and innovation and collaboration and networking. The five elements constitute an innovation system that is
able to transform a region into a service based knowledge ecosystem, assuming the elements are in place
and are fully functional.
Table 7: Strengths and weaknesses per function of Canary Islands’ innovation system
Function of Structural indicators Regional EU 27 Dynamics/change
innovation value
system
Share of people who think it is important to try new 0.61 0.42 N/A
and different things
Entrepreneurship Share of people who think it is important to be 0.76 0.54 N/A
activities creative
Labour productivity growth 2.35 2.20 On decrease
New business formation in the region 4.6
Total expenditure on R&D (GERD) (%age of GDP) 0.51 1.68 Stagnant
Knowledge Share of employees with a higher education degree 29.3 30.4 Increased 2000-2010
development and (in %age)
transfer
Share of researchers among employees (in % age) 0.05 0.34
business sector
Business expenditure on R&D (BERD) (%age of 19.9 61.3 Slight decrease 2000-
GDP) 2010
Employment share in medium-high-tech and high- 0.93 6.39 Stagnant 2000-2010
tech manufacturing
Innovation and
business model Employment share in knowledge intensive services 28.63 35.32 Slight increase 2000-
generation 2010
Employment share in service innovation intensive 2.40 4.85 Slight increase 2000-
industries 2010
Companies with service innovations (in %age) 5.0 8.1
European Service Innovation Centre - 11Gross Fixed Capital Formation (%age of GDP) 34.7 19.6
Financing innovation Availability of seed and venture capital Rated
and growth between
poor and to
be improved
on the SAT
Share of innovators collaborating with others (in 5.3 9.9
Collaboration and %age)
networking
Specialisation in service-oriented clusters 0.85 1.00
Table 7 presents a number of structural indicators as well as the change in their values, when available, in
the five categories mentioned above. The Canary Islands region appears in a relatively positive light. The
structural indicators measuring entrepreneurial activities suggest that the region has performed better
than the EU27 Member States on average. In addition, based on the Global Entrepreneurship Monitor, the
entrepreneurial spirit is quite high. However, this does not seem to be reflected in employment as the level
of self-employment is somewhat low at 13.3%, which is well below similar regions that have a rate of
19.8% and below the EU27 average of 15.1%. According to the GEM Total Entrepreneurial Activity Index,
the Canary Islands are also lower in entrepreneurship when compared with some other locations that have a
strong tourism sector, such as the Balearic Islands or Greece. The entrepreneurial base does not seem to be
very strong in the knowledge intensive sectors nor is it reflected in strong R&D intensity. There also seems
to be evidence that companies are not necessarily very internationally oriented but tend to cater for the
local or the domestic markets in mainland Spain.
When it comes to knowledge development and transfer, the Canary Islands as a region does not
perform well. All three structural indicators in this category, but most notably the total expenditure on R&D,
are below the EU27 average. Little general knowledge of service innovation seems to be available. Although
the share of tertiary education is rather high at 29.3% and close to the EU average, the general level of
education seems to be lower than in some European regions. Unemployment has been on the rise amongst
highly educated young people, which is problematic as so much talent and potential remains untapped, and
this, in turn, reinforces the brain drain to mainland Europe or even to South America. This situation presents
a serious challenge to local knowledge development and capacity building.
However, it must be acknowledged that there are some technological sub-fields with strong international
reputations. For instance, the Marine Technology Institute is amongst the best in the world, producing
publications that are well-known and respected world-wide. There are also some important research
infrastructures on the islands in the fields of astrophysics and renewable energy. However, in terms of
patent applications and scientific publications, the capacity to generate new technology and scientific break-
through is not a major strength. Also, patents are especially beneficial for high-tech manufacturing
industries but for innovation in service industries they are generally less useful. In times of open innovation,
it can be useful to have access to new technologies but they do not have to be invented on the Canaries.
The structural indicators related to innovation and business model generation illustrate a significant gap
between the Canary Islands and the EU27 average, despite slight increases in the share of employment in
medium-high-tech and high-tech manufacturing, as well as knowledge-intensive services. It can be said that
the Canary Islands region is not among the best regions in Europe although there are indications that it
possesses considerable potential. There are several examples of innovative approaches in various sectors,
including tourism, but there seems to be quite a lot of unnecessary bureaucracy and administrative and
regulatory barriers that hamper the innovation process. The ESIC team also identified the lack of an
innovation culture, especially in the tourism sector, which to a large extent may be related to the position of
the Canary Island in the value chains and its long-term emphasis on mass tourism.
Much of the R&D spending is taking place in the public sector and appears to be rather technology oriented.
This is also evidence of a low share of employment in knowledge intensive services. The innovation
behaviour of SME’s is also of importance. For service innovation, non-technological innovations, in the form
of organisational changes and new business models, seem to be even more important than patents or
publications. However, as Figure 4 shows, the share of SMEs which are non-technological marketing or
organisational innovators is about 50% below that of Spain’s.
European Service Innovation Centre - 12The only structural indicator measuring financing innovation and growth implies that progress exceeds
that of the EU27 average level, while the SAT results called for the increased availability of seed and venture
capital funding. During the study visit, the ESIC team identified financing as a challenge for the region
because companies struggle for funding. The general R&D expenditure is somewhat low and, especially, the
private sector R&D expenditure (BERD) has been consistently low. Additionally, the share of SMEs that
invest in in-house innovation activities is only half that of the share for Spain as a whole (Figure 4).
The heavily bureaucratic administrative system, with regulations to be respected at EU, national, regional,
and local levels, presents an almost insurmountable barrier to financing innovation and growth. The Canary
Islands have also directed a considerable amount of the EU Structural Funds to ‘core research and
technological development’, and relatively much less to ‘business innovation support’, while, naturally, the
latter type of spending is more relevant to service innovation. The Canary Islands Development Company
(SODECAN) has some funding that may be well-suited to innovative start-ups and instruments that
complement other national and EU funding sources. It is, however, too early to assess the impact of such
new instruments.
Finally, collaboration and networking are rather strong features in the Canaries, in the sense that many
sectoral networks and cluster organisations exist. However, compared to both the EU and Spanish averages,
the share of innovative SMEs, which collaborate with others, is very low. Also inter-sectoral networks seem
to be quite weak, which might pose a problem for service innovations that take place in the various support
functions for tourism or at the interfaces of these different functions. However, because of the compact and
somewhat insular location, the local policy networks appear to be quite effective.
Table 8: Strengths and weaknesses per function of the Canary Islands’ innovation system
Function of the Strengths Weaknesses
innovation system
Entrepreneurial activities Well-developed entrepreneurial attitude, Low self-employment
based on GEM data
Low level of private sector R&D
Low level of European/ international
cooperation
Knowledge development Relatively high share of people with Knowledge output in terms of patents and
and transfer tertiary education. publications lower than the average of the
Some subfields excel in their domain, for EU27 and mainland Spain.
example, marine technology,
astrophysics, water and renewable
energy Low level of general education
High un-employment among young,
Relatively good knowledge infrastructure highly educated people
in some areas such as energy and
astrophysics Brain drain
Low capacity in many firms to capitalise
on knowledge
The fit between knowledge supply and
knowledge demand is not optimal
Innovation and business Innovative solutions and expertise can Lack of an innovation culture
model generation be found in various sectors such as
energy and water Overly-heavy bureaucracy
Financing innovation and New financial instruments for innovative Companies struggle to find funding
growth entrepreneurs such as through
SODECAN Lack of private funding to match public
support
European Service Innovation Centre - 13Collaboration and Relatively good networks among Lack of cooperation and communication
networking policymakers between clusters/sectors
Inter-sectoral and cluster networks and Lack of private/public collaboration
collaborative organisations
The administrative model is complex with
relatively high levels of bureaucracy and
inefficiency.
All in all, this study gives the impression that the Canary Islands’ innovation system is rather
unbalanced in that there are a few high-level nodes of R&D activities but, in general, the innovation
performance is moderately low, especially in the private sector. In addition, the various functions appear to
be more geared toward technological development than to service innovation, although the regional
economy is very service oriented.
2.2. Regional benchmarking
The benchmarking exercise reveals that the Canary Islands is a relatively poor region where the inhabitants
produce on average 26% lower GDP per capita than the EU27 average, and 76% less than the average of
the other large-scale demonstrator regions that are amongst the most well-off regions in Europe with a GDP
per capita that is 46% higher than the EU27 average. The tax system increases the average disposable
income in Canary Islands by 4%, so redistribution makes a modest contribution. On average, the
inhabitants have 20% less disposable income compared to the EU27, and 15% less than most similar
regions. Compared to the EU27 average, in relative terms, there are 12% less self-employed people in the
Canary Islands.
Long-term unemployment has risen exponentially in the Canary Islands. The region is one of 10 European
regions that reported a rise in overall unemployment of more than 10% between 2007 and 20107. Long
term unemployment has rocketed in Spain, since the economic crisis took hold in 2007 and now one in two
people without work are classified as being long-term unemployed. Long-term unemployment is 2.25 times
higher than the EU27 average. In absolute terms, it is 13.4% compared to 4.1% in the EU27 and 5.4% in
the most similar regions. Young people and workers over 45 years of age are particularly affected by long
term unemployment and youth unemployment is especially alarming. The Canary Islands is one of six
regions in which the youth unemployment rate exceeded 50% during 20108.
In terms of educational qualifications, the percentage of employees with ISCED 5-6 is similar to the EU27
average, the large demonstrator’s average and the most similar regions. Labour productivity growth is also
similar to the EU27 average in the Canary Islands but this growth was 34% less than in the most similar
regions.
Support for business innovations from the EU Structural Funds is 20% less in the Canary Islands than the
EU27 average, whereas the amount of the Structural Funds devoted to core research and development
activities is 40% higher than the EU27 average. The RIM annual report 2012 shows that the share spend on
business innovation support has been increasing in most regions, at the expense of the share for core R&D
that mostly comes from public sources. When the share of services in the economy is very high, as in the
Canary Islands, supporting business innovation seems to be more relevant than assisting R&D activities.
EPO Patent applications are 90% lower than the EU27 average. However the percentage of high tech patent
applications out of the total of filed patents is only 10% lower than the EU27 average. Compared to the
EU27, most similar regions and demonstrator regions, the Canary Islands has a lower level of specialisation
in knowledge-intensive services and a lower employment share in knowledge intensive services, 18% less
than the EU27 average but similar to the most comparable regions. However, when the time dimension is
taken into consideration, looking at the changes in employment in knowledge intensive business services
(KIBS) over the period 2000-2010, a higher increase in employment in KIBS of 30%, compared to the EU27
average, can be observed. The increase in employment in KIBS has been more than twice as high than in
7
Eurostat Regional Yearbook 2012.
8
Ibid
European Service Innovation Centre - 14the most similar regions, suggesting that although Canary Islands is doing better than the EU27 average, it
has not, as yet, attained its full potential.
Figure 4: Index-based benchmarking of the Canary Islands to EU27=100%.9
Benchmarking Canary Islands
Most similar regions Demonstrator Regions Canary Islands
-125-100 -75 -50 -25 0 25 50 75 100 125 150 175 200 225 250
Labour productivity growth (%)
Change in employment share in service innovation intensive…
Change in employment share in knowledge-intensive…
Employment in service innovation intensive industries (%…
Employment in knowledge-intensive services (% total…
Specialization in service-oriented clusters (location quotient)
Specialization in knowledge-intensive services (location…
Employment in medium-high & high-tech manufacturing (%…
EPO high-tech patent applications (% patent applications)
EPO patent applications (per million population)
Business expenditure on R&D (BERD) (% GERD)
Total expenditure on R&D (GERD) (% GDP)
Quality of Government (index)
Structural funds on core RTDI (Euros per million population)
Structural funds on business innovations (Euros per million…
Long-term unemployment (% workforce)
Self-employed persons (% workforce)
Disposable income (Euros)
GDP per capita (Euros)
Compared to the most similar regions, the specialisation in service-oriented clusters in the Canary Islands is
below their average while employment in service innovation intensive industries is also lagging behind most
similar regions and the EU. In terms of employment, the Canary Islands have half as many people employed
in service innovation intensive industries than the EU27 average. The change over the last decade in
employment in service innovation intensive industries has been 13% less in the Canary Islands compared to
the EU27 average. When compared with the most similar regions, the Canary Islands have experienced a
growth of employment in service innovation intensive industries that is three times slower. It is 1.5% in the
most similar regions, compared to 0.53% in the Canary Islands.
The total expenditures on all R&D and on business R&D are both 70% less than the EU27 averages. The
Canary Islands spend less on R&D than even the most similar regions.
The Canary Islands’ region is mostly a service oriented region, with a strong focus on tourism. The Canaries
have a seven times higher number of tourist arrivals, compared to the EU27 average, and 1.5 times more
9
Notes: All the figures are calculated first as a percentage of the EU27 average value and then 100 is subtracted.
Positive values indicate that the figures of Canary Islands are higher than the EU27 average and negative values
indicate that the values of the Canary Islands are lower than the EU27 average figures.
European Service Innovation Centre - 15tourists, compared to most similar regions. The number of average nights that tourists spend in a hotel in
Canary Islands is almost twice as high when compared to most similar regions and 17 times higher when
compared to the EU27 average. The Spanish Island Region of the Canaries and the French Capital Region of
Ile de France had by far the highest numbers of overnight stays in 2011, with 89.8 million and 77.2 million
respectively10. They were followed closely by Cataluna (69.3) million, Illes Balears (64.3 million) and Veneto
(63.4 million) overnight stays.
When the total number of nights for the Canary Islands is adjusted by the population, two troughs are
apparent in 2004 and 2008, and these are then followed by a slight recovery during 2009 to 2011. The
tourism intensity/ tourism pressure is less in the Canary Islands than the Balearic Islands.
Figure 5: Tourism intensity/tourism pressure
Number of tourist arrivals per 1000
Nights spent at tourist
population
accomodation establishments per
10.000 1000 population
80000
9.000
8.000 70000
7.000 60000
6.000 50000
5.000
40000
4.000
3.000 30000
2.000 20000
1.000 10000
0
0
2000 2002 2004 2006 2008 2010
2000 2002 2004 2006 2008 2010
Most similar regions Canarias
Most similar regions Canarias
EU 27 Illes Balears EU 27 Illes Balears
Source: Eurostat: total nights spent by non-residents
The Canary Islands region is among the top six regions within the EU in terms of visits by foreign tourists.
These regions are Canarias, Illes Balears, Cataluña, Inner London, Île-de-France and Veneto11. The number
of tourist arrivals is higher in the Canary Islands than in Balearic Islands. The rate of occupancy in hotels
and similar accommodation in the Canary Islands was 68.9% in 2012 and higher than for Spain at 53%, and
higher than in any other European region, except the Balearic Islands, which had a rate of 77.9%12.
Key points:
The Canary Islands, as a region, is not as well-off as many other European regions in terms of GDP per
capita and the people living in the region have 20% lower disposable income compared to the EU27;
In relative terms, long-term unemployment is 2.25 times higher in the Canary Islands compared to the
EU27, whilst overall unemployment rose by more than 10% between 2007 and 2010. Unemployment
hits the young and those aged 45 or over, the hardest;
There has been a greater increase in employment in KIBS of 30%, during the period 2000-2010,
compared to the EU27 average, which is more than twice as high as the figure for the most similar
regions;
In terms of the EU Structural Funds, support to business innovations is 20% less in the Canary Islands,
whereas funding for core R&D activities is 40% higher than the EU27 average;
Patent applications to European Patent Office are 90% lower than the EU27 average;
The total expenditure on R&D, as well as business R&D expenditure, is 70% less than the EU27
averages;
The number of tourist arrivals in the Canaries is seven times higher compared to the EU27 average.
To sum up, the main strengths of the region are its tourism sector and some pockets of core RTDI in the
public sector.
10
Tourism statistics at regional level
11
Ibid
12
Eurostat. Net occupancy rate of bed-places and bedrooms in hotels and similar accommodation
European Service Innovation Centre - 162.3. Opportunities and demands for service innovation
A region such as the Canary Islands seems ideal for service innovation and this is also stated in the region’s
Concept Note: “Canary Islands represent the best laboratory to effectively test the transformative power of
service innovation to tackle societal challenges and to then replicate this approach in regions with similar
conditions”. A region characterised by year-round tourism and a strong service sector should provide a solid
basis for developing new business models and value chains, based on service innovation.
According to the background analysis and the interviews conducted on the Canary Islands, the time so far
has not been right for introducing service innovation to the regional stakeholders. This is also reflected in
the preference to spend EU Structural Funds on core RTDI, rather than on business innovation, which
favours supply-side innovation policy over demand-side policy. This preference may cause difficulties for
activities that seek to strengthen service innovation and, therefore, there is a greater need for increased
awareness-raising about the potential that service innovation possesses and the possibilities that it presents.
The activities conducted by actors such as Turisfera (see section 3.1) play a key role in emphasising the
need for sustainable business models and reinventing those that are no longer durable.
Based on the strong service orientation in the Canaries, as well as on the massive flow of international
tourists to the islands, there is an abundance of opportunities and also a demand for service innovation.
Until now, demand has not been satisfied by new service offerings, and there is a particular lack of those
that are built on user-driven innovation. There are several reasons for this situation.
Firstly, the tourism sector is not run, for the large part, by local people. International tour operators play a
major role in channelling the large flow of tourists. Most hotel-owners depend on this channel or ‘global
pipe-line’, through which they are competing on costs with their peers in other popular destinations. This
dependency makes it difficult for the local hotel-owners to invest in innovation and develop new markets. In
addition, the tour operators dictate when the tourists arrive. The ‘high season’ is decided months in advance
and charter flights schedules are planned accordingly. As a consequence, there are very few flights outside
this high season. Even if there is a demand, as was the case when there were unstable situations in some
other competing holiday destinations like Northern Africa and Turkey, flights could not be organised and so
hotels, restaurants and other service providers went empty handed. Also, part of the income generated by
tourism always goes, or stays, abroad due to the dominance of international operators.
Secondly, the tour operators are the key clients for the local service providers, and especially hotels,
whereas the tourists are the clients of the operator. Service providers on the islands are not very aware of
the needs of the users, the tourists, and these needs are not monitored. This is reflected in the way in which
the tourists are seen. They are regarded as being mass consumers, instead of being seen as individuals with
various needs, wishes and interests to which services could be tailored and further developed. For several
decades, the Canary Islands have offered the visitors “sand, sea and sun” and many tourists continue to
visit the most popular attractions over and over again. However, due to increased international competition
from new destinations that can operate at even lower costs, the tourist sector will have to diversify and
innovate to demonstrate that the Canary Islands can offer more than the traditional package of sand, sea
and sun. In addition, other sectors can support, and benefit from, a transformation towards new business
models.
Consumers are becoming more and more demanding, and new niche markets are emerging13. As the seven
islands are diverse, they have a huge potential to offer an array of leisure and tourist services on the
Canaries. Some good examples already exist such as the Ironman Competition, Astrotours (see Box 1) or
certain beaches that offer excellent conditions for surfing. Even the LGBT (lesbian, gay, bisexual and
transgender) community can be regarded as a potential niche market. Another niche market could be cruise
travellers even though they might only spend a few hours on shore.
13
Stamboulisa, Y. & P. Skayannisb (2003) ‘Innovation strategies and technology for experience-based tourism’.
Tourism management; Vol. 24, Issue 1, p. 35–43
European Service Innovation Centre - 17You can also read